Article Text

Abstract
Background: Particulate air pollution has been associated with increased cardiovascular deaths and hospital admissions. To help understand the mechanisms, the types of particles most involved, and the types of persons most susceptible, the association between exposure to summertime air pollution and heart rate variability (HRV) was examined in a panel study of 28 elderly subjects.
Methods: Subjects were seen once a week for up to 12 weeks and HRV (SDNN, r-MSSD, PNN50, low frequency/high frequency ratio (LFHFR)) was measured for approximately 30 minutes at each session using a defined protocol. Temperature, day of the week, and hour of the day were controlled, and dummy variables for each subject were controlled for subject specific risk factors.
Results: PM2.5 was associated with r-MSSD (−10.1% change for an interquartile range (IQR) increase in exposure (95% CI −2.8 to −16.9)) and PNN50, but stronger associations were seen with black carbon, an indicator of traffic particles, which was also associated with SDNN (−4.6% per IQR (95% CI −2.0 to −7.2)) and LFHFR. Secondary particles were more weakly associated with r-MSSD, as was ozone. No associations were seen with SO2 or NO2. CO had similar patterns of association to black carbon, which disappeared after controlling for black carbon. Black carbon had a substantially higher effect on SDNN in subjects who had had a previous myocardial infarction (−12.7%, 95% CI −5.7 to −19.25).
Conclusions: Particles, especially from traffic, are associated with disturbances of autonomic control of the heart.
- CO, carbon monoxide
- HRV, heart rate variability
- MI, myocardial infarction
- NO2, nitrogen dioxide
- PM, particulate matter
- SO2, sulphur dioxide
- air pollution
- heart rate variability
- traffic
- elderly
Statistics from Altmetric.com
- CO, carbon monoxide
- HRV, heart rate variability
- MI, myocardial infarction
- NO2, nitrogen dioxide
- PM, particulate matter
- SO2, sulphur dioxide
The air pollution disasters of the 20th century clearly showed that acute changes in air pollution were associated with similarly rapid changes in daily death rates.1–3 Most notable was the London smog episode of December 1952 where 4000 excess deaths were recorded in a week in response to an extreme episode of increased particle and sulphur dioxide (SO2) concentrations.1 A key finding was that sudden deaths were increased more than respiratory or cardiovascular deaths in general.1 In 1994 we analysed death certificate data from Philadelphia contrasting high and low air pollution days.4 The percentage increase in sudden deaths associated with particulate air pollution was approximately five times the percentage increase in all deaths. Particulate air pollution has been associated with daily deaths from cardiovascular disease in numerous studies over the last decade.5–7 Out of hospital deaths appeared to account for most of the increase.6 These cardiovascular responses have been shown to occur with little latency after exposure.8
One possible mechanism for this association is by altering autonomic control of the heart. Animal studies have shown that exposures to combustion particles can produce reductions in heart rate variability (HRV), a risk factor for sudden death9 and, in compromised animals, death from arrhythmia.10 Our previous study in Boston found a significant decrease in HRV associated with PM2.5 and ozone.11 Similar decreases in HRV have been noted in a study of elderly subjects in Baltimore12 and in a younger occupational cohort in Boston.13 The association in the workers persisted when restricted to days when they were off work,14 indicating that younger subjects are also sensitive to exposures to environmental particles.
The goals of this study were to replicate the results of the 1997 study, to examine the association with particles from different sources (especially traffic), to examine the shape of the concentration-response relation, to look for heterogeneity in response and identify its sources, and to examine other pollutants more fully.
METHODS
Study design and protocol
We recruited a panel of 28 subjects (aged 61–89 years) living at or near an apartment complex located on the same street as the Harvard School of Public Health, a few cross-streets away. A baseline questionnaire regarding medications, pulmonary and cardiac symptoms, and smoking history was administered and a resting 12-lead ECG was performed. Exclusion criteria included unstable angina, atrial flutter, atrial fibrillation, or paced rhythm. Each subject was given a day of the week and a time of day for testing, with the goal of being seen weekly for 12 weeks during the summer of 1999. Each week participants were administered a questionnaire regarding chest pain, medication changes, and whether medications had been taken that morning. Continuous Holter monitoring with electrodes in a modified V5 and AVF position were performed during a protocol similar to that of 199711 involving (1) 5 minutes of rest; (2) 5 minutes of standing; (3) 5 minutes of exercise outdoors (if the participant felt able, a standard walk was performed involving one climb up a slight incline); (4) 5 minutes of recovery; and (5) 3 minutes and 20 seconds of paced breathing. For 20 respiratory cycles the participant was asked to breathe in for 5 seconds and then out for 5 seconds, with a technician coaching. One subject only completed a single visit and was therefore excluded from the analysis.
Processing of Holter recordings
A trained engineer reviewed and, when necessary, corrected automatically determined readings of QRS complexes. Regions of noise and artifact were eliminated. After correction, only normal-to-normal (NN) intervals between 150 and 5000 ms with NN ratios between 0.8 and 1.2 were included for analysis of heart rate variability. For the entire protocol duration we computed the standard deviation of normal RR intervals (SDNN), the root mean squared differences between adjacent RR intervals (r-MSSD), and the proportion of adjacent NN intervals differing by more than 50 ms. The low frequency/high frequency ratio (LFHFR), a frequency domain outcome reflecting the balance of the sympathetic versus parasympathetic components of the nervous system,15 was also computed.
Air pollution measurements
Air pollution measurements (PM2.5, black carbon, carbon monoxide (CO)) were collected at the Harvard School of Public Health within a kilometre of the residences of the subjects. Measurements of SO2, ozone, and nitrogen dioxide (NO2) were obtained from the State monitoring sites in Boston. Continuous PM2.5 was measured using the Model 1400A Tapered Element Oscillating Microbalance (TEOM) (Rupprecht and Patashnick, Albany, NY, USA). Since the TEOM sample filter is heated to 50°C, PM2.5 concentrations are corrected to compensate for the loss of semi-volatile mass that occurs at this temperature using a season specific calibration factor. The calibration factor was obtained by regressing 24 hour averaged TEOM concentrations on collocated integrated 24 hour Harvard Impactor Teflon filter gravimetric measurements. Black carbon was measured using a model AE-14 Aethalometer (Magee Scientific Inc, Berkeley, CA, USA) which has agreed well with EC in comparisons.16,17 Carbon monoxide (CO) was measured with a ThermoEnvironmental (Franklin, MA) Model 48 gas analyser using a US EPA reference method for CO.
In the summer in Boston, long range transported sulfate particles are a major component of PM2.5. These particles are not black, and the black carbon measurements are surrogates for the primary (that is, directly emitted) carbonaceous particles, most of which derive from traffic. In Boston, hourly sulfate concentrations are not well correlated with hourly black carbon concentrations because they originate from different sources, sulfate particles being regional in nature while traffic particles are primarily emitted from local sources. As a result, sulfate and black carbon tend to have different diurnal profiles, especially in the summer months, with sulfate concentrations have a broad peak in the late morning to early afternoon while the highest levels of black carbon occur during morning and evening rush hours (Oh JA, doctoral dissertation, 2000). Other secondary particles (that is, those formed by reactions in the atmosphere from gaseous emissions), including nitrates and organic carbon also follow different temporal patterns than black carbon. This poor correlation allows us to estimate the concentrations of such secondary particles by regressing PM2.5 (which includes particles from all sources) against black carbon concentrations. The residuals represent hourly variations in particle mass concentration that is independent of both fresh traffic particles and transported black carbon, whose primary source is regional traffic. Thus, the residuals represent predominantly secondary particles independent of black carbon, of which sulfate particles are the largest components during the summer in Boston. We have used these residuals as a surrogate for secondary particle concentration.
Analysis of data
The data in our study existed on multiple levels. Data such as HRV were measured for each person, for each observation time. Other data such as medical characteristics of the subjects were fixed and did not change from visit to visit. Our analysis took into account these multiple levels.
HRV measurements were log transformed for normality. We examined HRV measurements for the entire visit (25–30 minutes). This longer interval has less noise than the 5 minute intervals. Longer wavelength components also contribute a greater fraction of total HRV than in the 5 minute measurements. This allows us to distinguish whether the low frequency to high frequency ratio is disturbed by air pollution.
Each subject served as his or her own control. This was accomplished by including dummy variables for each subject in the regression models. These controlled for all time invariant subject specific risk factors such as baseline medical condition, smoking history, etc, whether measured or not. This is a major strength of this study design. The regression also included dummy variables for day of week and hour of day, which controlled for diurnal and weekly variations in autonomic function or air pollution, indicator variables for whether the subjects had taken their medication before the examination, and a regression spline (3 degrees of freedom) for temperature. A time trend variable was also included.
While these models control for subject specific characteristics, they do not account for possible heterogeneity of response to air pollution. To address this question we used hierarchical models. A hierarchical model is simply a model with multiple levels of analysis. Specifically, we assumed:

where Yit is the logarithm of HRV in subject i at time t, b0 is the overall intercept, and ui is the separate intercept for subject i. For the pollution model b1 is the slope representing the overall effect of pollution, and vi captures the variation of the slope for subject i about that overall mean. This gives us the opportunity to examine the distribution of subject specific slopes to see, for example, whether any adverse effect is primarily concentrated in a few susceptible individuals or whether pollution has an adverse impact on most or all subjects. In this model we treat the vi as random effects.
The second level of the model is only at the level of the subject. Here we examine whether the variability in susceptibility of individual subjects may be explained by some factor Zi which may represent a diagnosis (previous myocardial infarction), medication use (beta blockers), etc. This model takes the form:

where hi is the coefficient of the susceptibility factor Zi and di represents the remaining subject specific intercept for subject i which is not explained by Zi. This is formally identical to having an interaction term between the susceptibility factor Z and the exposure in the model, but recognises that this may not explain all heterogeneity in slope (reflected in di). This multilevel model was estimated using the linear mixed effect function in Splus. The possible effect modifiers were whether the subject had a diagnosis of a myocardial infarction, congestive heart failure or chronic obstructive pulmonary disease, whether their measured systolic blood pressure was greater than 140 mm Hg, and whether they were on β blockers.
Our strategy was first to try to replicate our original finding of an association between PM2.5 and ozone with r-MSSD and a weaker association with SDNN. We then turned to a fuller range of HRV measures and measurements of different particle components to test the hypothesis that traffic particles are more important, and finally to inclusion of other air pollutants.
Our previous study found that ozone was associated with HRV using the immediate hour’s exposure. The PM2.5 association was strongest with the mean concentration in the preceding 4 hours, but also with the preceding 24 hour average. In this study we therefore examined those three time frames: pollution averaged over the preceding hour, the preceding 4 hours, and the preceding 24 hours before each person’s HRV measurement.
RESULTS
Table 1 shows the distribution of the personal characteristics of the participants and of the environmental variables in the study. The median age was 74 and participants were predominantly female. Eleven participants completed all 12 visits, 13 completed 11 visits, three completed 10 visits, and one completed five visits. The correlation coefficients among the exposure variables are shown in table 2.
Characteristics of the 27 subjects and environmental variables in the 1999 Boston Elders Study, including regular medication use
Correlation among the exposure variables (24 hour averages)
Particle model
As expected, peak periods of PM2.5 and black carbon did not occur at the same time. Figure 1 shows a plot of the black carbon versus PM2.5 data used in our study. While at low levels there is correlation between the two measures, the peak periods for each pollutant are distinct, enabling us to distinguish between carbonaceous and non-carbonaceous particles. Black carbon explained 30% of the variation in PM2.5 concentration, and the residuals from that model were used as a surrogate for non-carbonaceous secondary particles.
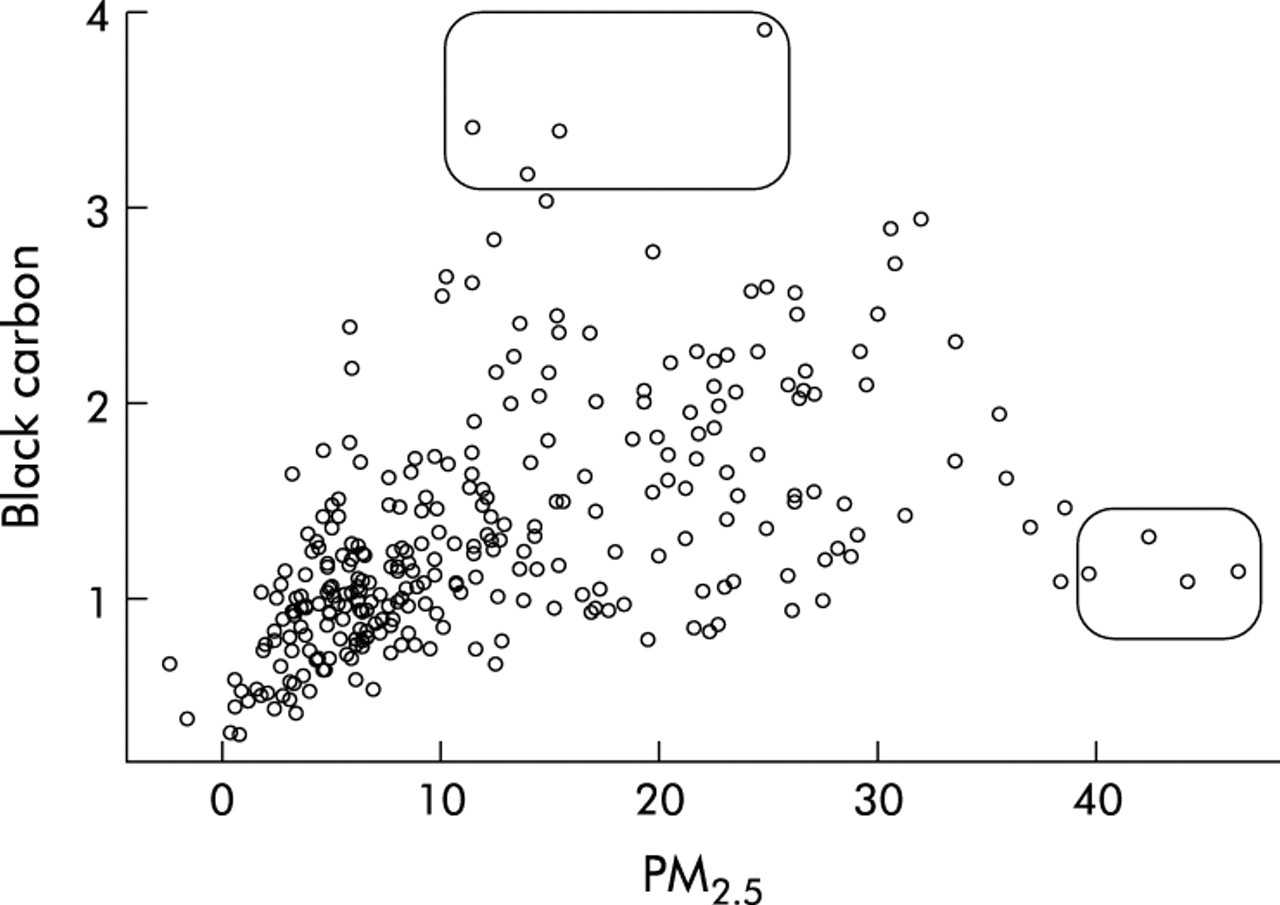
Scatter plot of hourly black carbon versus PM2.5 measurements in Boston during the time when HRV measurements were being taken. The boxes highlight the four highest black carbon and PM2.5 measurements, respectively, and they each occur at unexceptional levels of other particle measurements.
Replication
We were able partially to replicate our 1997 study. We found an association between the mean of the previous 24 hour PM2.5 (percentage change for an interquartile range (IQR) increase in exposure −10.1% (95% CI −2.8 to −16.9)) and the previous hour’s ozone (percentage change for an IQR increase of exposure −8.5% (95% CI 0.3 to −16.6)) with r-MSSD, although the association with ozone was substantially weaker than in the previous study.11 In this study the PM2.5 association was stronger with the 24 hour average than with the 4 hour average, although the 4 hour average was also associated with decreased r-MSSD (percentage change −8.6% (95% CI −0.1 to −16.3)).
Particle effects
The associations with the three particle measures (fit separately) are shown in table 3. In general we observed a gradient of responses—that is, for PM2.5 and black carbon the magnitude of the percentage change in HRV outcome for a given change in exposure was PNN50 > r-MSSD > SDNN for both averaging periods. For secondary sulfate particles the magnitude and precision of the effect estimates for effects on HRV were lower than for all fine particles or for the carbonaceous particles, particularly for SDNN. The same pattern of larger effects for PNN50 and lower effects for SDNN was seen.
Percentage change in heart rate variability associated with an interquartile range increase in particle exposure
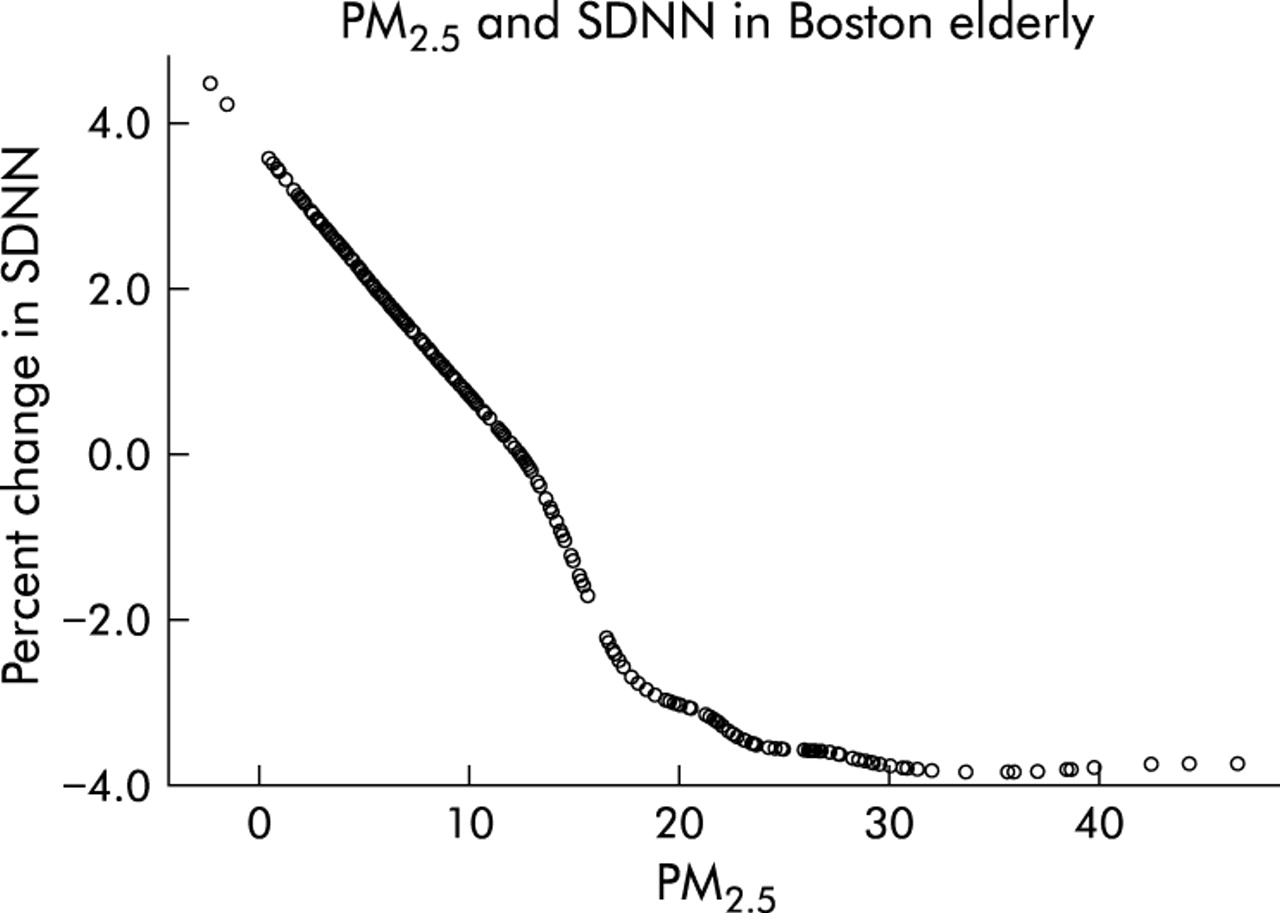
Only black carbon (percentage change −4.6% (95% CI −2.0 to −7.2)) showed a convincing association with SDNN. Black carbon was also the only particle measure to show a significant effect on the ratio of low frequency to high frequency components of HRV. Figures 2 and 3 further illustrate the pattern of association of particle measures with SDNN. Figure 2 shows the estimated relation between black carbon and SDNN using a loess smooth with about 3 degrees of freedom. The association is quite linear across the range of exposures in the study. In contrast, fig 3 shows the same relation using PM2.5 as the exposure metric. For low concentrations, when the correlation between PM2.5 and black carbon was good (as in fig 1), there is again a roughly linear association with SDNN. At high doses of PM2.5 which are uncoupled from black carbon, the association flattens out. On the other hand, the associations between PM2.5 and r-MSSD and PNN50 were similar in magnitude to the association with black carbon, although somewhat less precise. The magnitude of effect for secondary particles was smaller, suggesting that PM2.5, which includes fresh traffic particles, is acting in part as a surrogate for the black carbon effect in these relationships.

Smoothed plot of the percentage deviation from predicted SDNN (based on the model with all other covariates) versus black carbon concentrations in Boston. The association is nearly linear, despite being fit with about 3 degrees of freedom.

Smoothed plot of the percentage deviation from predicted SDNN (based on the model with all other covariates) versus PM2.5 concentrations in Boston. The association flattens out at high concentrations where the correlation between PM2.5 and black carbon disappears.
For all relationships except that between SDNN and black carbon the strongest associations are with the mean of the preceding 24 hours of pollution. In that case, the association with the current hour’s exposure was slightly stronger, although not much different from the effect of 24 hour exposure. The most consistent association is therefore seen with the 24 hour exposures.
Other pollutants
Table 4 shows the associations of gaseous air pollutants with HRV. As noted above, a weak association of immediate ozone exposure and r-MSSD was seen, although no associations with other measures of HRV were apparent. This pattern was similar to the pattern for non-traffic secondary particles. No evidence was seen for an association between SO2, NO2, and any of the outcomes. CO, in contrast, showed an association, but only with the 24 hour average. The pattern of association was similar to black carbon; there were associations with SDNN and the LFHFR as well as with r-MSSD and PNN50.
Percentage change in heart rate variability associated with an interquartile range change in gaseous pollution exposure
Interactions and heterogeneity
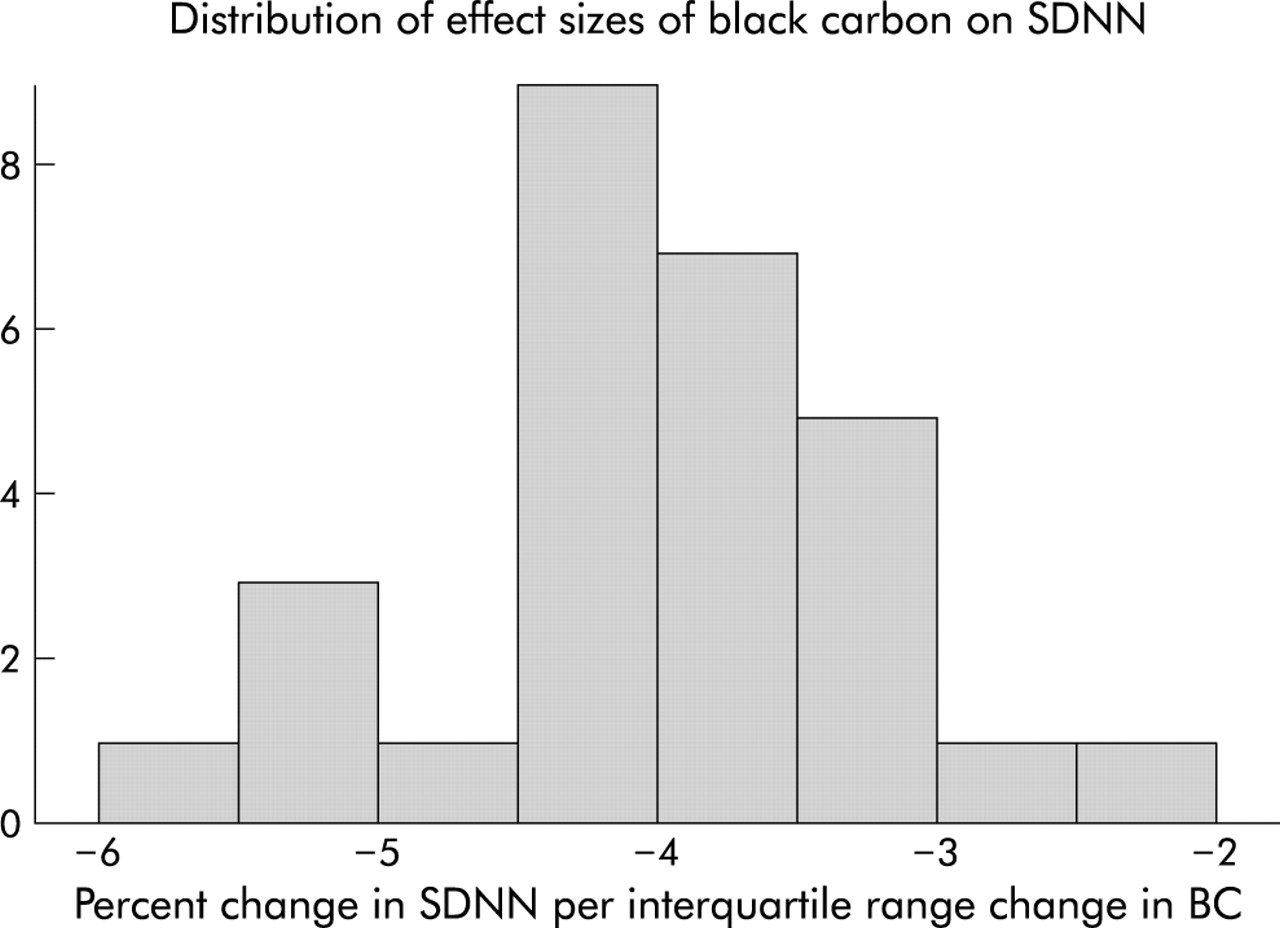
For simplicity, we only examined interactions for black carbon, which showed the strongest and most consistent pattern of association. We began by fitting random effects models with random slopes for each subject. The estimated overall effect of black carbon was little changed from the fixed effects models (percentage change for an IQR increase in black carbon −4.0% (95% CI −1.2 to −6.7)). There was evidence of heterogeneity in the effect of black carbon. Figure 4 shows the distribution of the random subject specific effect size estimates relating black carbon to SDNN. While all of the subject specific effects were negative, they had a considerable range and some evidence of skewness in the distribution. This was examined more formally using interaction terms for the subject characteristics thought to be potential effect modifiers. We found that a previous MI was associated with a greater decrement in SDNN for an IQR increase in black carbon exposure. For subjects without a MI, an IQR increase in black carbon was associated with a 3.5% decrease in SDNN (95% CI 0.7 to 6.3). For subjects with a prior MI, the effect size was almost four times as great (12.7% decrease, 95% CI 5.7 to 19.25). The other subject characteristics examined (COPD, heart failure, high blood pressure, use of β blockers) did not seem to modify the effect of black carbon.

Histogram of the subject specific covariate adjusted effect sizes relating black carbon to SDNN in Boston. All of the slopes are negative, but they vary in magnitude by a factor of 3.
Two pollutant models
Having found HRV associations with both particles and CO, we examined black carbon and CO in two pollutant models. Black carbon (but not CO) remained significant for two of the HRV measures (SDNN and LFHFR) and neither pollutant remained significant for the other two measures (table 5).
Two pollutant models with black carbon (BC) and carbon monoxide (CO) showing percentage change (95% CI) for interquartile range changes in each pollutant
DISCUSSION
Increased particle levels were found to be related to reduced HRV. Moreover, a surrogate for traffic particle exposure (black carbon) had the largest effect on reduced HRV, with secondary particles (primarily sulfates) associated with lower and different effects. The secondary particles were marginally associated with changes in r-MSSD, with effects sizes similar in magnitude to those of black carbon. However, no effect was seen on SDNN or on the LFHFR. The carbonaceous particles, in contrast, increased the LFHFR, suggesting an increase in sympathetic compared with parasympathetic tone. The relation of HRV to cardiac mortality is thought to work through sympathetic predominance and/or diminished parasympathetic tone.
The poorer association of PM2.5 with SDNN suggests that the separation between high BC days and high PM2.5 days in fig 1 is responsible. The high BC days on average had lower wind speed, ozone, and temperature, but higher CO concentrations than the high PM2.5 days. These are all conditions that would be expected to result in lower concentrations of transported photochemical particles.
Laden and co-workers, in a study of six US cities, found that traffic particles (identified in a source apportionment model using elemental composition) were more strongly associated with cardiovascular deaths than particles from coal burning.18 Janssen and colleagues recently reported that the magnitude of the effect of 10 μg/m3 PM10 on hospital admissions for heart disease varied with the proportion of the particles from traffic.19 Our study and others support the conclusion that the effects of primary traffic particles on HRV may be larger and more significant than the effects of sulfates and other secondary particles.
On the other hand, given the considerably larger degree of measurement error in the estimated secondary particle term, the finding of an association with HRV is noteworthy. While this may reflect the correlation between secondary particle concentrations and ozone, ambient concentrations of sulfates have a much stronger association with personal exposure to sulfates than is true for ambient and personal ozone, suggesting that a real effect of secondary particles is plausible. The greater measurement error may have affected the associations with different outcomes differently (e.g. LFHFR v r-MSSD), raising some caution in conclusions about different mechanisms. Further work with better measures of secondary particles will be necessary to confirm this.
The random slope model is a key feature of this study. It shows that the negative effects of traffic particles are not restricted to a few subjects. Rather, the slope of the association is negative for all participants. It also indicates that there is variation among subjects in those slopes, suggesting that important factors affecting susceptibility remain to be identified. The identification of subjects with MI as being at differential risk from air pollution suggests that ischaemic heart disease is an important predisposing condition for the effect of traffic particles on HRV. This finding, while statistically significant, rests on the difference between three subjects with prior MI and the other 25 subjects, and therefore must be treated with caution. We have previously found that prior diagnosis of conduction disorders or dysrhythmias increased the risk of particle associated hospital admissions for cardiovascular disease.20 It is possible that local traffic exposure may increase the risk of cardiac hospital admissions through altering cardiac autonomic function, as reflected in reduced HRV.
Several studies have now shown that increased ambient particle levels predict reduced HRV.11,12,14,21 Between-person reduced HRV as a subject characteristic is a known predictor of poor cardiac outcomes and sudden death.22,23 However, a recent study of ischaemic events showed that they were preceded by decreases in high frequency HRV in the hour before the event and in low frequency HRV in the 4 minutes before the event.24 Similarly, a significant decrease in HRV has been reported to precede paroxysmal atrial fibrillation.25 Hence, short term changes in HRV are of interest.
A limitation of the study is the use of a single nearby ambient monitoring station to measure air pollution instead of individual level exposures. Many studies have shown that longitudinal changes in outdoor concentrations of PM2.5 are good predictors of longitudinal changes in personal exposure to PM2.5 of outdoor origin.26–29 This is not the case for some of the gaseous air pollutants. In a Baltimore study of elderly subjects similar to ours, Sarnat et al30 confirmed that outdoor PM2.5 was a good surrogate for exposure to PM2.5, but found poor associations between temporal fluctuations in outdoor concentrations of SO2, ozone, or NO2 and personal exposure to those pollutants. The outdoor concentrations of all three gases were better correlated with personal exposure to PM2.5. Ozone was a better surrogate for exposure to sulfate particles. A more recent analysis of a Boston panel of elderly subjects found similar results.28 These results are not surprising. SO2 and ozone are very reactive gases, and their reactivity makes indoor concentrations much lower than outdoor concentrations. The temporal variability in exposure can therefore be dominated by temporal variability in how much time is spent outdoors. Ozone is produced by similar photochemical reactions that produce sulfate particles and is also a long range transported pollutant. It is therefore highly correlated with secondary transported particles in Boston and, indeed, with personal exposure to sulfates. This may be why the pattern of ozone association with HRV in our study is so similar to the pattern seen with non-traffic particles. Given the observed relations between outdoor concentrations and exposure in Boston, ozone may represent a secondary particle effect and not a true ozone effect in this study. This does not mean that ozone does not affect autonomic function or have other cardiovascular effects, merely that studies that do not use personal exposure measurements are less able to assess that question.
This study suggests the predominant importance of traffic exposure in its influence on cardiac autonomic function. Further investigation is needed regarding the components of traffic particles that may be responsible for cardiac autonomic function and subsequent arrhythmias and acute coronary artery syndromes. The indication of an association between a noisy surrogate for sulfate particles and r-MSSD also deserves further investigation, as those particles may affect autonomic control in a different way from traffic particles.
REFERENCES
Footnotes
-
Supported in part by EPA grant # R826780-01-0 and NIH 5 P01 ES09825.
Linked Articles
- Airwaves