Article Text

Abstract
BACKGROUND Very few published studies have looked at the effects of air pollution on health in the primary care setting. As part of a large study to examine the association between air pollution and a number of health outcomes, the relationship between daily GP consultations for asthma and other lower respiratory diseases (LRD) and air pollution in London was investigated.
METHODS Time-series analysis of daily numbers of GP consultations controlling for time trends, seasonal factors, day of week cycles, influenza, weather, pollen levels, and serial correlation was performed. Consultation data were available from between 268 718 and 295 740 registered patients from 45–47 London practices contributing to the General Practice Research Database during 1992–4.
RESULTS Positive associations, weakly significant and consistent across lags, were observed between asthma consultations and nitrogen dioxide (NO2) and carbon monoxide (CO) in children and particulate matter of less than 10 μm in diameter (PM10) in adults, and between other LRD consultations and sulphur dioxide (SO2) in children. A consistently negative association with ozone in children was observed in both disease categories. The effect estimates of most pollutants were much larger when analysed separately by season, particularly in the children: percentage change in asthma consultations during the warm season (April-September) for a 10–90th percentile increase in 24 hour NO2 lagged by one day = 13.2% (95% CI 5.6 to 21.3), with CO = 11.4% (95% CI 3.3 to 20.0), and with SO2 = 9.0% (95% CI 2.2 to 16.2). In adults the only association consistent over different lag periods was with PM10 = 9.2% (3.7 to 15.1). The associations of pollution and consultations for LRD were increased mainly in the winter months: percentage change in consultations by children in winter with NO2 = 7.2% (95% CI 2.8 to 11.6), CO = 6.2% (95% CI 2.3 to 10.2), and SO2 = 5.8% (95% CI 1.6 to 10.2).
CONCLUSIONS There are associations between air pollution and daily consultations for asthma and other lower respiratory disease in London. The most significant associations were observed in children and the most important pollutants were NO2, CO, and SO2. In adults the only consistent association was with PM10.
- air pollution
- asthma
- lower respiratory disease
Statistics from Altmetric.com
There is growing evidence of a relationship between air pollution and various short term effects on health including mortality, hospital admissions, respiratory symptoms, and lung function.1-3 There is less information about the effects of air pollution on general practice consultations but, if these do exist, the public health impact could be considerable because of their large numbers. During the infamous 1952 London fog which was associated with an estimated excess of 4000 deaths, Fry reported a large increase in consultations and visits for upper and lower respiratory disorders but also noted that children with or without asthma did not seem to be affected.4 During an episode of acidic air pollution transported from continental Europe in 1985, no adverse health effects were detected using data from selected general practices in the Midlands area.5 In the UK a large network of general practices has been contributing to a database from which daily counts of consultations by age and diagnoses can be obtained. As part of a larger study in London which also analysed air pollution in relation to mortality, admissions, and accident and emergency consultations, we carried out a time-series analysis of daily general practitioner consultations in London over the period 1992–4. Our project seems unique in that no comprehensive long term time-series analysis has ever been undertaken to observe the effects of urban air pollution in the primary care setting.
Methods
GP CONSULTATION DATA
Daily counts of GP consultations for respiratory complaints between January 1992 and December 1994 were obtained from the GPRD (General Practice Research database, formerly the VAMP database). The data consists of anonymised computerised patients’ records and are available from the ONS (Office for National Statistics) who manage the GPRD on behalf of the Department of Health. Participating practices are required to record all significant morbidity with dates, all drugs prescribed with dates, an indication (diagnosis) for each prescription, and the initial indication for any repeat prescription. Practices have a 12 month period of training and data validation before acceptance onto the database. GPs are not required to record all consultations, but a validation study of 13 GPRD practices found that, on average, 95% of all known prescriptions were recorded on computer.6 Data from the GPRD have been used extensively, especially for pharmacoepidemiology.7
For the three year period analysed, 268 718–295 740 registered patients from between 45 and 47 practices in the Greater London area were contributing to the database. The GPRD records the daily numbers of people consulting (as opposed to the daily consultation rate) for either an emergency or elective complaint, and includes home visits. We obtained counts of these by diagnosis and age group for each day from 1992 to 1994. The two diagnostic groupings presented in this paper are asthma (code 493 from International Classification of Diseases, revision 9) and other lower respiratory diseases (ICD9 codes 464, 466, 476, 480–3, 485–7, 490–2, 494–6, 500, 501, 503–5, 510–5, 518, 519, 786).
Both diagnostic groups were analysed in the following age groups: children (0–14), adults (15–64), elderly (65+), and all ages combined.
AIR POLLUTION, METEOROLOGICAL AND AEROALLERGEN DATA
Air pollution measures were obtained from a number of monitoring stations across London according to availability and completeness during 1992–4 and their geographical distribution. Sulphur dioxide (SO2) and black smoke (BS) data were obtained from five sites, nitrogen dioxide (NO2) and carbon monoxide (CO) from three sites, ozone (O3) from two sites, and one site provided data on particulate matter of less than 10 μm diameter (PM10). Missing values were estimated using a regression technique to obtain average values across stations.8Further detailed information on sites and measurement methods are provided in a recent comprehensive review of UK air quality.9
Daily maximum and minimum temperature and relative humidity measures at 06.00 and 15.00 hours at Holborn, central London, were obtained from the Meteorological Office. Daily average temperature and relative humidity measures were computed as the mean of their two respective values.
Pollen data from the London site of the National Pollen Network were obtained from Dr J Emberlin of the National Pollen Research Unit at University College, Worcester. Daily maximum two hourly and 24 hour average concentrations of pollen grains per m3 were available. The pollen types considered were hazel, birch, alder, oak, nettle, grasses, plantain, lime, dock, chestnut and willow.
STATISTICAL METHODS
The statistical analysis was based upon the methods adopted by the APHEA project.10 Essentially, the long term trends, seasonality, and day of week fluctuations of the GP series were determined using a number of statistical tools. Spectral analysis was used to determine the periodicity of the seasonal patterns and the goodness of fit of the statistical model was assessed from the magnitude of the overdispersion parameter, the partial autocorrelation function, and the model deviance. Appropriate variables were constructed to account for these seasonal patterns in a regression model and their validity tested using appropriate significance tests. Temperature and humidity were also included in the model after considering various diagnostic plots. Alternative methods of modelling temperature (linear, quadratic, piece-wise, spline functions) were compared using model fit statistics. Furthermore, the daily number of consultations for influenza (also obtained from the GPRD) was a potential confounder and was included in the model to account for some of the fluctuations in the outcomes. The effect of the thunderstorm episode in June 199411 ,12 and the variation in the practice populations over the three year period were also controlled for in the model where significant. Once these potential confounding variables had been included the air pollution indicator was added to complete the statistical model. Poisson regression, allowing for overdispersion and autocorrelation,13 was used to determine the relative risk of consultation associated with an increase in the pollution measure. This was expressed as a percentage change in the mean number of consultations for 10–90th percentile increases in the pollutants. A predetermined set of daily pollution measures was tested in turn in the statistical model. For SO2, BS, CO, and PM10the 24 hour average was tested. For NO2 and O3two daily measures were used; for NO2 the 24 hour average and maximum one hour measures and for O3 the maximum eight hour running average and maximum one hour measure. Pollutant levels on the current day, previous day, two and three days prior to the day of consultation (described as lag 0, lag 1, etc.) as well as cumulative measures calculated as the mean value of lags 0 and 1, lags 0–2, and lags 0–3 were each tested in the model. Where a pattern of increasing associations with increasing number of days used in the cumulative measures was detected, lags of more than three days were also investigated. The pollen variables were added to the core model and tested for significance in much the same way as the pollutants.
Due to the large number of pollutants and lags tested, emphasis is placed on the consistency of associations across lags, measures, and age groups and only the more highly significant findings (p<0.01) are discussed. The process of model building and pollutant testing was repeated for each outcome measure and age group (eight time-series in all). Possible differences between seasons in associations between pollutants and outcomes were investigated using a dummy variable to indicate the season (warm season defined as April to September). Where a significant association in the single pollutant models was found, bubble plots of model residuals against pollutant were investigated to identify the nature of the relationship.14 Where appropriate, models with two pollutant measures were also examined to try and determine whether one pollutant was more important than another. All statistical analyses were carried out using the SAS program.15
Results
DESCRIPTIVE DATA
During the three year period analysed the mean (SD) number of patients consulting each day for asthma were 14.0 (9.8), 17.8 (11.8), and 3.6 (3.0) in the young, adult, and elderly groups, respectively, and there were 39.7 (29.2), 73.8 (51.1), and 41.4 (27.4) patients consulting for other lower respiratory diseases (LRD). Table 1 shows, by season, the mean, SD and 10th and 90th percentiles of the air pollution and meteorological variables and the daily number of consultations by diagnoses and age group. The mean number of LRD consultations was found to be greater in the cool months and O3 levels were much higher in the warm period. Table 2gives the Pearson correlation coefficients between the air pollution and meteorological variables. The correlation coefficients between NO2, SO2, BS, CO, and PM10 were generally high and positive. This applies to both warm and cool seasons as well as to the whole year. O3 was negatively correlated with the other pollutants, particularly in the cool season.
Summary statistics by season for each diagnostic group (daily numbers of people consulting) and for air pollution and meteorological variables
Pearson correlation coefficients for pollutants and meteorological variables for all year, warm and cool seasons between January 1992 and December 1994
REGRESSION ANALYSES
Asthma
Table 3 summarises the results of the single pollutant analysis for asthma in each age group separately for up to three day lags. The percentage change in risk and 95% confidence interval associated with a 10–90th percentile increase in the pollutant measure is reported together with the p value. The most significant association from the single and cumulative pollutant measures investigated, whether positive or negative, is quoted. Results of the NO2 and O3 one hour measures did not differ greatly from the other NO2 and O3 measures and so have been excluded from the table. With the exception of O3, all pollutants were associated with an increase in the number of asthma consultations arising from a 10–90th percentile change in each pollutant; however, in the all ages group only SO2 approached statistical significance with percentage increases in the region of about 4%. Positive associations of borderline significance but consistent over different lags were observed with NO2 and CO in the children and there were somewhat stronger associations with PM10 in the adults. Looking at lags of more than three days did not reveal larger effect estimates. Pollen counts were not significantly associated with consultations for either asthma or LRD.
Summary of results for single pollutant analysis of consultations for asthma. Percentage change in number of consultations for a 10–90th percentile change in each pollutant presented at its most significant single/cumulative lag
Lower respiratory disease (excluding asthma)
Table 4 summarises the results of the single pollutant analysis for LRD (excluding asthma) in each age group up to three day lags. In the all ages group there were consistent negative associations with O3 measures across lags. Also, there were positive associations with SO2 and PM10, although these were not statistically significant at the 1% level. The children seemed to be the most sensitive age group with consistently increased percentage changes associated with SO2 in particular and, as with asthma, negative associations with O3. NO2, SO2, BS and CO were all associated with an increase in consultation numbers using two day lags (p<0.01 for each pollutant). With the exception of PM10 being consistently but weakly associated with an increase in consultations in the 15–64 age group, consultations for LRD excluding asthma in the adults and the elderly seemed largely independent of pollution levels. Once again the associations with increasing lag periods were examined and did not show appreciable effect sizes beyond three days.
Summary of results for single pollutant analysis of consultations for LRD (excluding asthma). Percentage change in number of consultations for a 10–90th percentile change in each pollutant presented at its most significant single/cumulative lag
SEASONAL AND TWO POLLUTANT ANALYSIS
Table 5 shows results for the analysis by season using single day lags in children, adults, and the elderly. With asthma, statistically significant seasonal differences (p = 0.01) were observed for NO2 in the children and BS and PM10 in the elderly. Figure 1 gives a graphical representation of the seasonal results with the most significant single day pollutant measures. This shows that the increase in the number of patients consulting with asthma associated with air pollution occurs largely in the summer months. For adults, O3 was positively associated with consultations in the summer months and negatively so in the winter months. Figure 2 displays the results for the seasonal analysis of LRD (excluding asthma) consultations. This reveals no statistically significant seasonal differences but does show an opposing pattern to that observed with asthma, with the largest and most significant increases generally occurring in the cool months (October–March) of each year. The exception to this was O3 which remained negatively associated with consultation numbers, particularly in children. This negative association with O3 for both asthma and LRD consultations remained when other pollutants were adjusted for in two pollutant analyses (selected results in table 6). Unsurprisingly, pollutants that are highly intercorrelated showed weakened associations when a second pollutant was included in the analysis.
Results for analysis by season of lagged single day measurements. Percentage change in number of consultations for a 10–90th centile change in each pollutant presented at its most significant single lag for all-year, warm, and cool seasons
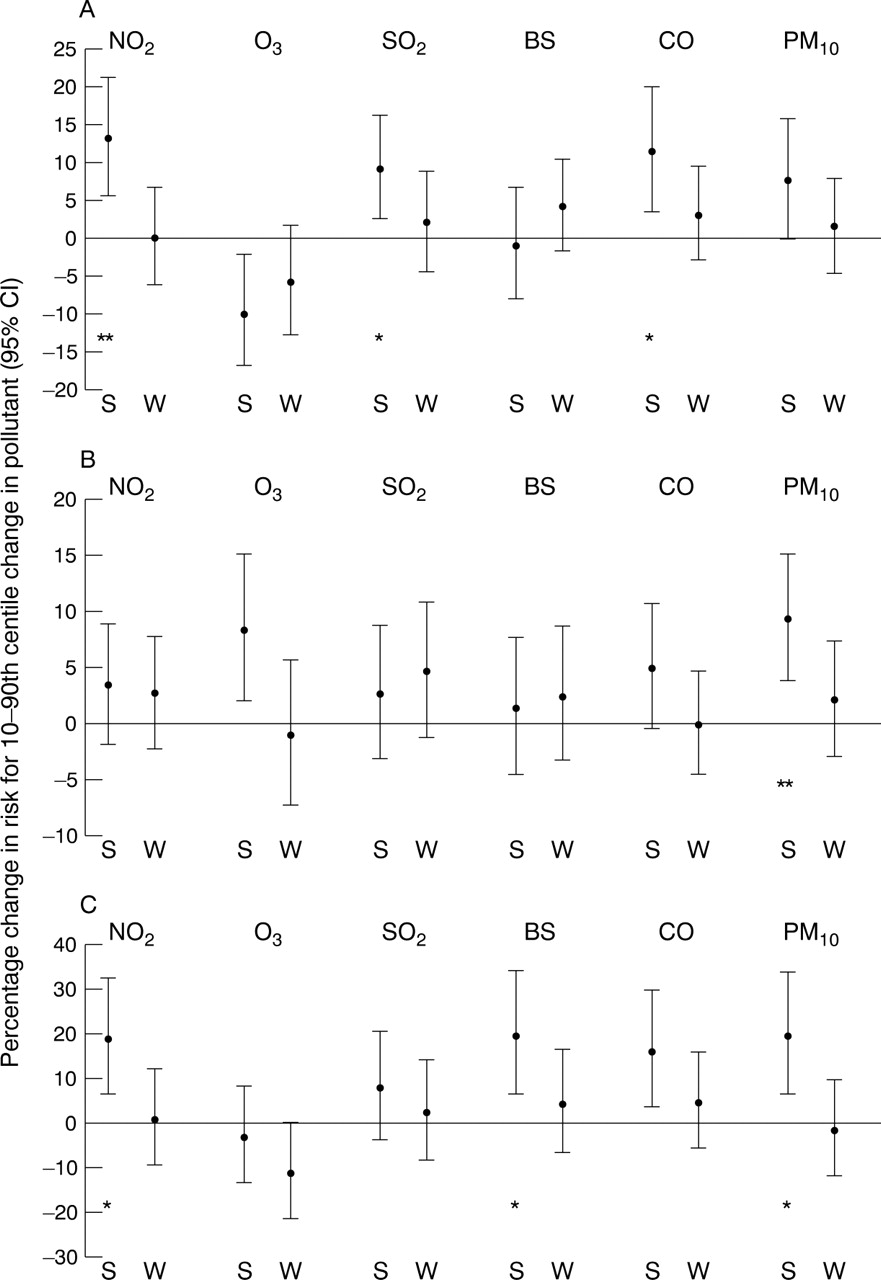
Graphical representation of seasonal analysis of asthma consultations with most significant single day pollutant measures in (A) children, (B) adults, and (C) elderly subjects (all confidence intervals displayed are 95% intervals). S = summer months; W = winter months. *p<0.01; **p<0.001.
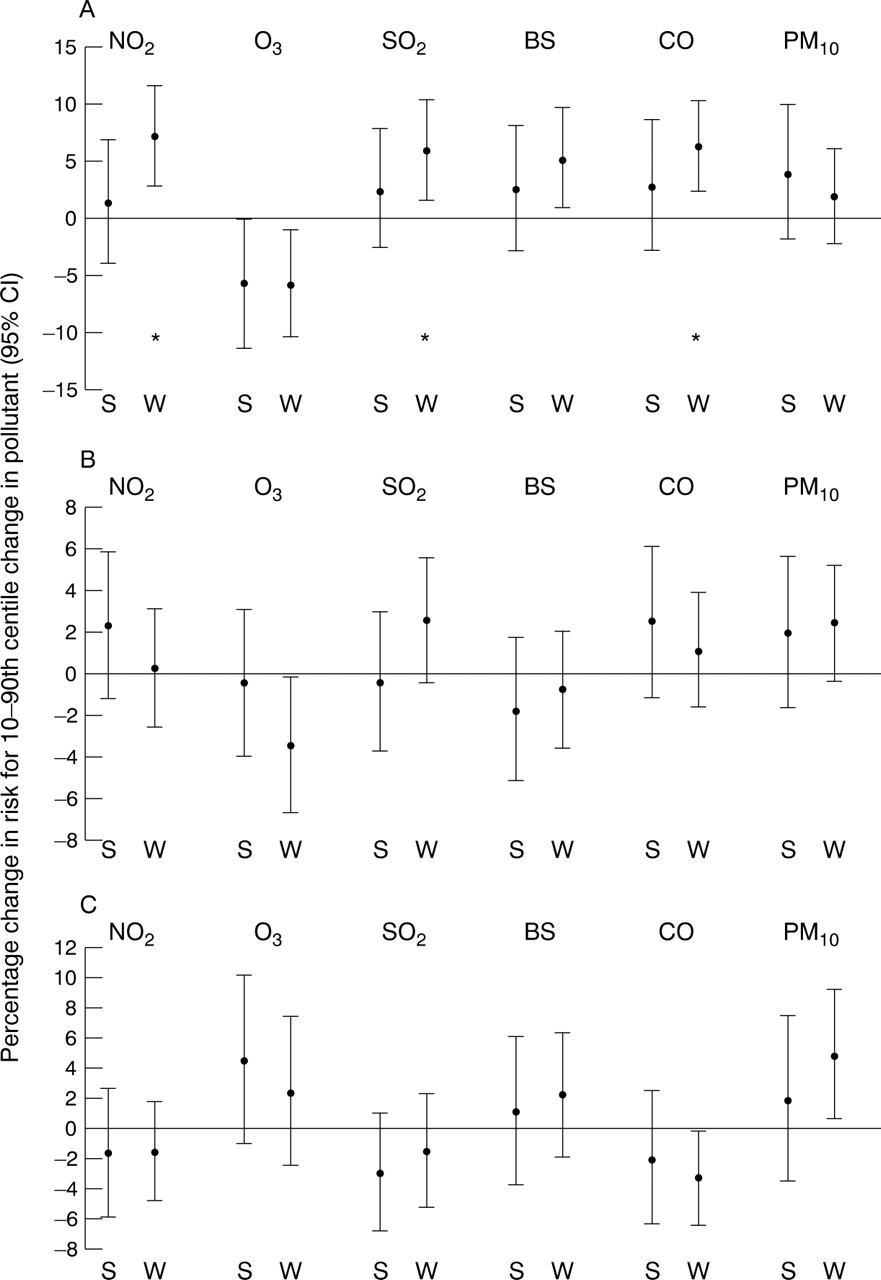
Graphical representation of seasonal analysis of LRD (excluding asthma) consultations with most significant single day pollutant measures in (A) children, (B) adults, and (C) elderly subjects (all confidence intervals displayed are 95% intervals). S = summer months; W = winter months. * p<0.01.
Two pollutant analysis in children. The diagonal elements give the single pollutant model results (the most significant single day lag is used) and the off-diagonal elements the results for the “row pollutant” when adjusted for the “column pollutant”
DOSE-RESPONSE RELATIONSHIP
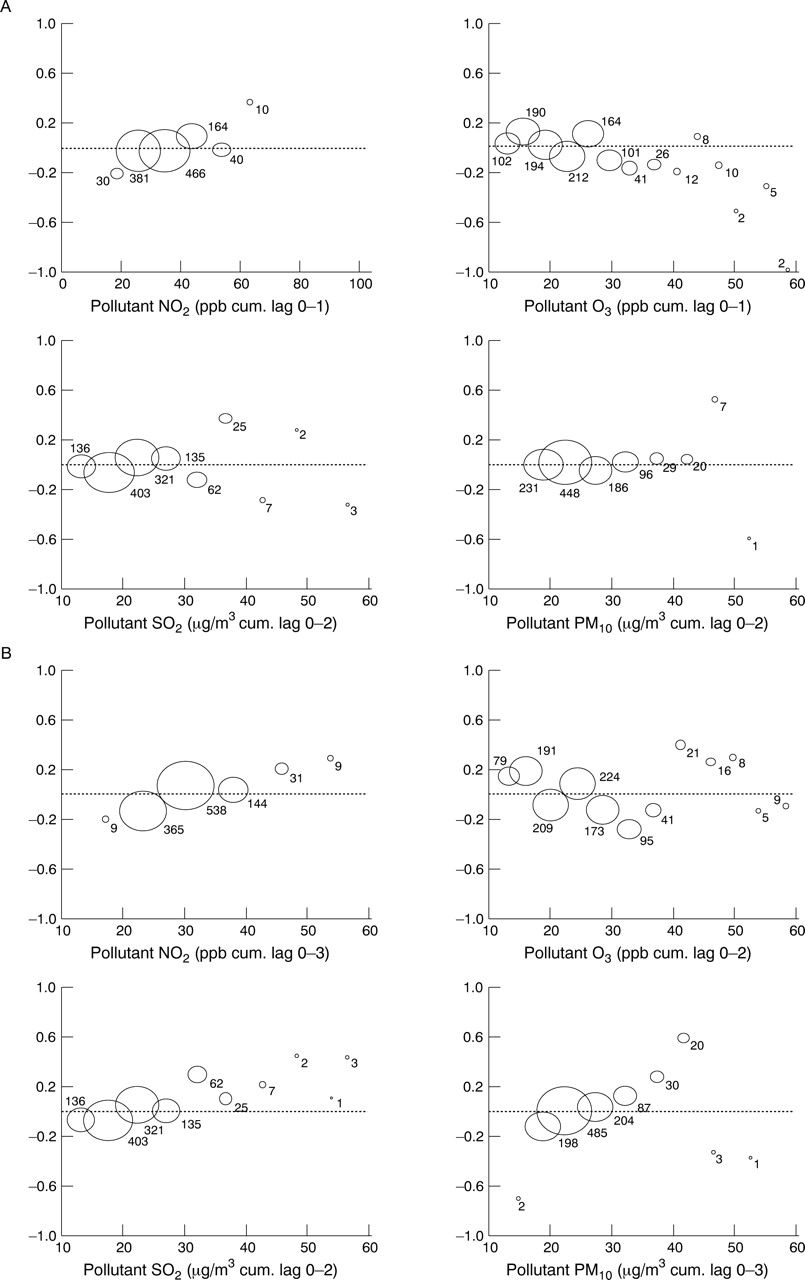
The bubble plots for the asthma model in children (fig 3) show very little pattern with pollutants, except in the case of O3 where there is a distinct negative trend in the model residuals with increase in O3, and with NO2where there is a weak positive trend. The bubble plots for the LRD model in children show a consistent exposure-response relationship in the model residuals with increases in NO2 and SO2 and also, with the exception of a few outliers, with PM10. The increase in residual size continues with increase in pollutant, with no suggestion of a threshold value. Seasonal plots (not shown) did not differ greatly from the all-year plots.

Relation between GP consultations in children for (A) asthma and (B) lower respiratory disease and cumulative measures of pollutants with adjustment for all confounders including temperature. The y axis represents the size of the model residuals. The position of the bubble in relation to the x axis corresponds to the mean for that range, and the size of the bubble is proportional to the number of days in each range.
Discussion
In evaluating the results of this study, emphasis has been placed on results which are consistent in terms of direction, magnitude, and statistical significance across the various measures and lags (single and cumulative) of each pollutant tested. In this way we have tried to avoid placing too much importance on isolated significant associations amongst a large number of statistical tests.
In studies of this type a key issue is the appropriate control for confounding variables. The statistical models were constructed following a standardised and accepted methodology10 and then checked to ensure that the model fit was satisfactory. Particular attention was paid to the modelling of temperature since this would appear to be one of the most obvious confounding variables in a model of GP consultations for respiratory disease.
Our results showed that weak but consistent all-year associations exist between certain pollutants and consultations for asthma and other lower respiratory diagnoses, especially in children. Furthermore, the magnitude of associations was much increased when analysed separately by season. In particular, this seemed to be the case for asthma with NO2, CO (probably a surrogate for other pollutants or mixtures) and SO2 in children and PM10 in adults during the warm season, and for other lower respiratory diseases with SO2 in children in the winter months. There are several possible explanations for these seasonal differences—for example, asthmatic patients may tend to use steroid inhalers more in winter months because of exacerbation of asthma caused by viral infections and this could reduce the adverse effects of air pollution. Another explanation is that there may be different pollution mixtures between seasons. The possibility that the seasonal effect may have been caused by interaction with climate was refuted by adequate control for temperature and humidity in the core models. The seasonal differences seemed to occur mostly in the children and elderly patients. This could be due in part to the possibility that asthma sufferers in these age groups are more likely to remain indoors in the winter months while adult asthma sufferers, especially those working, would be unlikely to change their daily routine from season to season. The seasonal analysis of LRD (excluding asthma) revealed an opposing pattern to that observed with asthma, with all significant associations occurring in the cool months. The seasonal differences in this diagnostic group could be due to the much higher number of consultations for these types of diseases in the winter months, leading to greater statistical power. However, power should not affect the size of the percentage change estimates which, for most pollutants, are higher in the cool period. Daily measures for SO2 and PM10, the two pollutants which seem to have the strongest effects on LRD consultations, did not vary greatly by season in the three year period analysed. Another possible explanation for the converse seasonal differences observed in patients with asthma and those with other LRD consultations could be that a seasonal diagnostic shift occurs, especially in children, with GPs perhaps being more likely to diagnose a cough as asthma in summer but as bronchitis in colder months. It has been found that wheeze is likely to be labelled asthma when clinical history suggests an allergic aetiology (a “summer disease”).16
The negative association of O3 with asthma and LRD consultations in children needs to be regarded with caution since the only statistically significant association is on the actual day of consultation. Also, the seemingly protective effect is observed in both warm and cool months in children, whereas in adults and elderly patients the negative association with asthma consultations is mainly in the cool months even though O3 levels are at their highest in the warm months. Furthermore, there is no experimental evidence to suggest that O3 has a protective effect. One explanation of the negative associations is that O3 is highly negatively correlated with most other pollutants in the cool months (table 2); thus, days when O3 levels are relatively high could be an indicator of low levels of other pollutants. However, if this was occurring then the negative association with O3should have disappeared in the two pollutant analyses unless O3 exposure is measured more accurately than other pollutants or is negatively correlated with an unmeasured pollutant such as PM2.5. As O3 is highly positively correlated with temperature, we performed a sensitivity analysis on the O3 results using different lags and measures of temperature and humidity, including daily minimum and maximum temperature, and also with all meteorological terms taken out. This revealed no appreciable changes to the effect estimates of O3.
For consultations for other LRD the bubble plots for NO2, SO2 and PM10 suggested a dose-response relationship and, furthermore, NO2, SO2, BS and CO were all statistically significantly associated with an increase in consultations at two day lags in children. This lag relationship suggests that there may be an optimum time of two days for any detrimental effect of pollution on LRD in children to manifest itself and present to the GP. Bhopal et al found an association between the daily GP consultation rate for respiratory conditions and SO2 levels in areas around a coking works; however, this was on the same day.17
The results in this paper are likely to be underestimates for the following reasons: no distinction could be made between acute or follow up consultations; the use of monitoring sites for pollution levels does not allow for measurement of individual exposure; and the LRD group is a very heterogeneous disease group which could dilute effect estimates (in children the majority of LRD consultations are known to be for bronchitis18). Despite these limitations, the findings are consistent with the acute effects of air pollution on other health outcomes (a future report will combine results of all health outcomes in the study) and show that primary care is a feasible source of data for showing effects of air pollution on health.
Acknowledgments
This project was funded by the Department of Health (JR 121/6267). The collaboration group comprised HR Anderson, RW Atkinson, MJ Bland, JS Bower, J Emberlin, A Haines, AJ McMichael and DP Strachan. We acknowledge Antonio Ponce de Leon for statistical advice.