Article Text

Abstract
Objectives The association between obesity and prognosis in patients with coronary artery disease (CAD) remains uncertain. We undertook a meta-analysis for the effects of body mass index (BMI) on mortality and cardiovascular events in these patients.
Methods We identified studies that provided risk estimates for mortality or cardiovascular events on the basis of BMI in patients with CAD. Summary estimates of relative risks were obtained for five BMI groups: underweight, normal-weight, overweight, obese and grade II/III obese. Mortality was analysed separately as short-term (<6 months) and long-term (≥6 months).
Results Data from 89 studies with 1 300 794 patients were included. Mean follow-up of long-term estimates was 3.2 years. Using normal-weight as the reference, underweight was associated with higher risk of short-term mortality (2.24 (1.85 to 2.72)) and long-term mortality (1.70 (1.56 to 1.86)), overweight and obesity were both associated with lower risk of short-term mortality (0.69 (0.64 to 0.75); 0.68 (0.61 to 0.75)) and long-term mortality (0.78 (0.74 to 0.82); 0.79 (0.73 to 0.85)), but the long-term benefit of obesity disappeared after 5 years of follow-up (0.99 (0.91 to 1.08)). Grade II/III obesity was associated with lower risk of mortality in the short term (0.76 (0.62 to 0.91)) but higher risk after 5 years of follow-up (1.25 (1.14 to 1.38)). The similar J-shaped pattern was also seen for cardiovascular mortality and across different treatment strategies. Meta-regression found an attenuation of the inverse association between BMI and risk of mortality over longer follow-up.
Conclusions Our data support a J-shaped relationship between mortality and BMI in patients with CAD. The limitation of current literature warrants better design of future studies.
Statistics from Altmetric.com
Obesity is a growing health concern throughout the world. Recent estimates for the prevalence of obesity among the general adult population are 36% in USA,1 24% in Canada2 and 32% in China.3 The adverse clinical consequences of obesity for the general population have been well documented, including hypertension, stroke, myocardial infarction (MI) and cardiovascular mortality.4–6 However, for patients with established coronary artery disease (CAD), the association of obesity with mortality is still controversial. Although better survival of obese individuals, the so called ‘obesity paradox’, has been demonstrated by multiple studies,7 ,8 the inverse correlation between obesity and mortality has not been verified by many other authors.9 ,10 Heterogeneity of patient population, inconsistent follow-up time, and the use of a wide variety of obesity measurements are all considered to contribute to the controversy among these studies.
Since body mass index (BMI calculated as weight in kilograms divided by height in metres squared) is the most readily measured parameter in clinical practice, the obesity paradox has been most commonly demonstrated when defining obesity by BMI. Multiple large cohort studies that have been recently published did not demonstrate a significant relationship between BMI and mortality.9–11 Due to the growing prevalence of obesity and ongoing controversy on this issue, we sought to define a more accurate estimate of the relationship between BMI and prognosis to guide decision-making in clinical practice. Therefore, we conducted a systematic review and meta-analysis to estimate the effect of being either overweight or obese on the risk of all-cause mortality and cardiovascular events over time among patients with established CAD.
Methods
Data sources, search strategy and selection criteria
We performed a systematic review of the literature according to the guidelines of the Meta-analysis of Observational Studies in Epidemiology for the conduct of meta-analyses of observational studies.12 Studies were considered eligible for this review if they provided the relationship between BMI categories and relevant clinical outcomes in patients with CAD. We included studies which used the WHO's BMI classification,4 underweight as BMI <18.5, normal-weight as ≥18.5 to <25, overweight as ≥25 to <30, obesity grade I as ≥30 to <35 and obesity grade II/III as ≥35. We also included studies that used broader reference BMI categories (eg, <25 or ≥16 to <25), and we performed subgroup analyses for these studies. CAD was defined as a history of percutaneous coronary intervention (PCI), coronary artery bypass grafting (CABG), MI, or angina diagnosed by invasive or non-invasive methods. We excluded studies in which the presence of CAD was not well defined or included patients with other types of cardiovascular diseases.
A search was carefully conducted for published reports in OVID/MEDLINE, EMBASE and the Cochrane library databases from 1980 to April 2014 with no language restrictions, and then Web of Science databases was searched. The search terms and their synonyms related to body weight, CAD, and relevant clinical end points were combined with terms related to our study design (see Protocol). Reference lists from these identified reports and reviews were manually screened to identify any other relevant studies. The decision to include or exclude studies was hierarchical, initially based on the study title, followed by the abstract and finally the complete text. The literature search, data extraction and quality assessment were undertaken independently by two investigators (ZJW and FG) with a standardised approach. Disagreement was resolved by discussion and consulting a third investigator (YJZ).
Data extraction, quality assessment and outcome estimation
We used the Newcastle-Ottawa scale to assess the risk of bias in individual studies.13 This scale rates studies based on eight criteria in three sources of bias. We made a modification by removing the criterion of ‘demonstration that outcome of interest was not present at start of study’. The final included key criteria are shown in online supplementary eTable 2.
The primary outcome of interest was all-cause mortality. The secondary outcome was cardiovascular events, including cardiovascular mortality and MI. If the required data could not be located in the published reports, the authors of the individual reports were asked to provide the missing data of interest.
Statistical analysis
Risk estimates (risk ratios, HRs, and ORs) and raw outcome data were abstracted from individual studies. Random-effects (DerSimonian and Laird) and fixed-effects (inverse-variance weighted) models were calculated.14 The percentage of variability across studies attributable to heterogeneity beyond chance was estimated with the I2 statistic.15 The estimates for short-term events (follow-up <6 months) and long-term events (follow-up ≥6 months) were analysed separately. The influence of individual studies was examined by excluding one study at a time. Given the heterogeneity of the data adjustment across individual studies, separate analyses for studies using adjusted estimates and unadjusted estimates were assessed. Additional sensitivity analyses were performed by confining analyses within prespecified subgroups. For long-term estimates, separate analyses confined to studies with follow-up extending to ≥3 years and ≥5 years were further assessed. Univariate meta-regressions were performed and included regressions of the log-relative risk (RR) on the total number of patients, total number of mortality events, percentage of patients with diabetes, mean age, treatment strategies (PCI, CABG, medication or unspecified) and follow-up period. Potential publication bias was assessed with funnel plots and the Begg test.16 Analyses were performed using Stata V.11.0 (Stata Corp, College Station, Texas, USA). Statistical level of significance for the summary treatment effect estimate was a two tailed p<0.05.
Results
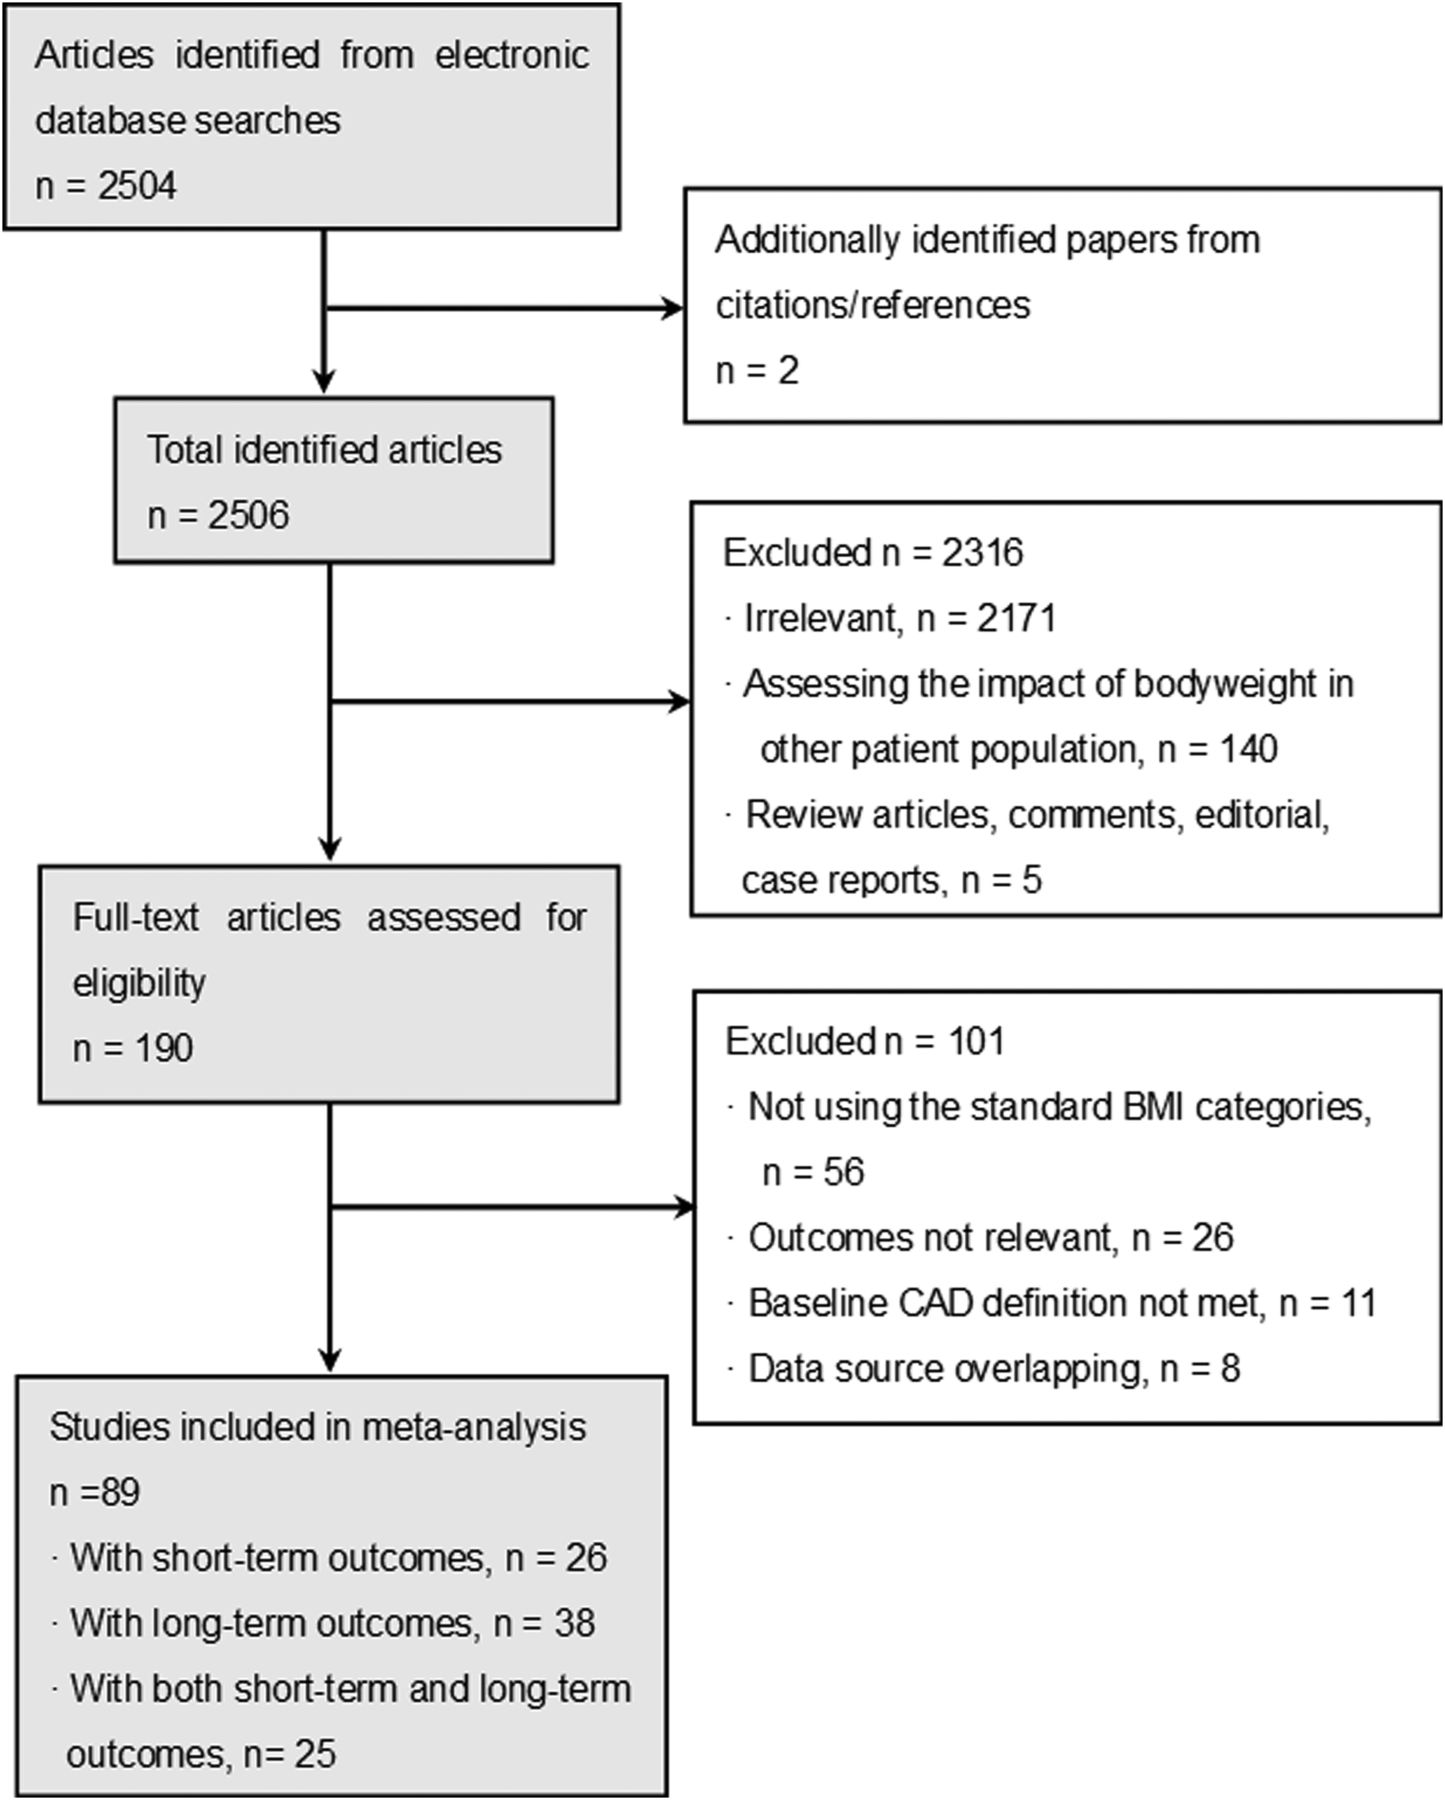
From 2506 potentially relevant citations identified from electronic databases and search of reference lists, 89 studies finally met the inclusion criteria for the analysis, including 63 studies with a total of 602 668 patients assessed at long-term follow-up, and 51 studies with a total of 907 770 assessed at short-term follow-up. Overall, there were a total of 1 300 794 patients with CAD included in our meta-analysis (figure 1).

Selection process of relevant studies for inclusion in the meta-analysis. BMI, body mass index; CAD, coronary artery disease.
The distribution of conventional risk factors differed among weight groups. Patients with high BMI were more likely to be younger in all the studies. Most studies showed higher prevalence of dyslipidaemia, diabetes mellitus and hypertension in patients at high BMI categories. The baseline characteristics and quality assessments are shown in online supplementary eTables 1 and 2.
BMI and short-term outcomes
Among the 51 studies with short-term estimates, 29 studies reported inhospital outcomes, 21 studies reported 30-day outcomes and 1 study reported 6-month outcomes, with the study sample sizes ranging from 164 patients to 301 477 patients.
Data on all-cause mortality was obtained from 46 studies which included 890 526 patients. Compared with normal-weight, overweight (random: RR 0.69, 95% CI 0.64 to 0.75; fixed: RR 0.69, 95% 0.66 to 0.71) and obese patients (random: RR 0.68, 95% CI 0.61 to 0.75; fixed: RR 0.62, 95% CI 0.60 to 0.65) had lower risk of mortality (see online supplementary eFigures 1 and 2). After grouping all BMI categories together, we found a J-shaped relationship between BMI categories and the risk of mortality (figure 2A). The underweight patients had the highest risk of mortality (random: RR 2.24, 95% CI 1.85 to 2.72; fixed: RR 2.34, 95% CI 2.21 to 2.48), while the grade I obese patients had the lowest mortality risk. Patients with grade II/III obesity had a lower risk of death compared with patients of normal-weight (random: RR 0.76, 95% CI 0.62 to 0.91; fixed: RR 0.78, 95% CI 0.74 to 0.82) (see online supplementary eFigure 3). Separate analyses showed that the J-shaped pattern was consistent across adjusted and unadjusted estimates and across different types of treatment strategies (figure 2B–F).
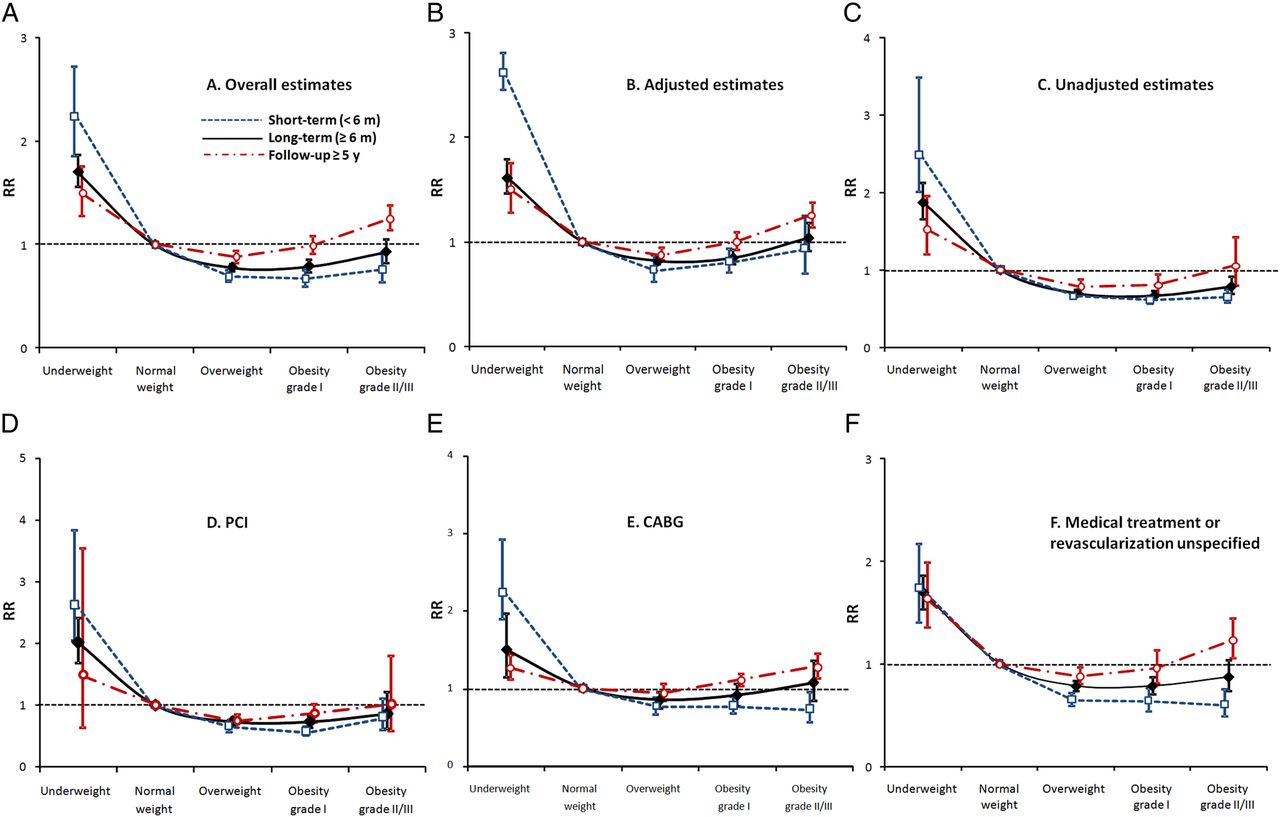
RRs of all-cause mortality by BMI categories from all estimates (A), adjusted estimates (B), unadjusted estimates (C), estimates from patients receiving PCI (D), CABG (E) and medication treatment or revascularisation unspecified patients with CAD (F). Separate analyses were performed among studies with short-term estimates (<6 months, blue dotted line), long-term estimates (≥6 months, black solid line) and studies with follow-up ≥5 years (red dashed line). The Y-axis represents the RRs of all-cause mortality for BMI categories using normal weight group as the reference by random effects. BMI, body mass index; CABG, coronary artery bypass grafting; CAD, coronary artery disease; PCI, percutaneous coronary intervention; RR, relative risk.
There was significant heterogeneity demonstrated for all of the comparisons performed. However, the survival benefit of being overweight or obese as compared with being normal-weight was consistent among all subgroups (table 1). No individual study unduly influenced the effects estimates. There was no apparent systematic bias as assessed by funnel plots for all comparisons performed (see online supplementary eFigure 4).
Separate analyses of short-term (<6 months) all-cause mortality in subgroup studies
The risk of short-term cardiovascular mortality also demonstrated a J-shaped curve. Compared with normal-weight, being underweight was associated with a higher risk of cardiovascular morality, while being overweight, or having grade I or grade II/III obesity was associated with progressively lower risk of cardiovascular morality (random: RR 0.66, 95% CI 0.55 to 0.80; RR 0.64, 95% CI 0.48 to 0.86; RR 0.38, 95% CI 0.20 to 0.73; fixed: RR 0.66, 95% CI 0.55 to 0.80; RR 0.67, 95% CI 0.52 to 0.85; RR 0.38, 95% CI 0.20 to 0.73). BMI did not demonstrate a significant effect on short-term risk of MI (see online supplementary eFigure 5).
BMI and long-term outcomes
A total of 63 studies with 602 668 patients reported long-term estimates (≥6 months), with sample sizes ranging from 389 patients to 60 635 patients. The mean follow-up was 3.2 years (range from 8.2 months to 12 years) (see online supplementary eTable 1).
Data on all-cause mortality was available from 58 studies including 578 780 patients. Compared with normal-weight, overweight (random: RR 0.78; 95% CI 0.74 to 0.82; fixed: RR 0.82, 95% CI 0.80 to 0.83) and obese (random: RR 0.79; 95% CI 0.73 to 0.85; fixed: RR 0.84, 95% CI 0.82 to 0.86) patients demonstrated a reduced risk of all-cause mortality (see online supplementary eFigures 6 and 7). As seen in figure 2A, the relationship between BMI categories and the risk of long-term mortality also demonstrated a J-shaped curve. Underweight patients demonstrated the highest risk (random: RR 1.70, 95% CI 1.56 to 1.86; fixed: 1.60, 95% CI 0.53 to 0.67), and overweight and grade I obese patients demonstrated the lowest risks. Grade II/III obese patients demonstrated essentially the same risk as patients in the normal-weight group by random effects (RR 0.93, 95% CI 0.82 to 1.05) but lower risk by fixed effects (0.94, 95% CI 0.89 to 0.98) (see online supplementary eFigure 8). Separate analyses showed that the J-shaped pattern was consistent across adjusted and unadjusted estimates and across different treatment strategies (figure 2B–F).
There were also high levels of heterogeneity among all the comparisons for long-term estimates. Further separate analyses indicated that the benefit of being overweight versus normal-weight was consistent across all subgroups. However, the benefits of obesity and in particular of having grade II/III obesity were attenuated respectively when the analyses were confined to studies with follow-up 5 years or longer (random: RR 0.99; 95% CI 0.91 to 1.08 and RR 1.25; 95% CI 1.14 to 1.38; fixed: RR 1.06, 95% CI 1.02 to 1.10 and RR 1.25; 95% CI 1.14 to 1.38) (table 2). The J-shaped curve was attenuated when comparing long-term versus short-term estimates, as well as when estimates were confined to studies with follow-up of 5-years or longer (figure 2). Meta-regression also revealed follow-up time as an effect modifier as the effect of BMI on mortality changed over time with a progressively attenuated adverse effect of being underweight and an attenuated beneficial effect of being overweight or obese on outcomes at longer follow-up (figure 3). The risk decreased 3% per year of follow-up for underweight patients (RR 0.97 95% CI 0.94 to 0.99), but increased 3% per year for overweight patients (RR 1.03, 95% CI 1.01 to 1.04), 5% per year for patients with any level of obesity (RR 1.05, 95% CI 1.03 to 1.07), and 6% per year for severely obese patients (RR 1.06, 95% CI 1.02 to 1.11). There was no apparent systematic bias as assessed by funnel plots for all comparisons performed (see online supplementary eFigure 9).
Separate analyses of long-term (≥6 months) all-cause mortality in subgroup studies

Meta-regression on log relative risks of all-cause mortality per year of follow-up in underweight (A), overweight (B), obese (C) and grade II/III obese (D) patients versus normal weight patients. The size of the circles represents the individual study weights. The meta-regression was performed among all 82 studies with estimates of all-cause mortality including 1 268 499 patients, with duration of follow-up ranging from inhospital to 12 years.
The similar J-shaped pattern was also seen for long-term cardiovascular mortality, with overweight patients having the lowest risk (random: RR 0.82, 95% CI 0.74 to 0.90; fixed: RR 0.80, 95% CI 0.74 to 0.86) and underweight patients having the highest risk (random: RR 1.62, 95% CI 1.27 to 2.07; fixed: RR 1.60, 95% CI 1.29 to 2.00). BMI did not show a significant effect on the long-term risk of MI (see online supplementary eFigure 5).
Discussion
Although it has been extensively investigated, the relationship between obesity and clinical outcomes for patients with established CAD remains controversial. This meta-analysis which includes 89 studies and more than 1.3 million patients, represents the largest analysis on this subject. Our results demonstrated a J-shaped relationship between BMI and all-cause mortality among patients with CAD, which was attenuated with longer follow-up. Using normal-weight as the reference, being underweight is consistently associated with a higher risk of mortality, while being overweight is consistently associated with a lower risk of mortality. The presence of obesity was associated with a lower risk of mortality but the benefit disappears after 5 years of follow-up. Additionally, grade II/III obesity tends to be associated with a lower risk of short-term mortality but a higher risk of mortality at more than 5 years of follow-up. The similar J-shaped pattern was also seen for cardiovascular mortality, and across different types of treatment strategies.
The inverse relationship between BMI and mortality in our findings contrasts with prior individual studies that have reported no relationship between BMI and mortality,9–11 but are largely consistent with a prior meta-analysis by Romero-Corral et al.17 By summarising the data from 40 studies including 250 000 patients with at least 6-months of follow-up, Romero-Corral et al found that the adjusted RRs of all-cause mortality were 0.87 (95% CI 0.81 to 0.94) for overweight and 0.93 (95% CI 0.85 to 1.03) for obesity relative to normal-weight. While the BMI cut-off points across individual studies enrolled in Romero-Corral et al's meta-analysis demonstrated wide variability, we only included studies using standard BMI classifications. Our study also provides a much larger sample size and a broader range of follow-up, ranging from inhospital to over 12 years of follow-up. Nevertheless, our analysis demonstrated relatively similar risks of long-term mortality in overweight patients as compared with Romero-Corral et al (RR 0.82 95% CI 0.74 to 0.90), and while we examined obesity in a graded fashion in which patients with less severe obesity (grade I) and more severe obesity (grade II and III) were evaluated separately, the effect we demonstrated of grade II/III obesity on mortality was quite similar to the prior analysis as the RR was 0.93 (95% CIs 0.82 to 1.05). Therefore, while our analyses take a more nuanced approach at the effect of obesity on long-term mortality in patients with CAD, our findings are consistent with prior analyses. Although a high level of variability was found across individual studies, subgroup analyses and meta-regression suggested that the J-shaped relationship pattern we demonstrated is consistent across all study and patient subsets.
Despite the overwhelming evidences and consistent results across subgroups, we should be cautious to draw the conclusion that excess body fat is a protective factor in patients with established CAD. Like many of these individual studies, our analysis is susceptible to multiple biases and to confounding.
Possible explanations for the ‘obesity paradox’ have included earlier presentation of obese patients,18 questionable validity of BMI to adequately account for body fat19 ,20 and the inability of BMI to account for a patient's overall level of fitness.21–23 A recent study24 found that smoking status is an important effect modifier of BMI on mortality in patients with diabetes, demonstrating a linear relationship among non-smokers but a J-shaped relationship among smokers. In order to examine the influence of confounding and provide precise estimates, we performed separate analyses for adjusted estimates. The results presented herein provide little support for the suggestion that the baseline confounding factors are important causes of bias. Although the effect sizes of mortality appeared to be smaller in adjusted studies, the favourable effect of being overweight or obese versus normal-weight were consistent across unadjusted and adjusted estimates. While separate analyses did not find substantial differences between smoking-adjusted and overall estimates, indicating no significant smoking-related bias in this study, no individual study to date has performed subgroup analysis among patients who have never smoked; it is thus not possible for our study to examine the residual bias related to smoking. Additionally, treatment strategies, especially revascularisation, have been reported to be a potential source of bias.17 However, we did not find significant effect modification by treatment strategies in meta-regression and subgroup analyses performed, and sensitivity analyses did not find significant modification of effect size or reduction of variability after excluding any kind of treatment strategies.
Another important concern is reverse causation. In analyses using baseline weight as the exposure, low body weight could be a result of weight loss due to more severe illness or underlying chronic disease. In a post hoc analysis of three trials,25 significant weight loss (loss >0.1 kg/baseline BMI) within the first 3 months to 1 year after acute MI was found to be an independent predictor of mortality. Exclusion of subjects with known illness at baseline and censoring of short-term data are routine methods to reduce this bias.24 ,26 Our meta-analysis is susceptible to reverse causation because very few studies took into account body changes prior to the baseline weight at study enrolment, and almost all the studies involved patients who had a prior history of CAD, which substantially increases the susceptibility to reverse-causation bias. Additionally, the attenuated benefit of overweight and obese patients in long-term versus short-term follow-up demonstrated in this analysis may also be an indicator of reverse causation, with the assumption that short-term follow-up data is more likely to be influenced by pre-existing illness that could lead to a lower baseline body weight.
The main strength of this meta-analysis is the large sample size and number of studies included, which make our findings robust as compared with prior studies on this issue. Limitations of our meta-analysis include the fact that individual patient data were not available for these meta-analyses, and therefore the variables in the adjusted risk estimates are different across studies, which thus limit the capacity to fully explore effects in subgroups. Most contributing studies only provided baseline BMI values, so it is not possible for this meta-analysis to take into account the potential influence of weight change over time on prognosis. Risk estimates also largely varied across individual studies (risk ratios, HRs, and ORs, and raw event number). HRs can take into account time of events and hence are considered the best estimate for follow-up data. In the present analysis, we also performed separate analyses confined to HR, and found that the results are consistent with the main results (see online supplementary eFigure 10), indicating the robustness of our findings. Second, although we used a strict BMI classification as the inclusion criteria, heterogeneity was present almost among all analyses. Attempts to investigate sources of heterogeneity through various sensitivity analyses and meta-regression did not find a simple explanation or method to account for this variability. The inconsistency of follow-up duration across individual studies may partly explain the heterogeneity of long-term analyses, but a high level heterogeneity still exists within different follow-up subgroup analyses. Substantial heterogeneity has also been found in a prior meta-analysis on this issue,17 which was attributed to sufficient statistical power to detect small differences across studies due to large numbers of events and a large sample size by the authors. Finally, only BMI was evaluated in this analysis. Other modalities associated with body weight, including body composition27 ,28 and fitness,21–23 ,27 were not included due to insufficient data on these parameters.
Rather than providing new evidence regarding the ‘obesity paradox’, this study reminds us of the limitations of current literature and reinforces the importance of better designs for future studies. To interpret the true causal relationship between body weight and prognosis in patients with established CAD, multiple biases and confounders, particularly reverse causation, smoking status and fitness, should be taken into account carefully. Long-term follow-up is strongly recommended due to the susceptibility to reverse-causation bias of shorter follow-up. Prospective randomised controlled studies are needed to assess the survival benefit of purposeful weight-control programmes across different BMI categories in patients with CAD. Until more definitive persuasive evidence is available, the current results should not deter the enthusiasm of weight control through exercise and diet for patients with CAD, especially for those with excess body weight.
Key messages
What is already known on this subject?
The relationship between obesity and clinical outcomes for patients with established coronary artery disease (CAD) remains controversial. Several studies have demonstrated an inverse association between body mass index (BMI) and mortality, the so-called ‘obesity paradox’. Although BMI as an obesity measure has been questioned, it is still the most widely used body-weight measurement.
What might this study add?
In our analysis, we demonstrated a J-shaped relationship between BMI categories and risk of mortality, with being underweight carrying the highest risk, while being overweight or obese carrying the lowest risk. This inverse relationship between BMI and mortality was attenuated in long-term follow-up. The survival benefit of obesity (0.68 (0.61 to 0.75)) disappeared after 5 years of follow-up (0.99 (0.91 to 1.08)). Grade II/III obesity was associated with a lower risk of short-term mortality (0.76 (0.62 to 0.91)) but a higher risk of death after 5 years of follow-up (1.25 (1.14 to 1.38)).
How might this impact on clinical practice?
The lack of obesity as a cardiovascular risk factor in non-obese patients with CAD should not be assumed to predict a better outcome as compared with obese patients.
References
Supplementary materials
Supplementary Data
This web only file has been produced by the BMJ Publishing Group from an electronic file supplied by the author(s) and has not been edited for content.
- Data supplement 1 - Online supplement
- Data supplement 2 - Online supplement
- Data supplement 3 - Online figures
Footnotes
Contributors ZJW had full access to all of the data in the study and takes responsibility for the integrity of the data and the accuracy of the data analysis. Study concept and design: ZJW, YJZ and LM. Acquisition of data: ZJW, FG, BZG and YJZ. Analysis and interpretation of data: ZJW, YJZ, BZG, LM and RWY. Drafting of the manuscript: ZJW and BZG. Critical revision of the manuscript for important intellectual content: ZJW, YJZ and LM. Statistical analysis: ZJW, FG and BZG.
Funding The present study was supported by grants from a National Natural Science Foundation of China (Grant No. 81170265).
Competing interests None declared.
Provenance and peer review Not commissioned; externally peer reviewed.