Article Text

Abstract
Objectives Previously improving life expectancy and all-cause mortality in the UK has stalled since the early 2010s. National analyses have demonstrated changes in mortality rates for most age groups and causes of death, and with deprived populations most affected. The aims here were to establish whether similar changes have occurred across different parts of the UK (countries, cities), and to examine cause-specific trends in more detail.
Design Population-based trend analysis.
Participants/setting Whole populations of countries and selected cities of the UK.
Primary and secondary outcome measures European age-standardised mortality rates (calculated by cause of death, country, city, year (1981–2017), age group, sex and—for all countries and Scottish cities—deprivation quintiles); changes in rates between 5-year periods; summary measures of both relative (relative index of inequality) and absolute (slope index of inequality) inequalities.
Results Changes in mortality from around 2011/2013 were observed throughout the UK for all adult age groups. For example, all-age female rates decreased by approximately 4%–6% during the 1980s and 1990s, approximately 7%–9% during the 2000s, but by <1% between 2011/2013 and 2015/2017. Equivalent figures for men were 4%–7%, 8%–12% and 1%–3%, respectively. This later period saw increased mortality among the most deprived populations, something observed in all countries and cities analysed, and for most causes of death: absolute and relative inequalities therefore increased. Although similar trends were seen across all parts of the UK, particular issues apply in Scotland, for example, higher and increasing drug-related mortality (with the highest rates observed in Dundee and Glasgow).
Conclusions The study presents further evidence of changing mortality in the UK. The timing, geography and socioeconomic gradients associated with the changes appear to support suggestions that they may result, at least in part, from UK Government ‘austerity’ measures which have disproportionately affected the poorest.
- epidemiology
- public health
- social medicine
This is an open access article distributed in accordance with the Creative Commons Attribution Non Commercial (CC BY-NC 4.0) license, which permits others to distribute, remix, adapt, build upon this work non-commercially, and license their derivative works on different terms, provided the original work is properly cited, appropriate credit is given, any changes made indicated, and the use is non-commercial. See: http://creativecommons.org/licenses/by-nc/4.0/.
Statistics from Altmetric.com
Strengths and limitations of this study
We examine recent changes in mortality in the UK in the context of much longer term trends: almost 40 years in most cases.
Given the importance of urban health to national outcomes, we include the largest cities in Scotland, England (London excepted) and Northern Ireland.
We analyse data for 10 major causes of death (not just all causes combined), and by country-specific and (for Scotland) city-specific deprivation levels.
Limitations include the fact that interpretation of trends at city level can be problematic, given the fluctuation in rates.
Introduction
The recent (pre-COVID-19 pandemic) slowdown in improvement in life expectancy and mortality rates in the UK has been highlighted by researchers1 2 and media3 4 alike. Similar changing trends have been observed in many other high-income countries, although the slowdown has been particularly marked in the UK and the USA.5 Other high-income countries with higher life expectancy have seen continued improvements.2 5
Data from Scotland and England (92% of the UK population) have shown that these changing mortality patterns have been observed for almost all age groups and for most causes of death.6 7 Worryingly, increasing mortality rates among the most socioeconomically deprived populations have also been observed; as a result, inequalities in all-cause mortality have widened considerably since around 2012.7–9 An emerging body of UK1 10–13 and international14 15 work suggests the recent stalling is likely to be associated with the implementation from 2010 of UK Government ‘austerity’ measures—cuts to public services and social security—which have particularly affected the most vulnerable populations.
The principal aim of this project was to establish whether similar changing mortality trends (in terms of rates of improvement, causes of death and socioeconomic inequalities) have occurred ubiquitously across the UK. This included examining cause-specific trends in more detail, and focusing on selected individual cities, given the importance of urban health to national outcomes.16
Methods
Mortality and population data
Numbers of deaths by year of registration, age, sex, underlying cause, city and country for Scotland, England & Wales and Northern Ireland were obtained from, respectively, the National Records of Scotland (NRS), the Office for National Statistics and the Northern Ireland Statistics and Research Agency. Data were available for the following years: 1974–2017 (Scotland); 1981–2017 (England & Wales); and 1997–2017 (Northern Ireland).
Data were obtained for all-cause deaths, and for the following 10 major individual causes: respiratory disease; ischaemic heart disease (IHD); cerebrovascular disease; all malignant neoplasms; lung cancer (malignant neoplasm of trachea, bronchus and lung); intentional self-harm (including events of undetermined intent); external causes; motor vehicle traffic accidents (MVTAs); alcohol-related causes; and drug-related poisonings. Causes were defined by groups of International Classification of Diseases 8th Revision (ICD-8), ICD-9 and ICD-10 codes: these are listed in the online supplemental table 1. As stated in online supplemental table 1, the definition of external causes overlaps with other causes of death, that is, MVTAs, intentional self-harm, drug-related poisonings. ICD-9 codes were used for the years 1979–1999 in Scotland, and for 1981–2000 in England & Wales and Northern Ireland; ICD-10 codes were used for all later years. ICD-8 codes were used for 1974–1978 (Scotland only) but the data for those years are not presented here.
Supplemental material
Matching population data by year, 5-year age group, sex, city and country were obtained from the same national statistical agencies.
Geography
Scotland, England & Wales (combined) and Northern Ireland were the countries used in the main analyses. For analysis by deprivation quintiles (discussed further below), England alone, rather than England & Wales, was used. With the exception of London, the largest cities in each country were selected: Glasgow, Edinburgh, Dundee and Aberdeen in Scotland; Liverpool, Manchester, Birmingham, Leeds, Sheffield and Bristol in England; and Belfast in Northern Ireland. London was excluded as its size and ethnic diversity makes meaningful comparisons with other cities problematic.17 Scottish and English cities were defined by current local authority boundaries. Belfast was defined by its 1992 local government district boundary.
Deprivation analyses employed the separate Scottish, English and Northern Irish area-based indices of deprivation: the Scottish Index of Multiple Deprivation (SIMD),18 the (English) Index of Multiple Deprivation (IMD)19 and the Northern Ireland Multiple Deprivation Measure (NIMDM),20 respectively. In all three cases data were available for the period 2001–2017. The SIMD has been updated multiple times: thus, the 2004 version was used for analyses covering the years 2001–2004, SIMD 2006 was used for 2005–2007, SIMD 2009 for 2008–2010, SIMD 2012 for 2011–2013 and SIMD 2016 for 2014–2017. Similarly, the (English) IMD 2004 was used for the years 2001–2005, IMD 2007 for 2006–2008, IMD 2010 for 2009–2013, IMD 2015 for 2014–2016 and IMD 2019 for 2017. For Northern Ireland, NIMDM 2010 was used for all years of analyses. Although there are differences in the spatial scale and the individual variables used in the construction of each nation’s deprivation measure, all three share notable similarities in terms of their basic composition. The principal ‘data domains’ of each are effectively the same: income; employment; health; education, skills and training; crime; access to services; housing. In the Scottish index, housing is a separate category; in the English and Northern Irish indices it is instead contained within a ‘living environment’ domain. For all three measures of deprivation, similar methodologies are employed to calculate an overall index of relative deprivation, based on geographical area rankings across all data domains. Although the absolute values of the different indices cannot be directly compared, the similarity of composition and methodology associated with each provides helpful, and broadly comparable, overviews of inequality within each setting.
Statistical analyses
European age-standardised mortality rates per 100 000 population were calculated using the 2013 European Standard Population.21 Analyses were undertaken by sex, age (all ages, 0–64 years (the latter to examine premature deaths) and four broad groups across the life course: 0–14, 15–44, 45–64 and 65+ years), year, cause of death, city, country and deprivation quintile (see below). Three-year rolling average rates were derived; to quantify the rate of improvement over time, the percentage changes in rates between 3-year averages at 5-year intervals (ie, between 1981/1983 and 1985/1987, 1986/1988 and 1990/1992… up to 2011/2013 and 2015/2017) were calculated. Three-year averages were used to overcome the issue of fluctuating rates (especially at city level). For simplicity, we use the expression ‘five year’ interval to reflect the midpoints of the 3-year average (eg, 1982–1986 in relation to 1981/1983 to 1985/1987).
For the deprivation analyses, mortality rates by quintile were calculated on the basis of both national quintiles (based on levels of deprivation within individual countries) and—for Scottish cities only—city-specific quintiles (based on levels of deprivation within each individual city). City-specific quintiles are made publicly available by Information Services Division of NHS Scotland (now Public Health Scotland) for all versions of the SIMD used in the analyses, and were downloaded from their website. Equivalent data were not available for the English cities. In all analyses, quintile 1 represented the most deprived fifth of the country’s/city’s small areas, and quintile 5 the least deprived fifth. The aim was to compare quintile rates within the same location (country or city), not between different locations. Note that as the English IMD does not include Wales, for comparison all-cause mortality rates by year and sex for England alone (rather than England & Wales combined) were also calculated. Analyses by deprivation were undertaken for all-cause deaths for all geographies, and for cause-specific mortality for all Scottish areas.
To examine changes in both absolute and relative inequalities in mortality (for the countries, Scottish cities and the causes of death), the slope index of inequality (SII) and the relative index of inequality (RII) respectively were calculated, based on the above deprivation quintiles. The SII calculates the gap in mortality rates across groups (here, the five quintiles), taking into account each quintile’s rate (not just those of the least and most deprived), and each quintile’s population size. The RII expresses this as a relative measure by dividing the SII by the rate for the whole population.22
Analyses were undertaken using IBM SPSS Statistics V.25.
Patient and public involvement
Patients were not involved in this study.
Results
Figure 1 presents all-cause standardised mortality rates for all ages by country and city for (A) males and (B) females between 1981/1983 and 2015/2017. At the national level, a change in the male death trend appears visible from around 2011/2013 for both Scotland and England, with no or little improvement observed in the periods after that; there is greater fluctuation in rates in Northern Ireland. A change in rates appears more apparent, occurring slightly earlier, for deaths among females including those in Northern Ireland. At the city level, greater fluctuation in rates is clearly evident, as would be expected given the smaller population sizes and associated numbers of deaths: nonetheless, the majority of cities appear to have experienced a flattening, or worsening, of mortality rates in the last three to four time points shown.
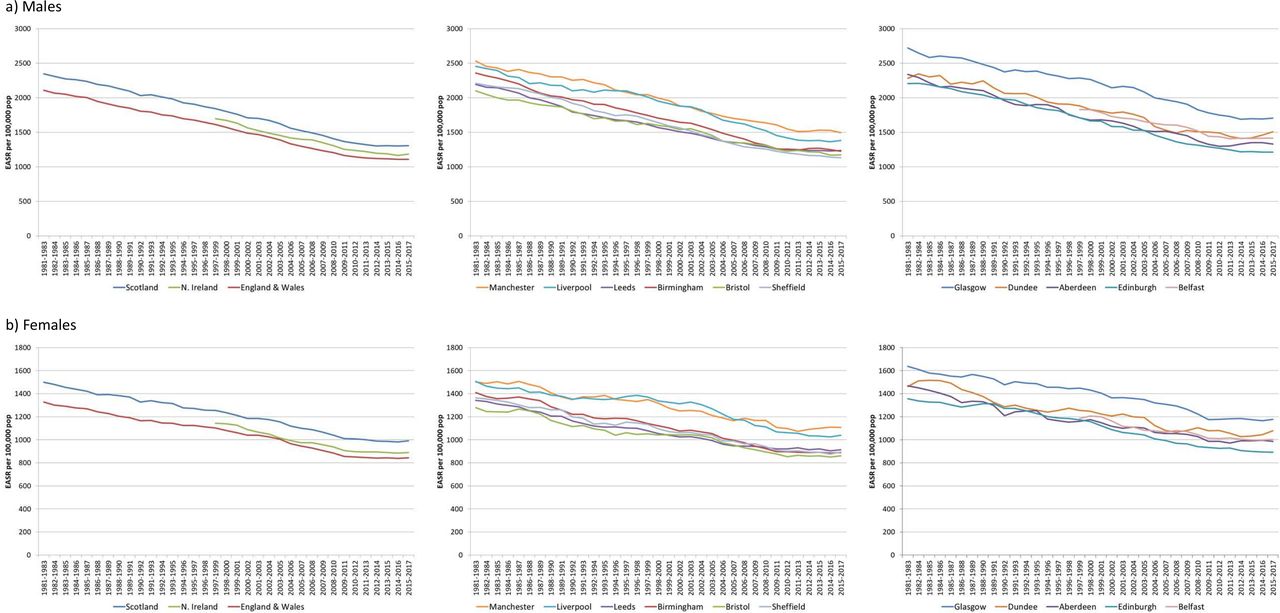
European age-standardised mortality rates (all ages, all causes) per 100 000 population, 3-year rolling averages, by UK country and city, 1981–2017, for (a) males and (b) females. EASR, European age-standardised mortality rate.
To quantify the changes shown above, figure 2 shows the percentage change in rates between 5-year periods for Scotland, England & Wales and Northern Ireland. For women, mortality rates were decreasing by approximately 4%–6% during the 1980s and 1990s, with a faster improvement of approximately 7%–9% during the 2000s, and a much slower decrease of <1% between 2011/2013 and 2015/2017. Among men, mortality rates were decreasing slightly faster during the 1980s and early 1990s (by 4%–7%), with a faster improvement of approximately 8%–12% during the late 1990s and 2000s, and again a much slower decrease between 2011/2013 and 2015/2017 of 1%–3%. Similar data for the cities are shown in the online supplemental figure 1: these show a very similar overall pattern to the country-level analyses, although with greater fluctuation in the percentage change figures in some cities such as Dundee. However, it is also notable that—despite that fluctuation—in the most recent 5-year period mortality rates actually worsened among both males and females in Dundee and Aberdeen, and among females in Manchester, while there was virtually no improvement among males in Liverpool and females in Birmingham (−0.3% for both).
Supplemental material

All-cause deaths, all ages: percentage change in standardised mortality rates between 5-year periods for (a) males and (b) females. n/a, not applicable.
Note that analyses based on more ‘standard’ 5-year periods (1981–1985, 1986–1990 up to 2011–2015) produced very similar results (data not shown).
Analyses of trends and changes in rates for ages 0–64 years (rather than all ages) are presented in online supplemental figure 2 for the countries of interest. While the results are broadly similar to those seen for all ages, the data suggest there has been a slight increase (rather than slowdown) in mortality rates for Scotland in the most recent period. Across the cities, a more notable change was observed in Dundee for males in this age group: a 26% increase in mortality between 2011/2013 and 2015/2017 (online supplemental figure 3). Notwithstanding the greater fluctuation in changes in rates in this age group at city level, it is also of note that there was an increase in female mortality rates in the last period in each English city.
Supplemental material
Supplemental material
Trends in all-cause rates for 45–64 years were similar to those described above for 0–64 years, and rates for 65+ years were broadly similar to those observed for all ages. For the 15–44 age group, rates were notably higher in Scotland than England & Wales, and the mortality gap had become wider in the most recent period. These data are all shown in online supplemental figure 4(i). Although the principal focus of these analyses is adult mortality, online supplemental figure 4(ii) shows country-level rates over time for ages 0–14 years. It is notable that child mortality rates in Scotland have been consistently lower than in England & Wales since the late 1990s for females and early to mid-2000s for males, a reversal of the position at the beginning of the period. Rates are highest in Northern Ireland, although they are also subject to greater fluctuation over time.
Supplemental material
Figure 3 again shows male all-cause mortality rates for all ages but additionally presents the rates for the least and most deprived deprivation quintiles within Scotland, England, Northern Ireland and an illustrative selection of three Scottish cities. Increased mortality rates are observed in the most recent period for the most deprived fifth of the population in each country/city shown (although there is again more fluctuation in rates at the city level). Similar trends were observed for female mortality rates, as shown in online supplemental figure 5. Summary measures of inequalities (SIIs, RIIs) confirm widening absolute and relative inequalities across deprivation quintiles since 2011/2013 in all countries and cities analysed (online supplemental table 2a,b). For example, for all-cause deaths among men in England, the absolute gap across quintiles (as measured by the SII) increased from 738.8 in 2010/2012 to 784.6 in 2015/2017, despite having decreased between 2001/2003 and 2010/2012; relative inequalities increased over the whole period.
Supplemental material
Supplemental material

European age-standardised mortality rates (males, all ages, all causes) per 100 000 population, 3-year rolling averages by selected country, city and country/city-specific deprivation quintiles. EASR, European age-standardised mortality rate.
Mortality rates over time by deprivation quintile are explored in more detail for Scotland in figure 4, which presents data for females for all 10 causes of death analysed. A widening gap between the most and least deprived quintiles in the most recent years of analysis can be seen for the majority of causes, in particular respiratory disease, external causes, drug-related poisonings and alcohol-related causes. Different trends are observed for suicide (where the gap has narrowed) and MVTAs (where numbers of deaths are relatively small and there is considerable fluctuation in rates across quintiles of deprivation). Generally, the same patterns, in terms of a widening gap between the most and least deprived deprivation quintiles for the majority of causes of death, are observed for male deaths (online supplemental figure 6). The main difference between the male and female trends relates to cancer mortality, in particular lung cancer, with a widening deprivation gap observed for females but not males. The general pattern of widening inequalities for the majority of causes is confirmed by analysis of SIIs and RIIs (online supplemental table 3a,b).
Supplemental material
Supplemental material
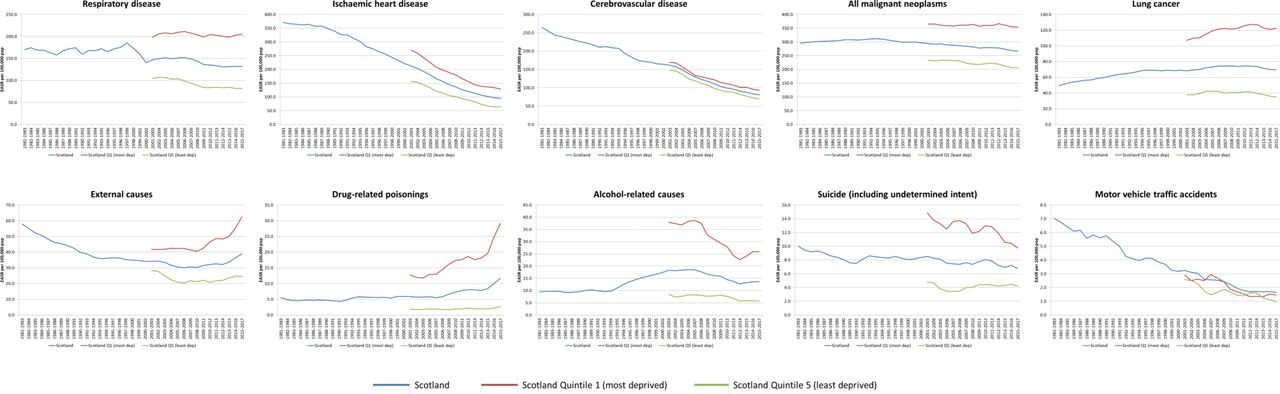
European age-standardised mortality rates (females, all ages) per 100 000 population, 3-year rolling averages for 10 causes of death, Scotland and most and least deprived deprivation quintiles. EASR, European age-standardised mortality rate.
Aside from evidence of a slowdown in mortality improvement and widening deprivation gaps (already shown in figures 1 and 3), the analyses of city-level mortality rates highlight a number of other issues. Foremost among them is that Glasgow stands out in terms of having the highest mortality rates of all the cities for all-cause deaths and the majority of causes analysed (including strikingly different trends for alcohol-related causes). Some exceptions do apply, however: for example, for all ages death rates from IHD are now marginally higher in Manchester for both males and females, while deaths from drug-related poisonings are now highest in Dundee. Some of these data are shown for males in figure 5, and for females in online supplemental figure 7.
Supplemental material

European age-standardised mortality rates (males, all ages) per 100 000 population, 3-year rolling averages, for all-cause deaths, ischaemic heart disease, alcohol-related causes and drug-related poisonings, UK countries and cities, 1981–2017. EASR, European age-standardised mortality rate.
Finally, figure 5/online supplemental figure 7 also highlight notable similarities and differences in long-term mortality trends between Scotland and England. For example: a narrowing of the gap between the countries for IHD; much higher drug-related poisonings in Scotland compared with England—although rates are increasing in both countries; and notably higher rates of death from alcohol-related causes in Scotland, with the most recent increase in rates much more pronounced in Scotland than in England. The striking trends in drug-related poisonings are explored in more depth in online supplemental figure 8 (comparing the UK countries for selected age groups and by sex) and online supplemental figure 9 (showing data for Scotland and its most and least deprived quintiles for ages 0–64 years). There has been a widening divergence in death rates from this cause between Scotland and the rest of the UK over the period shown, and a further increase in rates is again observed since approximately 2012. Similar deprivation trends for drug-related poisonings are evident in the Scottish cities (data not shown).
Supplemental material
Supplemental material
Discussion
Overall findings and implications
The study presents further evidence of a slowdown in mortality rate improvement over time within the UK. In some cases—deaths under 65 years in Scotland and all-age mortality in particular cities—rates have increased, rather than stalled, in recent years. These overall changes appear to be particularly driven by worsening mortality among the most socioeconomically disadvantaged populations. Similar trends are observed across all countries and cities in the UK; however, particular issues apply in Scotland, for example, in relation to drug-related mortality. The timing, geographical coverage and socioeconomic gradients associated with the changes appear to further support suggestions that recent changes in mortality are at least partly a consequence of UK Government ‘austerity’ measures.
Strengths and weaknesses
The analyses were based on data covering the whole population, not samples. Mortality is a robust population health indicator and is not subject to the limitations and potential biases associated with self-reported measures.23 24 We included the largest cities within Scotland and Northern Ireland and, with the exception of London, the six largest cities in England. We were able to examine recent changes in mortality in the context of much longer term trends: almost 40 years in the case of Scotland and England & Wales. We analysed data for a broad set of causes of death, not just all deaths combined.
The exclusion of London is arguably a weakness, although it was done to facilitate more meaningful comparisons across the other cities with more similar population sizes. Other limitations include the fact that time trend data for Northern Ireland were much more limited than for the rest of the UK. Interpretation of trends at city, rather than country level can also be problematic, given the fluctuation in rates that occur. Although the measures of area-based multiple deprivation that are employed within Scotland, England and Northern Ireland have many similarities, they are derived from different data sets and calculated at different spatial scales and are thus not directly comparable. We standardised mortality rates using 18 age groups (0–4 years to 85 years and above) while it is now recommended to standardise on the basis of 19 groups (0–4 years to 90 years and above)25: however, the impact of this is fairly minimal. Although our youngest age bracket is 0–14 years, we did not include infant mortality (deaths under 1 year of age) as a distinct category: as a major focus of the work was city-based analyses, data on infant deaths were not requested from the various statistical agencies as numbers of deaths at that geographical level in the UK are very small; however, given recent evidence of increasing infant mortality rates in England (linked to increased child poverty rates), this was arguably an oversight.26 Finally, the definition of drug-related poisonings is a broader, less sophisticated definition than that employed in official UK publications of drug-related mortality in the UK. In 2017, for example, there were 1037 such drug-related poisonings in Scotland, 11% higher than the 934 drug-related deaths recorded by the NRS.27
Relevance to other studies
Slower improvement in mortality and life expectancy in the UK in recent years has been shown by various authors and organisations.1 2 5–8 Similar trends have been observed in a number of countries, although in a recent analysis of 20 high-income countries, only the USA had experienced a greater reduction in improvement than the UK.5 As others have proposed, it appears increasingly likely that these changes are at least in part attributable to UK Government policy which since 2010 have brought about dramatic cuts to social security budgets and other public services, particularly affecting the most vulnerable.10–13 There is international evidence of the associations between such government measures and increased mortality rates,14 15 and the particular model of austerity adopted in the UK (based on spending cuts rather than a taxation approach) is known to be more regressive.13 UK research has highlighted associations between different UK austerity measures and increased child poverty,26 28 expansion of food banks,29 increased homelessness,30 poorer mental health among affected populations31 and, ultimately, increased numbers of deaths among the poorest at different ages.8 Interactions between such policy-driven factors and other influences such as high winter mortality in particular years have also been suggested.6
The widening socioeconomic inequalities in mortality since around 2012 have been shown previously for Scotland8 9 and England,7 32 but only at national level, and only for all-cause mortality and life expectancy. The increase in drug-related deaths within Scotland has been the focus of much media attention, resulting in two recent Westminster Parliamentary Committee enquiries,33 34 and the establishment of ‘drugs death task force’ by the Scottish Government in 2019.35 The increase is known to be the result of a ‘perfect storm’ of factors: a previously described vulnerable cohort of drug users who are now encountering multiple morbidities as they age; increased affordability and accessibility of chosen drugs; and the aforementioned UK Government austerity measures which have impacted on both individual income and funding of drug-related and other relevant social services.33 34 36 These drug mortality trends are likely to have influenced the overall increasing death rates in Scotland (and in Dundee) among 0–64 year-olds.
Alcohol mortality trends have historically been impacted by changes in price and availability in combination with socioeconomic vulnerability,37 38 while the reasons for Glasgow’s particularly high mortality rates (including from alcohol, drugs and other causes) have been described in detail previously, being attributable to higher socioeconomic deprivation alongside an additional vulnerability created by a combination of multiple historical factors including worse living conditions and adverse policymaking at different levels of government.39
The contrasting trends in lung cancer mortality between males (decreasing rates) and females (increasing rates) living in the most deprived quintile in Scotland are also best explained in terms of different cohorts, with females having started smoking later than males: this has been shown in a number of other analyses.40 In addition, one of the other notable differences between male and female trends—the apparent earlier slowdown in mortality improvement for females—is worthy of further analysis. Data presented here for both countries and cities suggest a change in female mortality rates from around 2010/2012 or 2011/2013, potentially suggesting women’s circumstances might be more sensitive to government austerity policies. However, more detailed analysis of Scottish data by Fenton et al2 instead suggested a change between 2013 and 2014. Finally, although the main focus of the paper is adult mortality, the extent to which Scotland’s child mortality rate has improved relative to that of England & Wales may be associated with a similar widening gap in child poverty levels between the countries over a similar time period is worthy of further investigation.41
Conclusions
These results add to the growing body of evidence of changing mortality rates within the UK in recent years and their likely political causes. With mortality rates rising among the UK’s most deprived populations even prior to the COVID-19 pandemic, it is imperative that a range of policies are introduced to protect the health of the most vulnerable in society.
Acknowledgments
We are grateful to the various individuals and organisations who supplied the required data: National Records of Scotland (NRS), the Office for National Statistics (ONS) and the Northern Ireland Statistics and Research Agency (NISRA). Particular thanks are due to Elaine Longden at NISRA for helpful advice and interpretation of trends, and also to Rebecca Holleyat at ONS. In addition, we gratefully acknowledge the work of the Geography, Population and Deprivation (GPD) Team of ISD Scotland for the provision of various SIMD deprivation lookup files.
References
Supplementary materials
Supplementary Data
This web only file has been produced by the BMJ Publishing Group from an electronic file supplied by the author(s) and has not been edited for content.
Footnotes
Twitter @gerrymccartney1, @JonMinton
Contributors DW originally conceived the study. The research questions and analysis plan were agreed by all authors (GMC, JM, JP, DS and BW). DW undertook the analyses and drafted the manuscript. All authors provided substantial critical input to improve the manuscript and all authors approved the final draft.
Funding The authors have not declared a specific grant for this research from any funding agency in the public, commercial or not-for-profit sectors.
Competing interests None declared.
Patient consent for publication Not required.
Provenance and peer review Not commissioned; externally peer reviewed.
Data availability statement Data may be obtained from a third party and are not publicly available. All data relevant to the study are included in the article or uploaded as supplementary information. No additional data are available. The analysed data presented in the paper are not publicly available. However, the data on which the analyses were based can be requested from the national statistical agencies listed in the manuscript.
Supplemental material This content has been supplied by the author(s). It has not been vetted by BMJ Publishing Group Limited (BMJ) and may not have been peer-reviewed. Any opinions or recommendations discussed are solely those of the author(s) and are not endorsed by BMJ. BMJ disclaims all liability and responsibility arising from any reliance placed on the content. Where the content includes any translated material, BMJ does not warrant the accuracy and reliability of the translations (including but not limited to local regulations, clinical guidelines, terminology, drug names and drug dosages), and is not responsible for any error and/or omissions arising from translation and adaptation or otherwise.