Article Text

Abstract
Objective Annual gains in life expectancy in Scotland were slower in recent years than in the previous two decades. This analysis investigates how deaths in different age groups and from different causes have contributed to annual average change in life expectancy across two time periods: 2000–2002 to 2012–2014 and 2012–2014 to 2015–2017.
Setting Scotland.
Methods Life expectancy at birth was calculated from death and population counts, disaggregated by 5 year age group and by underlying cause of death. Arriaga’s method of life expectancy decomposition was applied to produce estimates of the contribution of different age groups and underlying causes to changes in life expectancy at birth for the two periods.
Results Annualised gains in life expectancy between 2012–2014 and 2015–2017 were markedly smaller than in the earlier period. Almost all age groups saw worsening mortality trends, which deteriorated for most cause of death groups between 2012–2014 and 2015–2017. In particular, the previously observed substantial life expectancy gains due to reductions in mortality from circulatory causes, which most benefited those aged 55–84 years, more than halved. Mortality rates for those aged 30–54 years and 90+ years worsened, due in large part to increases in drug-related deaths, and dementia and Alzheimer’s disease, respectively.
Conclusion Future research should seek to explain the changes in mortality trends for all age groups and causes. More investigation is required to establish to what extent shortcomings in the social security system and public services may be contributing to the adverse trends and preventing mitigation of the impact of other contributing factors, such as influenza outbreaks.
- life expectancy
- decomposition
- scotland
- mortality
This is an open access article distributed in accordance with the Creative Commons Attribution Non Commercial (CC BY-NC 4.0) license, which permits others to distribute, remix, adapt, build upon this work non-commercially, and license their derivative works on different terms, provided the original work is properly cited, appropriate credit is given, any changes made indicated, and the use is non-commercial. See: http://creativecommons.org/licenses/by-nc/4.0/.
Statistics from Altmetric.com
Strengths and limitations of this study
This is the first paper to describe the contribution of specific age groups and causes of death to recent changes in life expectancy in Scotland.
It uses a high-quality dataset of deaths in which very few death registrations are missing and where less than 10% of deaths are coded using ill-defined causes.
The results are limited to describing trends rather than explaining causal social and biological processes.
The analysis does not identify the mechanism through which a given cause of death exerts an effect on life expectancy.
The analysis of cause of death within age group required broad groupings of causes of death, which is likely to conflate diverse causal mechanisms.
Introduction
Life expectancy improvement rates in Scotland have been slower since 2012–2014 than in previous decades, the inequalities gradient across the deprivation scale has steepened, and age-standardised mortality rates have increased for those living in the most deprived areas, leading to widening health inequalities.1 2 This comes against a background of consistently lower life expectancy in Scotland compared with the rest of Western Europe since the 1980s, and consistently worse socioeconomic inequalities in mortality.3
A similar slow-down since around 2012 in the long-term trend of life expectancy has been observed across many high-income countries.2 4 5 Among 20 high-income countries, only the USA had a slower improvement in life expectancy than the UK in the most recent 6 years compared with the previous 6 years.6 Continued improvements have been seen in some of the countries with the highest life expectancies, and among people living in more affluent areas, both of which undermine suggestions that the recent trends are due to a ‘natural ceiling’ being reached.2 5
Other explanations for the recent trends have included: that the UK, along with much of the rest of Western Europe, has experienced exceptionally high winter mortality7–9; that an increase in ‘deaths of despair’—those from alcohol, drugs and suicides—have offset broader health improvements10; that funding for health and social care services has not kept up with demand11 12; and, relatedly, that austerity policies have impacted on health through mechanisms such as reduced social security payments and underemployment.13 14 Such explanations are likely neither mutually exclusive nor exhaustive, and some (such as additional winter deaths and slowing improvements in ischaemic heart disease (IHD) mortality) may plausibly result from other causes, such as increased pressure on healthcare services and associated unmet need.15
Many of the above explanations differ about how mortality changes for specific age groups, and causes, have contributed to the overall slow-down in life expectancy growth. This includes increases in several countries in mortality from dementia/Alzheimer’s disease, drug-related deaths and suicide and marked slow-downs in the previous rapid improvements in cardiovascular mortality.9 10
We aimed to explore the reasons for these recent changes by describing the contribution of specific age groups and causes of death to the slow-down in life expectancy growth in Scotland in two successive time periods (2000–2002 to 2012–2014 and 2012–2014 to 2015–2017).
Methods
We used repeat cross-sectional data to undertake comparative decomposition analyses of life expectancy over time. The data used includes all deaths which occurred in Scotland from 2000 to 2017 (inclusive) as held by National Records of Scotland.
Period life expectancy at birth was calculated from abridged life tables available from National Records of Scotland for males and females separately, using 3 years combined data to allow robust breakdowns by cause of death and age group.16 For the age group decomposition, death counts and population data in 5 years age groups were used, separating <1 year from 1 to 4 years and using 90+ years as the oldest age category. For the cause of death decomposition, International Statistical Classification of Diseases and Related Health Problems 10th Revision (ICD) categories were grouped into 26 categories. These groupings are exclusive and exhaustive, and were developed on the basis that: at least the five leading causes of death should be separate categories; proposed and plausible contributory causes to life expectancy changes should be independent categories; and that the residual group should overall make a small contribution to life expectancy changes. The leading causes of death categorisation used by the Office for National Statistics was employed as the basis to determine groupings where appropriate.17 Due to the overlaps between drug-related deaths and other causes (mental and behavioural excluding dementia, suicides, accidents and other external), for the purposes of this analysis these four causes exclude drug-related deaths (online supplemental file 1).
Supplemental material
We calculated the changes in life expectancy between 3-year rolling periods for males and females for the whole time series from 1980 before focusing on two time periods from 2000 onwards. (The 10th revision of ICD was implemented in 2000 in Scotland and data prior to this period is not consistent across the cause of death categories examined.) Life expectancy growth between 2000–2002 and 2012–2014 and between 2012–2014 and 2015–2017 was decomposed into age and cause components using Arriaga’s method with the aid of syntax developed by Auger et al.18 19 The break between the two periods was selected on the basis of the previously identified change in mortality trend which showed that the best estimate of when mortality rates changed to a slower rate of improvement was the year to 2012 quarter 4 for men and the year to 2014 quarter 2 for women.2 As life expectancy data is based on 3-year rolling periods, 2012–2014 was chosen to most accurately reflect this breakpoint. Life expectancy change and decomposition results are presented as annualised change in life expectancy (in weeks) to account for the different length of the two time periods. For the analysis of cause of death within age group, the age and cause of death categories were aggregated into five mutually exclusive age groups, and eight mutually exclusive cause-of-death groupings (40 age-cause groupings). A more detailed disaggregation (20 age groups and 26 cause-of-death groups) is presented in online supplemental files 2 and 3.
Supplemental material
Supplemental material
Patient and public involvement
This research was done without direct patient or public involvement.
Results
Rate of improvement in life expectancy
Life expectancy in Scotland had increased steadily until around 2012, but improvements have since stalled and life expectancy has decreased in recent years. Although the rate of improvement has fluctuated over time, it has rarely been as low as in the last few years, and any slower periods have not been sustained (figure 1).

Life expectancy and annual change in life expectancy, 1980–1982 to 2015–2017, by sex, Scotland.
Decomposition of life expectancy changes by age and sex
In the earlier period (2000–2002 to 2012–2014) the annualised increase in male life expectancy was 16.3 weeks/year. However, during the later period (2012–2014 to 2015–2017) male life expectancy fell by an average of 1.1 weeks/year. During the earlier period, all age groups contributed to increases in life expectancy (figure 2) though the greatest contribution (61% of the increase) came from the 55–79 year age group. During the later period, males aged 40–54 years and 90+ years made substantial negative contributions to overall changes in life expectancy. Although still contributing positively to life expectancy growth in the later period, mortality improvement among male aged 55–84 years old declined markedly and contributed considerably to the slowing of life expectancy growth. There was a notable reduction in the rate of improvement for males aged 15–34 years, although the smaller number of deaths at these ages meant that this made a smaller contribution to the overall change in life expectancy. There were also small but noticeable declines in the rate of improvement for infants and children aged 1–4 years.

Decomposition of changes in life expectancy between 2002–2002 and 2012–2014, and from 2012–2014 to 2015–2017, by sex, Scotland.
Patterns across age groups were similar for females, although both the rates of improvement and the scale of change were smaller than for males (figure 2). During the earlier period female life expectancy grew by 10.0 weeks/year, with mortality improvements in all age groups. The largest contributions to the increase (64%) came from the 60 to 84 years age group. During the later period, the annualised improvement in life expectancy declined to less than 0.1 weeks/year. For those aged 30–49 years and 85+ years, mortality rates worsened. Mortality improvements among those aged 60–84 years were very much reduced compared with the earlier period. There was also slowing in improvements for infants, children aged 1–4 years and 10–14 years old.
Decomposition by detailed cause of death
For males, the single largest cause of the slow-down in life expectancy growth was slower improvements in IHD mortality (figure 3). In the earlier period, reductions in IHD mortality added 5.8 weeks/year to male life expectancy; in the later period they added only 2.2 weeks per year. Drug-related deaths made the second biggest contribution for males, changing from a small negative impact (−0.4 weeks/year) in the earlier period to a much larger negative impact (−2.4 weeks/year) afterwards. Other circulatory diseases, cerebrovascular disease, dementia and Alzheimer’s disease also made substantial contributions to the slow-down. Only two causes, ‘other respiratory’ and genitourinary, contributed more to male life expectancy growth after 2012–2014 than before.

Decomposition of the contribution of specific causes of death to changes in life expectancy between 2000–2002 and 2012–2014 and between 2012–2014 and 2015–2017, by sex, Scotland.
*Excluding causes that are included under drug-related deaths. IHD, ischaemic heart disease.
For females, the same broad causes had the largest impact on life expectancy growth, although again the scale of change was smaller than for males. The single largest cause of the slow-down in life expectancy growth was IHD mortality. As in males, drug-related deaths had the second biggest impact on life expectancy, changing from a small negative impact in the earlier period to a much larger negative impact in the later one. Improvements in mortality from other circulatory causes reversed in the later time period. For cerebrovascular disease, there was a marked decline in the rate of improvement between the two time periods. Dementia and Alzheimer’s disease mortality worsened from the earlier period. For some causes female mortality improved after 2012–2014, making a positive contribution to life expectancy growth; these included lung cancer, other respiratory causes, other cancers, genitourinary, ill-defined causes and breast cancer.
Decomposition by age and broad causes of death
The contributions of different causes of death to life expectancy trends varied across age groups but were generally similar between males and females. For those aged <35 years, improvements in mortality from external causes made the greatest single contribution to the positive trend in the earlier period (2000–2002 to 2012–2014). In the later period (2012–2014 to 2015–2017) this fell to 0.3 weeks/year for males and disappeared for females. Mortality rates for drug-related deaths and cancers increased slightly in the later time period for those aged <35 years (figure 4).
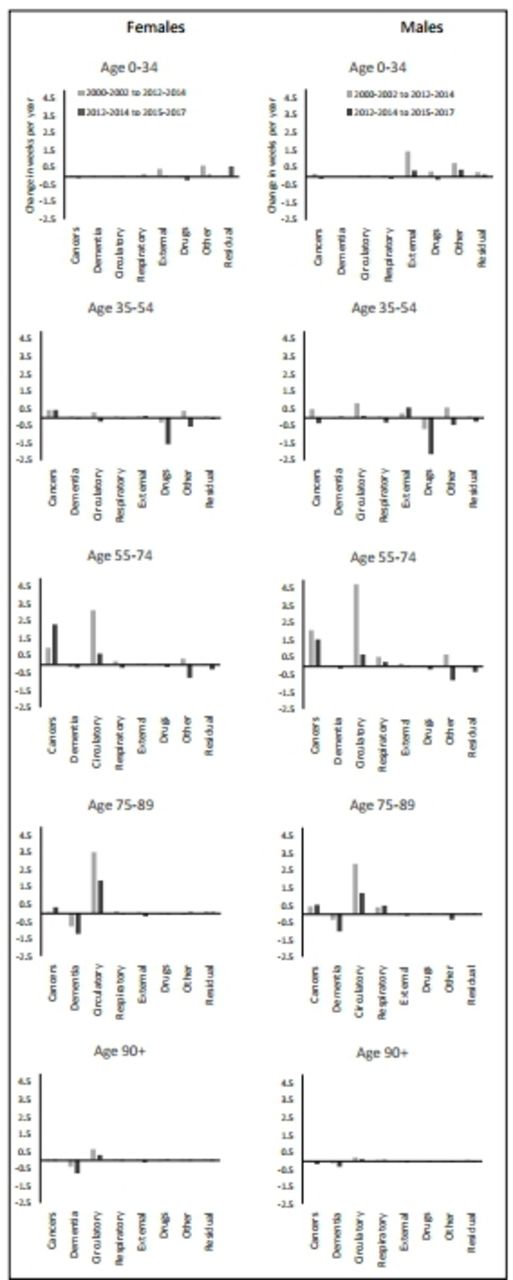
Decomposition of changes in life expectancy by grouped age and cause of death, 2000–2002 to 2012–2014 and 2012–2014 to 2015–2017, by sex, Scotland.
For those aged 35–54 years, the overall negative contribution to life expectancy changes was due both to substantial reductions in the rate of improvement for some causes of death (including circulatory causes) and absolute increases in mortality for others (such as drug-related deaths, cancers and other causes; figures 4 and 5).
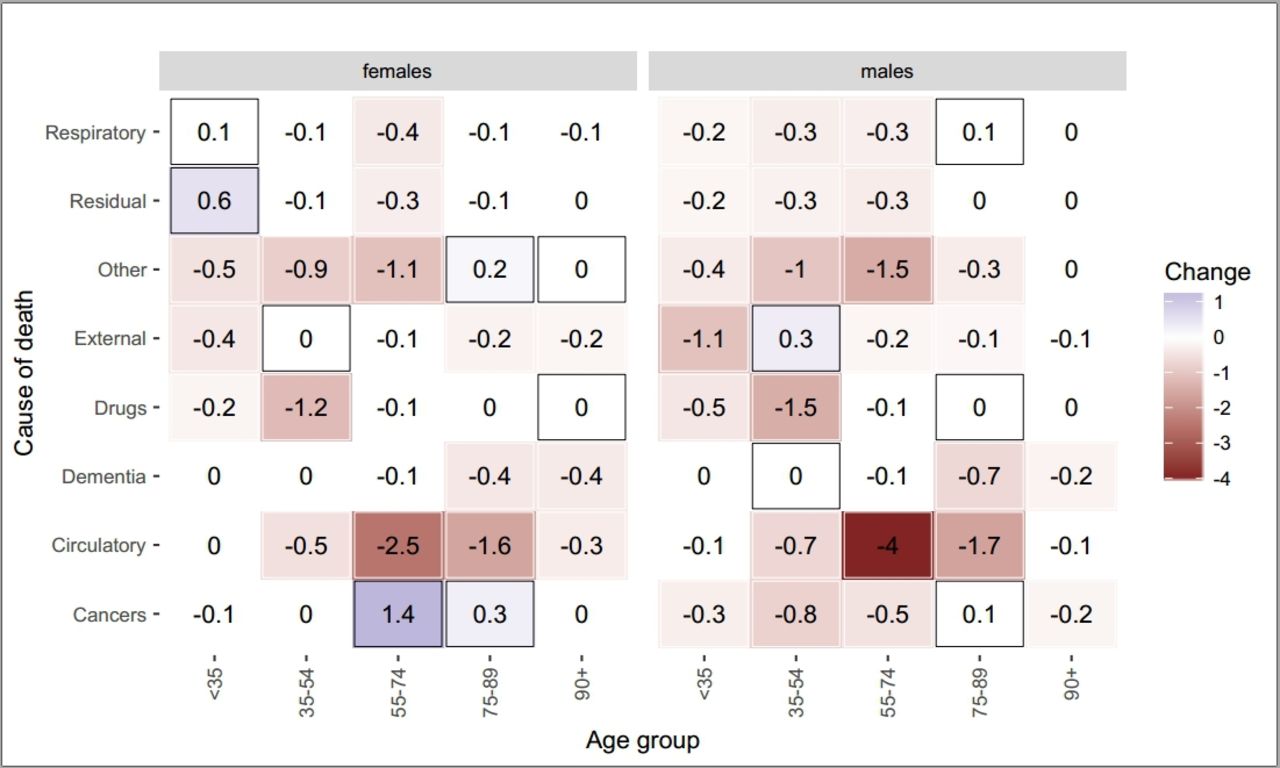
Decomposition of change in life expectancy growth pre and post 2012–2014 by grouped age and cause of death, by sex, Scotland.
Values in cells indicate the difference in contribution to life expectancy change between the two periods, in weeks per year. Positive contributions are shaded blue and outlined with boxes. Negative contributions are shaded red and have no box outline.
Although the overall contribution to life expectancy of those aged 55–74 years remained positive in the later period, the dramatic decline in the positive contribution of this age group is important in explaining overall trends (figure 2). Much of this decline was explained by the much slower improvement in deaths from circulatory causes in the later compared with the earlier period. Improvements in cancer mortality slowed among males but increased markedly among females. For both males and females, deaths due to dementia, drugs and other causes all made negative contributions in the later time period to life expectancy growth (figures 4 and 5).
The contributions of broad causes of death to trends in life expectancy among those aged 75–89 years was similar to that of those aged 55–74 years, but the negative contribution of dementia and Alzheimer’s disease increased in the later period. Improvements in mortality from circulatory causes fell substantially. Positive trends in cancer mortality improved further for both males and females between the earlier and later periods (figures 4 and 5).
Among the oldest age group (90+ years), the small overall contribution to life expectancy growth changed from positive to negative between the earlier and later time periods (figure 2). This was due to worsening mortality due to dementia as well as a slowing in the rate of improvement due to circulatory causes (figures 4 and 5).
More detailed age groups and causes of death are presented in online supplemental files 2 and 3. These show that mortality in the first year of life from causes of death originating in the perinatal period has improved at a slower rate since 2012–2014 for males and has worsened slightly for females (although given the relatively small numbers and the fact that this has not occurred for both sexes, this finding should be treated with caution). The detailed findings also indicate that the increasingly negative contribution of drug-related deaths to life expectancy trends is mainly concentrated among 35–44 years old for females and 40–49 years old for males. The slow-down of improvements in IHD mortality is mainly concentrated in male aged 60–69 years and female aged 65–74 years; the negative contribution of suicides is concentrated in males aged 25–29 years old, and the rising contribution of dementia and Alzheimer’s disease is concentrated in the oldest age groups.
Discussion
Main results
Life expectancy in Scotland steadily improved from the early 1980s until 2012–2014, after which the rate of improvement slowed, followed by declines in life expectancy between 2014–2016 and 2015–2017. Between 2000–2002 and 2012–2014, annualised increases in male and female life expectancy were 16.3 and 10.0 weeks/year, respectively, but this changed to a decline of 1.1 weeks/year for males and to a very small increase of less than 0.1 weeks/year for females between 2012–2014 and 2015–2017. In the earlier period, most of the increases in life expectancy were due to falling mortality among those aged 55–84 years, although mortality rates declined for all age groups. In the later period, declines in mortality were slower for all age groups, particularly those aged 55–84 years. Mortality increased for males aged 30–54 years, females aged 35–49 years and both males and females aged 90+ years.
Almost all causes of death demonstrated a change in trend in the recent period. Although mortality due to IHD and cerebrovascular disease continued to decline in the later period, life expectancy gains due to these conditions were less than half of those in the earlier period. This affected all age groups, but was particularly important in explaining the slowing in improvement for those aged 55–74 years, and to a lesser extent those aged 35–54 years. Mortality from drug-related causes and from dementia and Alzheimer’s disease, which were already making negative contributions to life expectancy in the earlier period, made larger negative contributions after 2012–2014. The previous favourable trends in mortality from other circulatory causes reversed. The increase in drug-related deaths was particularly important in explaining increasing mortality among those aged 35–54 years, while increases in dementia and Alzheimer’s disease mortality substantially explained trends among those aged 90+ years.
Strengths and limitations
The key strengths of this analysis are the use of a complete mortality dataset for the whole population which reduces the risk of bias from missing data or selection biases. Less than 10% of deaths in Scotland are coded using ill-defined causes. We also use standard decomposition analysis (Arriaga) methods that are thereby comparable to estimates produced for other populations. The analysis is limited to the use of cause of death codes which do not illuminate the overall social causation and mechanisms leading to mortality—this is the subject of other work. We also had to use broad grouping of death codes within age groups to improve the precision of our estimates which is likely to conflate diverse causal mechanisms.
How this compares with existing research
The stalling in life expectancy trends in Scotland is of a similar magnitude to the rest of the UK and USA, but greater than in some other parts of Europe.2 4 5 Much of the initial research describing recent slowing in life expectancy gains has focused on the role of influenza and mortality among the oldest age groups.9 20 Although we report increases in deaths due to influenza and respiratory causes, and rising mortality among those aged 90+ years, these results show that the contribution they make to explaining the overall slowing in life expectancy growth in Scotland is small. This is consistent with other studies in England and Wales and the USA which report that slowing improvements for IHD and cerebrovascular disease and increases in mortality for other circulatory causes among 55–84 years old and drug-related deaths for adults aged 35–49 years, all make substantial contributions to the overall trends.21–25 The slightly slower rate of improvement in the most recent period for women compared with men indicates that the long-term closing of the sex gap seems to be continuing.
There is evidence that the increase in drug-related deaths in Scotland is due in part to a cohort effect among males who were young adults during the 1980s.26 Some recent trends may, therefore, be attributable to historical exposures to political and social change at that time and before, whereby risk of mortality accumulates over time within that cohort.3 26
The reasons for slowing improvements in cardiovascular disease mortality is not clear. Possible explanations might include slowing of progress in reducing exposure to tobacco, increases in the prevalence of obesity, changes in psychosocial risk factors related to economic insecurity or deterioration in access to, or the quality of, health and social care services.27 This should be the focus of further specific work to understand the timing and reasons for the stalling.28
The increase in mortality from dementia and Alzheimer’s disease has been attributed to a number of factors, including: people living longer and surviving other illnesses29; increased awareness of dementia, making it more likely to be diagnosed and recorded9 25 and National Health Service policies encouraging dementia diagnosis.25 Changes in death certification practices have also been cited as one of the reasons for increase in deaths from dementia and Alzheimer’s disease,6 although it should be noted that these changes did not occur in Scotland until 2017 so will have had a limited impact on these results.
Implications
Several hypotheses have been proposed to explain recent life expectancy trends in Scotland and other high-income countries.15 Further research should include work to understand the mechanisms and processes underlying the changes at different life-course stages: the considerable rise in drug-related deaths among working-age adults; the substantial slow-down in improvements for IHD, cerebrovascular disease and other circulatory causes; and the rise in mortality from dementia and Alzheimer’s disease among those aged 90+ years.
The recent change in life expectancy trends represents a very substantial mortality impact which needs to be reflected in the level of priority given to understanding this further. Mortality has worsened (through slowing improvements or mortality increases) across many age groups and causes, so it is unlikely that any single factor provides sufficient explanation. The extent to which there is a common underlying cause or exposure affecting each of these age groups should be prioritised for further investigation.
References
Supplementary materials
Supplementary Data
This web only file has been produced by the BMJ Publishing Group from an electronic file supplied by the author(s) and has not been edited for content.
Footnotes
Twitter @juliemramsay, @JonMinton, @FentonLynda, @gerrymccartney1
Contributors LF and GM conceived the idea for this study. JR, MK-B and JM undertook the analyses. GM and JR drafted the manuscript. CF, GMAW and ER along will all other authors made substantial contributions to interpretation of results and editing the manuscript, and all approved the final draft.
Funding This research received no specific grant from any funding agency in the public, commercial or not-for-profit sectors. JR and MK-B are salaried by NRS and GM, LF, JM, GMAW, CF and ER are salaried by the NHS.
Competing interests None declared.
Patient and public involvement Patients and/or the public were not involved in the design, or conduct, or reporting, or dissemination plans of this research.
Patient consent for publication Not required.
Ethics approval No new data were collected in this study and there was no public or patient involvement. We used mortality data made available to us by National Records of Scotland and adhered to our standard procedures to protect against disclosure.
Provenance and peer review Not commissioned; externally peer reviewed.
Data availability statement Data are available on reasonable request. Life expectancy data and mortality breakdowns by cause of death and age are available on the National Records of Scotland website (www.nrscotland.gov.uk). Breakdowns by detailed cause of death are available on request from Julie.ramsay@nrscotland.gov.uk.