Article Text

Abstract
Objective Gains in life expectancy have faltered in several high-income countries in recent years. Scotland has consistently had a lower life expectancy than many other high-income countries over the past 70 years. We aim to compare life expectancy trends in Scotland to those seen internationally and to assess the timing and importance of any recent changes in mortality trends for Scotland.
Setting Austria, Croatia, Czech Republic, Denmark, England and Wales, Estonia, France, Germany, Hungary, Iceland, Israel, Japan, Korea, Latvia, Lithuania, Netherlands, Northern Ireland, Poland, Scotland, Slovakia, Spain, Sweden, Switzerland and USA.
Methods We used life expectancy data from the Human Mortality Database (HMD) to calculate the mean annual life expectancy change for 24 high-income countries over 5-year periods from 1992 to 2016. Linear regression was used to assess the association between life expectancy in 2011 and mean life expectancy change over the subsequent 5 years. One-break and two-break segmented regression models were used to test the timing of mortality rate changes in Scotland between 1990 and 2018.
Results Mean improvements in life expectancy in 2012–2016 were smallest among women (<2 weeks/year) in Northern Ireland, Iceland, England and Wales, and the USA and among men (<5 weeks/year) in Iceland, USA, England and Wales, and Scotland. Japan, Korea and countries of Eastern Europe had substantial gains in life expectancy over the same period. The best estimate of when mortality rates changed to a slower rate of improvement in Scotland was the year to 2012 quarter 4 for men and the year to 2014 quarter 2 for women.
Conclusions Life expectancy improvement has stalled across many, but not all, high-income countries. The recent change in the mortality trend in Scotland occurred within the period 2012–2014. Further research is required to understand these trends, but governments must also take timely action on plausible contributors.
- epidemiology
- public health
- statistics & research methods
This is an open access article distributed in accordance with the Creative Commons Attribution Non Commercial (CC BY-NC 4.0) license, which permits others to distribute, remix, adapt, build upon this work non-commercially, and license their derivative works on different terms, provided the original work is properly cited, appropriate credit is given, any changes made indicated, and the use is non-commercial. See: http://creativecommons.org/licenses/by-nc/4.0/.
Statistics from Altmetric.com
Strengths and limitations of this study
The use of 5-year time periods for comparison of life expectancy changes reduces the influence of year-to-year variation on observations.
Examining long-term trends addresses concerns that recent life expectancy stalling may be over-emphasised due to notably large gains in the immediately preceding period.
The international comparison was limited to the 24 high-income countries for which data were readily available for the relevant period.
Segmented regression provides a means of identifying the timing of a change in the trend.
Background
Mortality rates have steadily declined, and life expectancy has improved, in most high-income countries since 1945.1 2 There have been exceptions to this trend, for example, in Russia and the Baltic states where life expectancy declined steadily from the 1960s, and then fell more dramatically in the 1990s.1 3 Recent reports indicate that mortality improvements have been faltering, or reversing, in the USA, the UK and much of continental Europe, since around 2011.4–7
Since 1950, life expectancy trends in Scotland have followed a trajectory between slower improvements in Eastern Europe and faster improvements in Western Europe.1 Scotland has relatively wide socioeconomic health inequalities and additional premature mortality beyond that expected for the level of deprivation.8 Among the UK countries, Scotland has the lowest life expectancy; 2 years lower for women, and 2.5 years lower for men than England in 2015–2017.9 The causes of the higher mortality and wider health inequalities in Scotland have been summarised as historical vulnerability combined with the changed politics from the 1980s onwards.8 Existing analyses suggest that Scotland has experienced a smaller stalling in life expectancy gains than England and Wales, since 2011, but the scale of this difference, in an international context, is not clear.7
International comparison of changes in life expectancy across a single year (2014 to 2015) found that life expectancy declined in 11 and 12 of 18 high-income countries, for men and women respectively, including the UK.4 However, the short-run trends in mortality data, even at the national level, can vary substantially and observations may therefore be sensitive to the comparison period.10 Comparison of the most recent 6 years to the preceding 6 years found that, of 20 countries, the UK experienced the largest life expectancy slow-down for women and the second largest for men.5 This, however, does not allow identification of which period was exceptional: the previous gains or the current slow- down.
Describing the patterning of recent mortality trends can help to understand the scale of the problem and identify comparator countries or periods to assist in the future investigation of causal hypotheses. There has been an apparent polarisation of the debate regarding causes of recent adverse mortality trends, between explanations emphasising influenza, and those concerned with the impacts of austerity.11–14 This split may, in part, be attributable to studies seeking the answers to different questions (eg, the causes of high numbers of deaths in short periods of time versus stalling of overall life expectancy over a longer period) and in variable comparator, or baseline, periods employed. Cohort effects and interactions between period effects (such as policy changes or infectious disease epidemics) and vulnerabilities within a cohort may also play a role.2 15 Such interactions have been observed for drug-related deaths and those due to suicide and alcohol in Scotland and the USA.16 17 The causal investigation would be strengthened by a clear description of the nature, scale and timing of the phenomenon we are seeking to explain.
This study aims to describe the nature, scale and timing of changes in mortality in Scotland and to compare these to those seen internationally, as an early step in understanding their causes.
Methods
We report our results in accordance with the RECORD guideline.18
Life expectancy: average annual change in 5-year periods
Data on period life expectancy at birth were obtained from the Human Mortality Database (HMD).19 All high-income countries for which there were data available up to 2016 were included (24 of 42 HMD countries included. Excluded countries: No data for 2016: Australia, Belgium, Canada, Chile, Finland, Greece, Ireland, Italy, Luxembourg, New Zealand, Norway, Portugal, Slovenia, Taiwan and Ukraine. Not high-income: Belarus, Bulgaria and Russia). The mean annual change in life expectancy (in weeks) for 5-year periods running back from 2016 to 1992 was calculated for each country (a longer time series was also undertaken for Scotland alone). Two sensitivity analyses were undertaken. First, we recalculated using rolling 5-year time periods rather than set periods from 2016 backwards. Second, we excluded 2015 from the mean change in the last time period (making it 2012–2014 plus 2016). We assessed the relationship between life expectancy in 2011 and mean life expectancy gain in the following 5 years using linear regression. All analyses were undertaken for men and women separately.
Age-standardised mortality rates: segmented regression
Directly age-standardised mortality rates (ASMRs) per 100 000 population for rolling four-quarter periods for Scotland were calculated (using the 2013 European Standard Population (ESP); upper age group 90+years) from quarter 1 (Q1) 1990 to quarter 2 (Q2) 2018 from mortality data held by National Records of Scotland (NRS). The 1990 start date was adopted as an acceptable application of the ESP 2013 and to permit comparison with analyses from England.20 Population estimates were calculated for each four-quarter period by interpolating the mid-year estimates. Data points are labelled by their final quarter, so Q1 2016 represents the mortality rate for 2015 Q2, Q3 and Q4 combined with 2016 Q1. Quarterly rolling rates were used in order to increase the number of data points available to the model.
Segmented regression was undertaken in R using the ‘segmented’ package.21 22 The Davies test assessed the existence and statistical significance of a breakpoint, and the segmented test was used to identify the breakpoint and SE. The results of the segmented test were interpreted as identifying the quarterly data point within which the breakpoint fell. In this way, a result of 2014.374 falls within Q2 of 2014, and the data which correspond to this quarter represent the ‘year’ Q3 2013 to Q2 2014, hence the year to 2014 Q2 is interpreted as the best estimate of when a change in trend occurred. One and two breakpoint models were compared using Akaike Information Criterion (AIC) and Bayesian Information Criterion (BIC) values. Analyses were undertaken separately for men and women and for under 75-year and 75+ year age groups for both sexes, in keeping with the use of the under 75-year age group to calculate premature mortality in the UK.
Patient and public involvement
This research was done without direct patient or public involvement.
Results
Life expectancy trends: 24 high-income countries
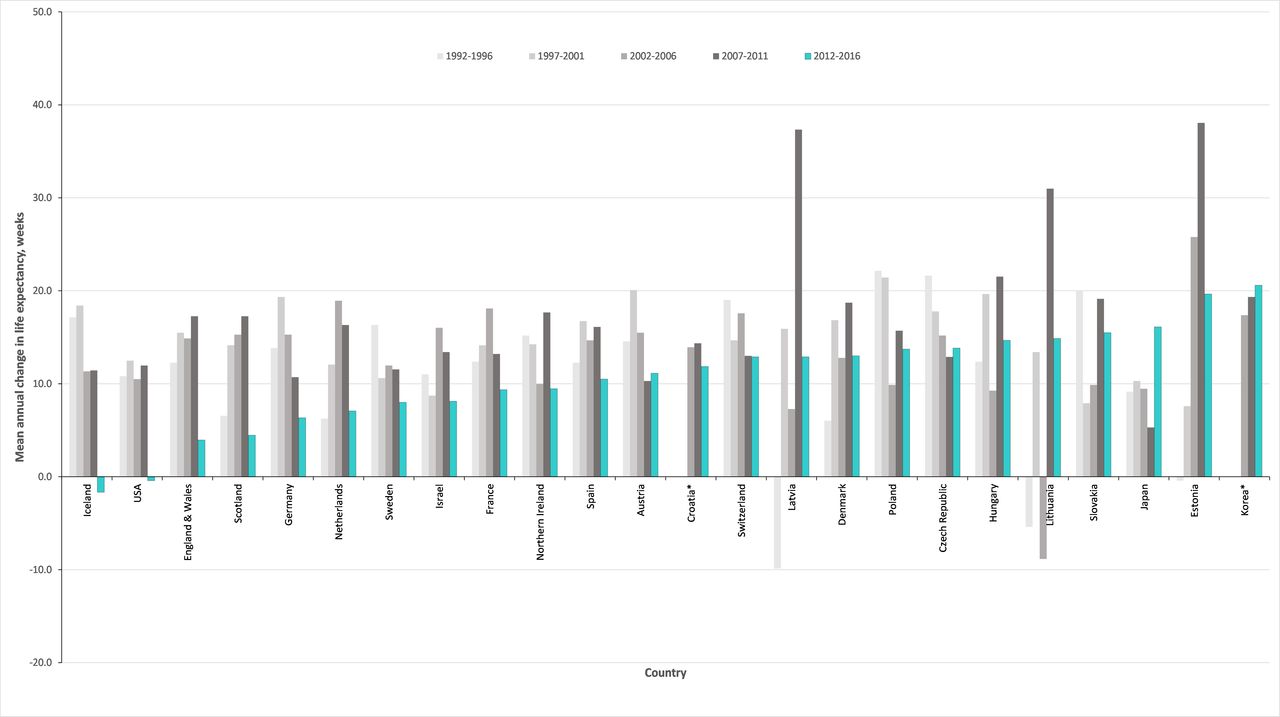
The mean annual changes in life expectancy (in weeks), for all 24 high-income countries with HMD data available to 2016, are shown in figures 1 and 2, for women and men, respectively (data are shown in online supplementary table 1). The countries are ordered on the size of mean life expectancy change in the most recent period. Nearly all countries saw mean increases in life expectancy across all 5-year time periods, with the exceptions being: Northern Ireland (2012–2016), Iceland (1997–2001), Latvia (1992–1996) and Lithuania (2002–2006) among women; and Iceland and USA (2012–2016), Latvia (1992–1996) and Lithuania (1992–1996 and 2002–2006) among men.
Supplemental material
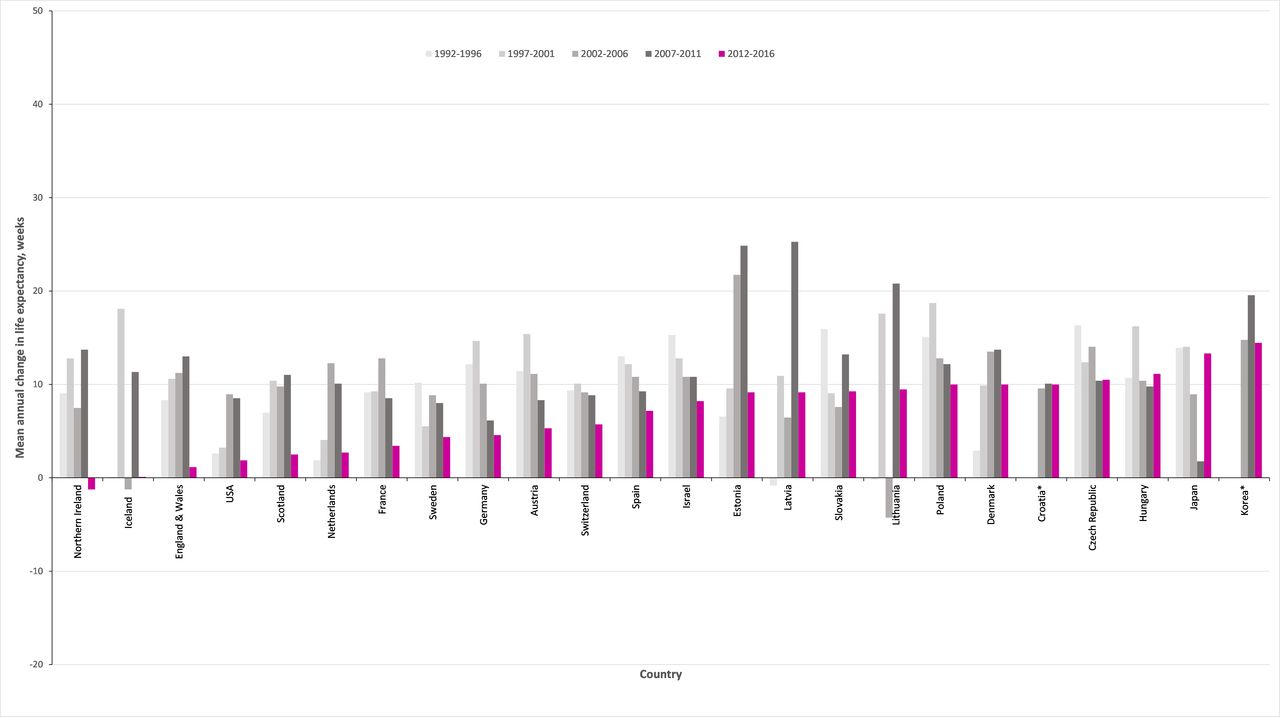
Mean annual change in female life expectancy at birth (weeks), for 5-year periods 1991–2016, by country. Countries are ordered on the size of mean life expectancy change in the most recent period (2012–2016).

Mean annual change in male life expectancy at birth (weeks), for 5-year periods 1991–2016, by country. Countries are ordered on the size of mean life expectancy change in the most recent period (2012–2016).
For the period 2012–2016, the range of mean life expectancy changes was −1.3 weeks/year to +14.5 weeks/year for women (IQR: 3.3 to 10.0 weeks/year) and −1.7 to 20.6 weeks/year (IQR: 7.8 to 14.0 weeks/year) for men. Mean gains of <5 weeks/year were seen in nine countries for women, and four countries for men. Gains of 10 weeks/year or more were seen in four countries for women, and 14 countries for men (online supplementary table 1). For both sexes, the mean annual increases were smaller in 2012–2016 than over 2007–2011 for nearly all countries, with Japan a notable exception for both sexes. When 2015 is excluded from the latest time period, the stalling effect is less marked, although the scale of impact of this year varies, and for some countries, notably the USA, this exclusion had little effect (online supplementary figures 1 and 2).
In Scotland over the period 2012–2016, mean life expectancy improvements of 2.5 weeks/year for women and 4.5 weeks/year for men were observed. This represents the smallest average annual increase for women since 1937–1941, and for men since 1972–1976 (see the online supplementary figure 3). A sensitivity analysis (online supplementary figure 4) using rolling 5-year periods identifies similar periods of slow life expectancy gain, showing results are not dependent on the selection of particular start and finish years.
Supplemental material
Supplemental material
The relationship between starting life expectancy in 2011 and subsequent mean annual change in life expectancy (in weeks) from 2012 to 2016 is shown in figure 3, for men and women separately, and for each of the countries considered. This indicates that subsequent life expectancy gains tended to be slightly smaller in countries that had higher life expectancies in 2011, but this relationship is very weak, especially for women, where the R-squared value is 0.05.

Life expectancy in 2011 (years) and mean change in life expectancy 2012–2016 (weeks), for 24 high-income countries, by sex.
Segmented regression: Scotland
Rolling, four-quarter, ASMRs, by sex, for Scotland for all ages from 1990 Q1 to 2018 Q2, are shown in figure 4. Over the whole period, the ASMR per 100 000 population fell from 2114 to 1355 for men and from 1386 to 1025 for women. The steadiest period of decline in mortality rates appeared to be from 2004 to around 2011, with the periods before and after this showing greater variation.

Age-standardised rolling four-quarterly mortality rates for men and women in Scotland, with segmented regression models fitted, 1990–2018.
As shown in table 1, the Davies test identified a statistically significant change in trend (p<0.01) for men and women, and both age groups. For all groups, the breakpoint identified by the Davies test fell within the period 2012–2014. The date estimates from the one-break segmented model corresponded to those identified by the Davies test for all groups, to within 0.2 years. One-break and two-break models were run for all groups; both AIC and BIC were lower for all two-break models, indicating that these are a better fit.
Summary of results of segmented regression by population group and model/test
The two-break model for all ages indicated the first breakpoint as the year to 1993 Q4 for both men (95% CI: year to 1992 Q4 to year to 1994 Q4) and women (95% CI: year to 1992 Q1 to year to 1995 Q2). A second breakpoint for men was identified as the year to 2012 Q4 (95% CI: year to 2012 Q1 to year to 2013 Q3), and for women as the year to 2014 Q2 (95% CI: year to 2013 Q2 to year to 2015 Q2). The models are shown in figure 4; the break in 1993 indicates a change from a period of slower mortality improvement to a period of faster improvement and the later breaks in 2012 (men) and 2014 (women) indicate a change to much slower gains.
Among all age groups, a later breakpoint changing to slower improvements was identified within the period year to 2012 Q4 and year to 2014 Q2, with the earliest being men aged under 75 years, and the latest women aged under 75 years. Full age-group results are shown in table 1.
Discussion
Principal findings
Of the 24 high-income countries for which data were available, nearly all had smaller life expectancy gains in 2012–2016 than in the preceding 5-year period. Japan and Korea are notable exceptions; in Japan, there was a substantial slow down in life expectancy gains in the period 2007–2011 (almost certainly explained by the 18 000 direct deaths from the 2011 earthquake and tsunami),23 followed by a resumption of gains at the level previously seen.
Among the countries with a stalling of life expectancy gains in 2012–2016, there is a large variation in the mean change observed and in the scale of the difference between periods. Iceland, the USA, England and Wales, Scotland, and, for women, Northern Ireland, had the smallest gains in 2012–2016 and the most marked stalling. In general, the countries of Western Europe saw smaller gains in 2012–2016, with some degree of slow down, compared with countries of Eastern Europe, where steadier gains have been maintained. Denmark is notable for having maintained mean life expectancy gains of around 10 weeks/year among women across the period 1997–2016, and even greater gains among men. In Scotland, the life expectancy gains between 2012 and 2016 are among the smallest seen since the 1970s.
Scotland has had marked stalling in spite of a comparatively low life expectancy in 2011, and there is a generally weak relationship between life expectancy and mean life expectancy gains internationally. This suggests that recent adverse mortality trends are not due to any ‘natural’ long-term tendency for life expectancy gains to slow down in high-income countries.
The two-break segmented regression model of Scottish mortality rates indicates that mortality trends changed to a pattern of more rapid improvement for both men and women in the year to 1993 Q4. In the year to 2012 Q4 for men, and the year to 2014 Q2 for women, the trend in mortality rates changes again, with an increase in mortality thereafter. For all the models and groups tested, a negative turning point in mortality rates was consistently identified within the period 2011 to 2015.
Strengths and weaknesses
Using life expectancy and ASMRs ensured that our analyses were not prone to confounding by changes in the age structure of the population. We used all-cause mortality rates, thus avoiding difficulties due to competing causes of death and coding uncertainties. We performed sensitivity analyses on the periodisation of the average gain in life expectancy comparisons to identify the potential for the findings to be affected by the selection of a particular start date for the analyses.
While other studies have focused on changes in mortality between single years (particularly 2014–2015), we were explicit in seeking to describe the longer-term mortality trends, and therefore, employed 5-year time periods for comparison to reduce the influence of year-to-year variation on observations. By extending life expectancy gain comparisons back over a longer time period, we have sought to address concerns that the stalling of life expectancy in the most recent period may be overemphasised due to notably large gains in the immediately preceding period. Our results using a longer time period show that such concerns are unfounded.
The use of life expectancy estimates from the HMD allowed international comparison; for Scotland, these single-year data differ slightly from life expectancy estimates of NRS which use 3-year averages. The international analysis is limited to the range of countries for which data were available through the HMD. We adopted the broad inclusion criteria of data availability and income level, in order to avoid any selection bias, and did not group or ascribe mortality characteristics to countries in advance of analysis. Thus, several countries of Eastern Europe were included, which experienced a well-described decline and then recovery in life expectancy from the early 1990s.24 It is possible that some of the recent faster improvements in Eastern Europe may be due to ‘catch-up’ following the ending of negative exposure, however, it is also instructive to find that these countries seem to be less affected by the recent stalling.
The segmented regression analysis was limited to Scotland, as we did not have access to equivalent mortality data for other countries. We acknowledge that the confidence intervals presented for segmented regression may underestimate the true uncertainty, as the nature of the rolling quarterly mortality rates means that the data points are not discrete.
How this fits
Our overall findings are consistent with those of others, and the recent stalling of life expectancy gains across many high-income countries is now well recognised.4–6 Other analyses have emphasised the reduction in mortality improvements relative to those seen in the immediately preceding period.4 5 We have shown that relatively large life expectancy gains were seen for both men and women in Scotland in the preceding 15 years (1997–2011), but that even before this gains as small as those seen recently have not been observed since at least the early 1970s. A comparison of mortality trends within the UK suggests that the stalling seen in Scotland is not as severe as that seen in England and Wales.7 Our findings confirm this, but allow us to place this difference within a wider international context which shows that the changes seen in Scotland are still more severe than those observed in many other high-income countries, and are particularly concerning given the higher starting levels of mortality. The timing of a change in overall mortality trends found in this analysis is broadly consistent with that observed in England, where a breakpoint for women was found in the year to 2014 Q2, and the year to 2012 Q1 for men.20
The recent slowdown in improving life expectancies in Scotland follows decades of relative health disadvantage in Scotland compared with other affluent countries. A comparison of age-specific mortality rates over time in Scotland compared with England and Wales found a growing disadvantage in mortality in younger working age since the 1980s, disproportionately affecting men, as well as persistent disadvantages at older ages, disproportionately affecting women.25 Increased rates and inequalities in suicide and drug-related deaths have been observed in young adults, and patterns of cause-specific death by age and year indicative of a cohort effect, with elevated hazards for cohorts who entered the labour market after the ‘neoliberal’ labour market reforms of the 1980s than for earlier cohorts, suggesting political economy as an underlying explanatory factor.26 High rates of alcohol-related deaths and steep socioeconomic gradients also emerged over the 1990s and 2000s, affecting slightly older working ages. Scotland also has relatively high rates of deaths from circulatory disease in older ages, though trends in ischaemic heart disease have been improving since the early 1990s.27
The greatest contributions to the recent changes in life expectancy are due to worsening rates of drug-related deaths, sharp slowdowns in improvements in circulatory diseases, and rising rates of deaths attributed to dementias and Alzheimer disease.28
Meaning: explanations and implications
Various hypotheses have been proposed to explain recent adverse trends, in particular, the period effects of influenza and of economic austerity, and cohort effects, such as the mortality risk of cohorts with a high prevalence of obesity. Many of these hypotheses are not mutually exclusive, but that does not mean that all the factors suggested are causal or have the same importance. It is possible that influenza and political economy explanations are both causal, with interactions between population vulnerability, social and healthcare pressures, and influenza. It seems likely that factors common to all of the countries displaying similar trends, and absent in countries without the change in trend, are causal and also likely that several factors acting together are relevant to explaining the trends.
The global financial crisis of 2008 led to a marked economic recession in many countries and given that unemployment and income are important determinants of health,29 the potential for the crisis to adversely impact on mortality was highlighted early.30 However, the evidence around the impact of economic recession on health and mortality of populations, rather than individuals, is complex and contested.31 The response to the financial crisis, across many countries, was to implement a range of austerity policies whereby public spending was reduced in the pursuit of balanced budgets. As a result, many public services experienced substantial reductions in their budgets and public sector wages and income transfers to lower-income groups were frequently reduced in real terms. There is good evidence now available that this impacted negatively on mortality rates and self-rated health.32–34 It seems less plausible that the trends can be explained as a natural limit to life expectancy, since there is continued improvement in some of the countries with the highest life expectancies, such as Japan.35
Unanswered questions and further research
Further descriptive work is required on the contribution of different causes of death, age-specific components and inequalities to the trends in Scotland. We also need to understand the degree to which the relatively rapid improvements across the UK during the late 1990s and 2000s were unusual. Work to understand the theoretical interaction of different hypothesised causes, and to test these theories is urgently required.
Conclusions
Between 2012 and 2016 the rate of improvement in mortality markedly slowed across many high-income countries, and particularly in England & Wales, the USA, Scotland, Iceland and Northern Ireland. The timing of the change in mortality trend in Scotland for all ages is estimated for men in the year to 2012 Q4 and for women in the year to 2014 Q2. Further research is required to test the range of theories for the causes of these trends, but in the meantime, governments at all levels should take action to ensure effective public services, adequate incomes, health and social care services and influenza vaccination programmes are in place.
Supplemental material
Supplemental material
References
Footnotes
Twitter @FentonLynda, @JonMinton
Contributors LF and GM: conceived the idea for this study. LF and JM: undertook the analyses. JR and MK-B: provided data for the segmented regression analysis. GM: drafted the manuscript. CF and GMAW: along with all other authors made substantial contributions to the interpretation of results and editing the manuscript, and all approved the final draft.
Funding The authors have not declared a specific grant for this research from any funding agency in the public, commercial or not-for-profit sectors
Competing interests None declared.
Patient consent for publication Not required.
Ethics approval No new data were collected in this study and there was no public or patient involvement. We used mortality data made available to us by National Records of Scotland and adhered to our standard procedures to protect against disclosure.
Provenance and peer review Not commissioned; externally peer reviewed.
Data availability statement Data are available in a public, open access repository. Data are available upon reasonable request.