Article Text

Abstract
Introduction Mortality rates in many high-income countries have changed from their long-term trends since around 2011. This paper sets out a protocol for testing the extent to which economic austerity can explain the variance in recent mortality trends across high-income countries.
Methods and analysis This is an ecological natural experiment study, which will use regression adjustment to account for differences in exposure, outcomes and confounding. All high-income countries with available data will be included in the sample. The timing of any changes in the trends for four measures of austerity (the Alesina-Ardagna Fiscal Index, real per capita government expenditure, public social spending and the cyclically adjusted primary balance) will be identified and the cumulative difference in exposure to these measures thereafter will be calculated. These will be regressed against the difference in the mean annual change in life expectancy, mortality rates and lifespan variation compared with the previous trends, with an initial lag of 2 years after the identified change point in the exposure measure. The role of underemployment and individual incomes as outcomes in their own right and as mediating any relationship between austerity and mortality will also be considered. Sensitivity analyses varying the lag period to 0 and 5 years, and adjusting for recession, will be undertaken.
Ethics and dissemination All of the data used for this study are publicly available, aggregated datasets with no individuals identifiable. There is, therefore, no requirement for ethical committee approval for the study. The study will be lodged within the National Health Service research governance system. All results of the study will be published following sharing with partner agencies. No new datasets will be created as part of this work for deposition or curation.
- international health services
- epidemiology
- public health
- statistics & research methods
This is an open access article distributed in accordance with the Creative Commons Attribution Non Commercial (CC BY-NC 4.0) license, which permits others to distribute, remix, adapt, build upon this work non-commercially, and license their derivative works on different terms, provided the original work is properly cited, appropriate credit is given, any changes made indicated, and the use is non-commercial. See: http://creativecommons.org/licenses/by-nc/4.0/.
Statistics from Altmetric.com
Strengths and limitations of this study
The available studies considering the impact of austerity on mortality trends either do not consider the post-2014 period or have weak designs.
We propose a theory-led and comprehensive approach to understanding the impact of austerity on recent mortality trends across high-income countries.
The hypotheses, data, populations and analyses are all specified in advance to avoid selective publication or post hoc rationalisation.
This approach uses ecological rather than individual-level data and is thus unable to assess individual exposure–outcome relationships. There are also a limited number of units of analysis (countries) available which restricts the number of measures that can be included in the modelling.
Background
Description of the problem
The long-run improvement in all-cause mortality rates across most high-income countries has recently changed such that the rate of improvement has either slowed or reversed.1–7 Between 2012 and 2016 (inclusive) for women, an average annual decrease in life expectancy occurred in Northern Ireland of 1.2 weeks per year; and the rate of increase (in weeks of life expectancy per year) slowed to 0.1 in Iceland, 1.1 in England and Wales, 1.9 in the USA, 2.5 in Scotland and 2.7 in the Netherlands, from 8 to 12 weeks per year in the previous 5-year period. Among men, the slowdown was even more dramatic, from 10 to 17 weeks per year between 2007 and 2011 to a decline of 1.7 and 0.4 in Iceland and the USA respectively, and increases of only 4.0 in England and Wales, 4.5 in Scotland and 7.1 weeks per year in the Netherlands.6 However, the change in life expectancy was not ubiquitous across all high-income countries, with continuing increases in Poland, Denmark, Czech Republic, Switzerland, Korea and Japan.6There is also evidence that socioeconomic inequalities in health have increased in many countries over this time period.8 9
In the UK, the recent slowdown in life expectancy improvement was accompanied by changes in mortality rates across almost all age groups and causes of death.3 4 The greatest contributions to the change in trend were the very substantial slowdown in the rate of improvement in cardiovascular mortality rates for those aged 55–85 years, a marked increase in drug-related deaths for those aged 35–54 years, and an increased mortality rate from dementias for those aged over 90+ years.3 4 In the USA, the trends are driven by increased mortality rates among white non-Hispanics aged 25–64 years from ‘deaths of despair’ (drug-related deaths, alcohol-related deaths and suicides).10
The substantial slowdown, or even reversal, in the rate of improvement in life expectancies across affected high-income countries is the most urgent and important public health problem of our time.6 9 This paper sets out the protocol for the investigation of the role of austerity policies (ie, the pursuit of short-run government budget balance11 in explaining the changed trend in mortality rates among high-income countries after 2008).
Hypothesis
There have been many hypotheses proposed to explain the recent changes in the mortality rate trends.12 The artefact and migration hypotheses have subsequently been shown to be very unlikely explanations.7 The suggestions that this may be due to a natural limit to lifespan being reached is implausible given that: mortality rates have changed across age groups and not just for the oldest; the trends are worst among the poorest groups who already have lower life expectancy; and the countries with the highest life expectancy such as Japan have not experienced a changed trend. More plausible explanations include: cohort effects in the population from historical exposures13–15; influenza, of which there were particularly severe outbreaks in 2015 and 2018; obesity, which has increased across many high-income countries over the last 25 years and is understood to be associated with higher mortality rates16; increased social isolation17 and mental health problems,2 12 18 both of which may be mechanisms linking recession and austerity to mortality. A fuller discussion of the literature on these hypotheses is provided in online supplementary file 1.
Supplemental material
Recession and austerity
The financial crash of 2007–2008, the resulting ‘great recession’, and the implementation of a variety of economic policy responses (including implementation of a fiscal stimulus in many countries up until around 2010, and subsequently ‘austerity’19 preceded the current change in mortality rate trends and have been suggested as the direct or indirect causes of the recent trends.1 8 20–22
Austerity is an ambiguous term, which has only been applied in economic and policy discourse since the 1950s.23 Austerity is associated with fiscal consolidation or retrenchment, that is, cuts in expenditure and/or increases in taxation. That said, some economists, such as Wren-Lewis,19 argue that austerity is a particular form of fiscal consolidation which leads to a ‘noticeably larger output gap’ that implies increases in involuntary unemployment and counteracts automatic stabilisers. Thus, for Wren-Lewis, fiscal consolidation needs not imply austerity, it becomes a question of degree and indeed timing. For example, fiscal consolidation during a period of sustained economic growth represents sound Keynesian demand management in that it is countercyclical and not austerity in the sense used by Wren-Lewis. By contrast, fiscal consolidation applied during a downturn or recession is austerity in that it is likely to further deflate demand, although there are those who dissent from this argument (eg, Alesina and Perotti).24 Thus, for us, austerity refers to the suite of policies associated with discretionary fiscal consolidation that acts procyclically. Austerity may be employed for a number of reasons, including a belief that it reduces government deficits, or is a mechanism for correcting past conditions.23
As noted above, some aspects of public spending can increase, even when a government is otherwise committed to an austerity agenda, through the ‘automatic stabilisers’ within the economy, such as increased spending on unemployment benefits due to an increase in the number of unemployment claimants. Indeed, reducing the spending on such ‘automatic stabilisers’ can be an objective of austerity policies. In the recent period, most high-income countries pursuing austerity have focused on reducing public spending, rather than increases in taxes.25 As a result these UK policies have tended to impact most on lower income groups.26
The evidence on the impact of economic recession on health and mortality of populations, rather than individuals, is complex and not necessarily negative overall.27–29 There are several mechanisms through which economic downturns may impact health. Decreased household and individual incomes can limit the consumption of a range of goods and services that both support health and which can damage health (eg, alcohol).30 31 Increased unemployment (as well as underemployment and poor quality work) is well evidenced to be causally related to increased mortality rates in the subsequent 10 years.32
The government response to recession is also important for health.29 In the UK, there have been substantial real-terms reductions in the value of many social security benefits (particularly for those of working age) and new restrictions on the eligibility and conditionality for receiving those benefits.2 18 33 There have also been very substantial reductions in local government funding,34 with greater reductions in England than in Scotland or Wales.35 This impacts on a wide range of services, including education, leisure, housing and some support services for those with particular needs (eg, disabilities or substance misuse issues). A particular impact on health has been proposed through the reduction in the budget available to provide social care services, something that is largely delivered to the elderly either living at home or in residential accommodation.33 36 It has been suggested that in the UK this meant that fewer people could be adequately cared for outside the National Health Service (NHS), leading to lower quality care and increased demand on hospital services. Areas with the largest reductions in spending in England had the greatest mortality rate increases.22 33 37
Although there are a number of distinct hypotheses that may explain the recent trends, each of which may play a substantial, moderate, minimal or no causal role, it is important to recognise that several may interact as part of the same causal pathway and may exacerbate the impact of each another (figure 1). It is also possible that the impact of any single factor may be dependent on the presence or absence of another.38 Thus, if this study was to find evidence for or against a role for austerity, this does not preclude a role for other factors.
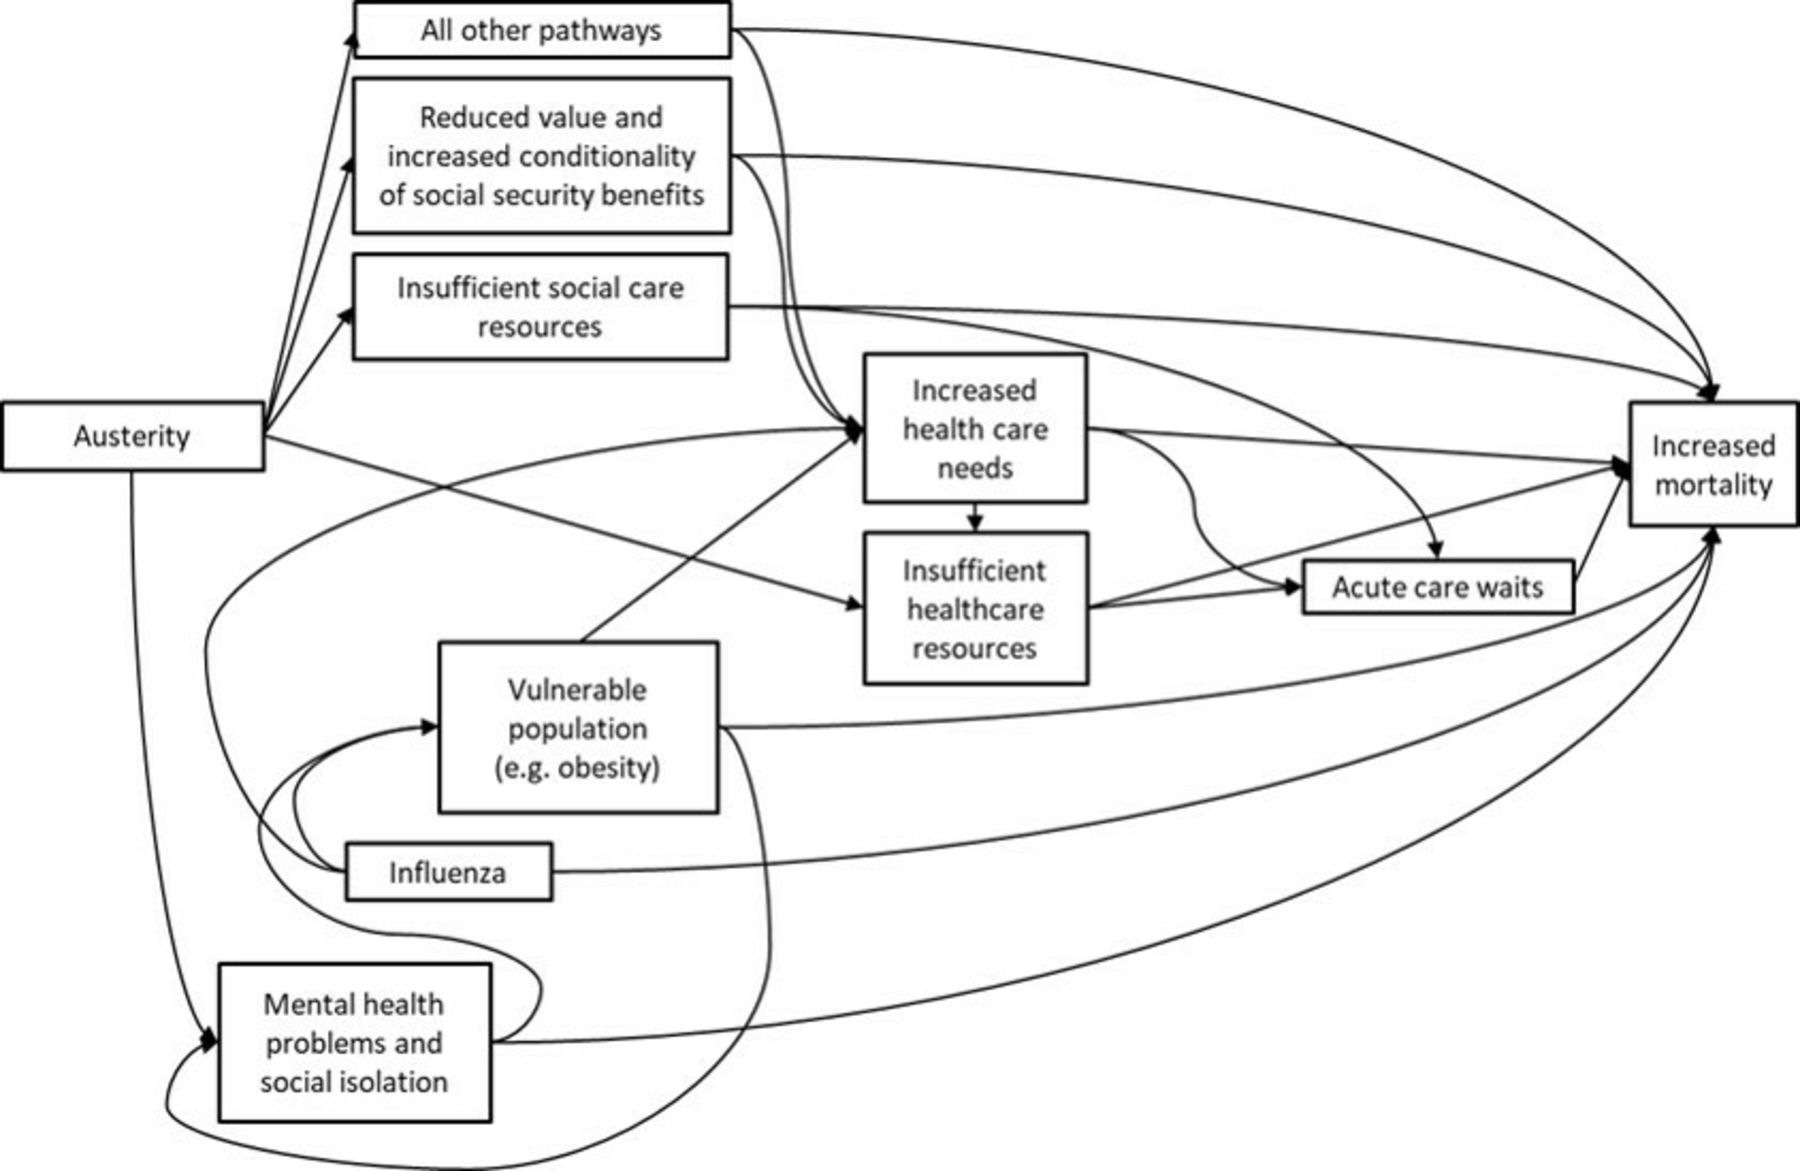
Some potential ways in which the different hypotheses may be related.
This study will test the hypothesis that the pursuit of austerity policies (measured in different ways) impacted negatively on a range of mortality outcomes, and on household incomes and underemployment relative to populations that experienced a different policy approach.
Limitations of existing research
The difference between exploratory research and causal research, and the risks of conflating the two, have been clearly described.39 A causal approach needs to avoid the risks that can arise from multiple testing within a large dataset in the absence of a clear hypothesis, selective reporting of outcomes or subpopulations, picking particular analytical approaches or baseline time periods without good justification which biases in favour of particular outcomes, or publication bias towards findings that are more interesting or which confirm pre-existing beliefs. There are also risks when different approaches to the data and analysis yield divergent results. For example, this can occur when the choice of using shorter or longer time periods to compare before and after a change in exposure, or where there are options for which comparison populations to use. There are also risks relating to how data are presented and the extent to which a change in outcomes might be (de)contextualised from its pre-existing degree of variability.
There is a lack of clear preanalysis research protocols being published in this area to protect against selective publication or altered analysis approaches after initial work. The risks of this approach are reflected within the current literature examining the causes of the recent slowdown in the improvement of mortality rates. Several studies have suggested that the ‘great recession’ (ie, the post-2008 economic downturn which occurred across many high-income countries following the financial crash) has been associated with negative health outcomes such as suicide, mental health problems and mortality.40 However, many of these studies have been reliant on very unstable and short baseline periods,41–43 or have been at risk of analysing only selected outcomes (eg, only for men).44 The choice of the baseline period is also very important in determining the magnitude of the recent change in trends, not least because of a period of relatively fast improvement during the late 1990s and early 2000s.2 45
Where decisions about which data to use, over what time series, with which comparisons and statistical approaches, can change the results (and implications for policy and practice), it is important to be clear on the rationale for those decisions to ensure that they adopt the most robust means of addressing the research question and are at the lowest risk of error, bias and confounding. Frequently, a lack of good data measuring relevant exposures and outcomes for the populations of interest necessitate pragmatic decisions on the methods adopted, but the extent to which pragmatism has driven research decision making is not often clear.
To avoid these problems in this area of research, and particularly because of the politicised nature of the implications of findings in this area, we feel that it is important to publish a protocol for this programme of work prior to the analysis commencing. This is in line with recent recommendations for the conduct of observational research.46
Summary of what is known about the causes of the problem
Several reviews have been published on the impact of austerity and recessions on mortality.2 27 29 40 47–55 In general, recessions are found to have negative health impacts for some specific outcomes, but not for overall mortality rates; austerity has negative impacts for both specific and overall outcomes. Although there are studies of the impact of historical periods of austerity, particularly in the UK context,56–58 we have identified only four studies specifically considering austerity (rather than recession) in the post-2010 period (table 1). These do associate greater austerity with relatively high mortality rates, although none use data beyond 2014.
Empirical literature relating overall austerity measures and health outcomes
Description of the theory that is to be tested
This study will test the relationships laid out in figure 2. Changing national incomes, the key indicator of recession, is both a causal factor in government public spending decisions and a result of government public spending decisions. For example, there has been substantial debate about whether the pursuit of austerity causes prolonged economic recessions.59 60 However, others have argued that reducing government debt, through austerity, is important to increase economic growth.61 Including gross domestic product (GDP) as a means of adjusting for recessionary effects risks overadjustment of the austerity–health relationship because of the potential for austerity to impact on GDP. To minimise this potential overadjustment, the length of economic downturn will not be included as a variable. Instead, only the percentage change between the peak and trough in GDP per capita for the economic downturn which began around 2008 will be used as a means of adjusting for the scale of the initial recessionary effect. Similarly, because there are pathways between the recession measure and underemployment, and between austerity and underemployment, adjustment for unemployment risks confusing the effects of austerity and recession. The approach to how these are to be handled is discussed further below.

Theory to be tested linking austerity and mortality outcomes. *These variables are either exposures or unmeasured variables depending on the analysis.
The other factors in the theory are more clearly linked in a causal direction in the short to medium run. Public spending (overall, on public service provision generally and on specific public services, and spending not on debt repayments), social security policy and personal taxation are all relevant policy decisions that form the overall approach that can be described as more or less orientated towards austerity. Most of these factors have both direct and indirect impacts on mortality outcomes, many through the important mediators of unemployment, wages and household incomes, but also through the changes in the provision of particular public services which could be expected to act differentially on particular population subgroups.25 The variation in the nature of austerity programmes (eg, those which might increase taxes on richer or poorer groups, or might cut spending on universal or targeted public services, or those which impact on social security payments differentially by age) might be expected to have different impacts on mortality trends overall, and for specific population groups. However, this more detailed work is outwith the scope of this project, particularly because of limitations in the availability of comparable data. We are also focused here on mortality outcomes as an easily measurable outcome, but that is not to downplay the importance of other measures of health.62
Methods
Austerity
This protocol is published in order to fulfil the best practice in observational epidemiological research as detailed in the Strengthening the Reporting of Observational Studies in Epidemiology statement.63 The data gathering, analysis, interpretation and write-up for the study will be undertaken between October 2019 and October 2020.
Aim
To measure the contribution of austerity policies to the change in life expectancy and mortality rate trends after 2008 across high-income countries.
Hypotheses
The research questions, null and alternative hypotheses to be tested in this work are detailed in table 2.
Research questions, null and alternative hypotheses
Design
As we cannot manipulate the exposure to austerity, an observational, ecological, ‘natural experiment’ study design will be adopted. As the exposure in this case across countries is a continuous rather than binary variable a family of regression models using the country as the unit of analysis.64 More specifically, a fixed-effects panel model to reduce unmeasured (but relatively stable) confounding due to pre-existing differences between countries (eg, welfare state type) will be used.
Populations and settings
The sample frame for the study is the total populations of UN-defined high-income countries, with subgroup analyses for men, women and specific age groups (<1 year, 1–14 years, 15–29 years, 30–49 years, 50–69 years and 70+ years).
Exposures
The exposures of interest are listed in table 3, detailing the exposure for the primary analysis and the exposures for the sensitivity analyses. Identification of the timing of the start of the austerity period for each country will be undertaken by fitting a segmented regression model in R (using the ‘segmented’ package) to identify the first turning point after 2007 using a time series from 1987 (to provide a minimum 20-year baseline period) to the latest data point available. This year will then become the point from which the change in exposures and outcomes will be measured. An initial 2-year lag between the exposure and outcome will be used, and will be varied to 0 years (ie, simultaneous change) and to 5 years as sensitivity analyses. Those countries for which no turning point in the trend is identified for the period after 2007 will be allocated the median year of austerity starting from those countries in which a change was detected.
Data definitions and sources
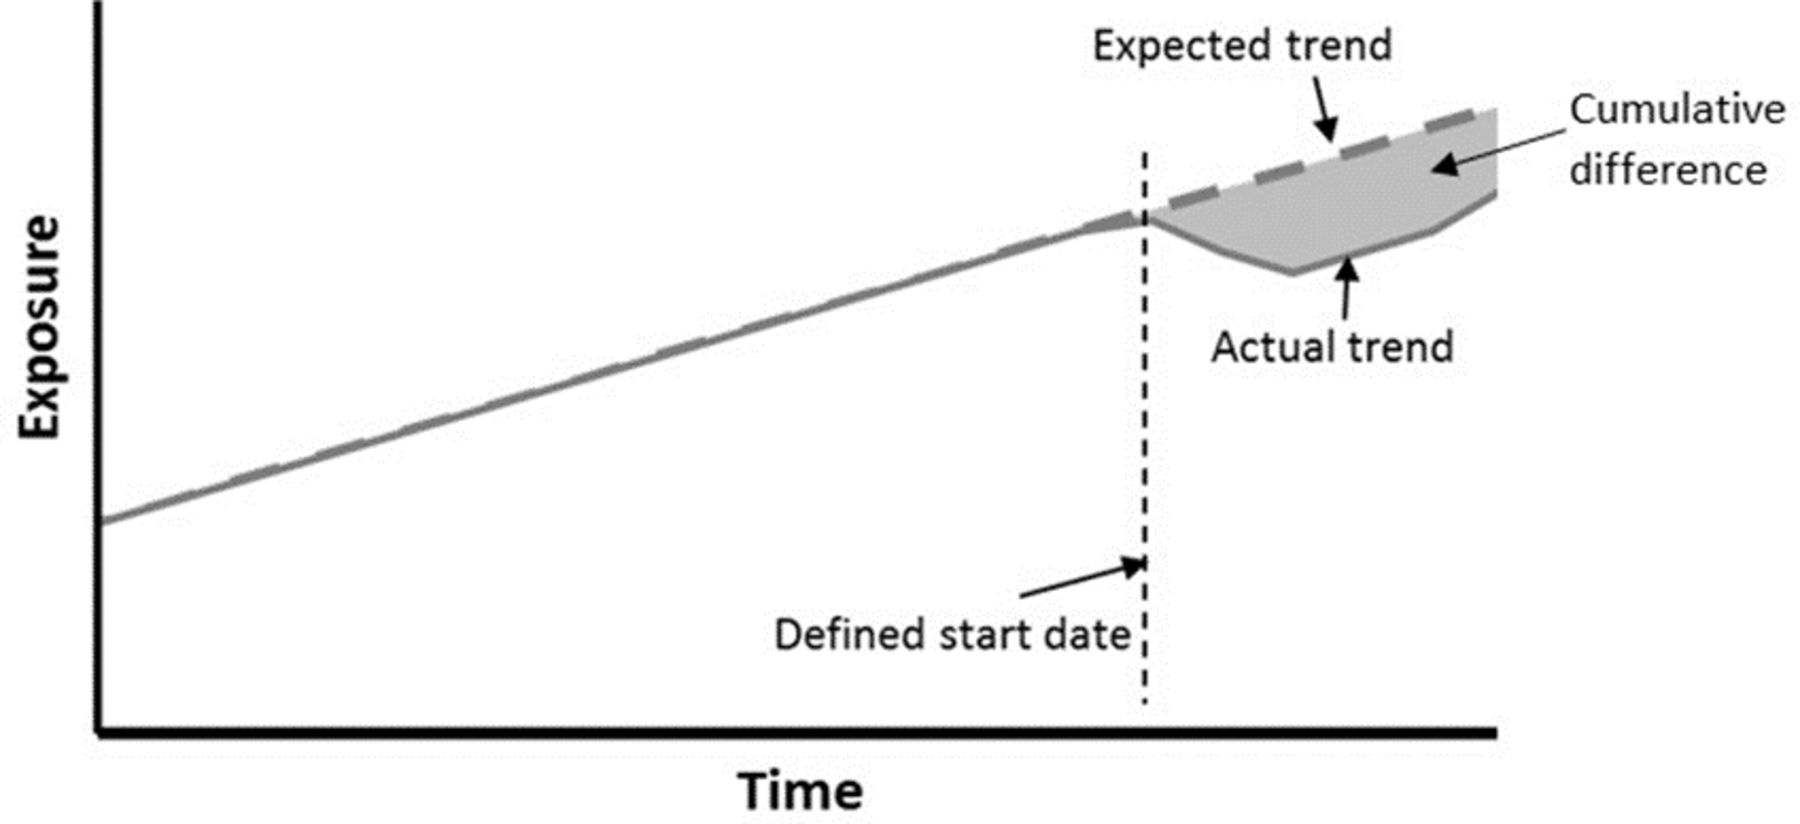
For each of the austerity measures and the recession measure, the cumulative difference from the previous trend will be calculated and used as the exposure measure, as indicated in figure 3.
Measuring the change in exposure after the turning point.
Outcomes
Each of the outcome measures detailed in table 3 will be calculated from a start point 2 years after the year in which a change in exposure occurs (see the analytical approach below for the identification of that year) until the latest available year. All of the outcome data will be calculated as the mean annual change from the previous trends, to ensure comparability across countries which have differing availability of data after the start of the exposure period and to take into account the potential for differing rates of improvement prior to the recent period. The percentage and absolute mean annual change in the outcomes will be calculated.
As means of approximating the mediation of any effects of underemployment and incomes the models will be adjusted for both variables. Finally, the models will be adjusted for real GDP per capita to ascertain the impact of austerity after accounting for the economic downturn, although this will be interpreted cautiously, as austerity may have negative impacts on GDP and thereby represent reverse causality in the relationship.
Patient and public involvement
Due to the secondary use of data and the absence of patient risks, no patients or members of the public were involved in the study.
Analytical approach
As the data are observational and reflect a ‘natural experiment’ with continuous exposure and outcome variables, a family of fixed-effects regression models will be used to estimate the relationship between the exposures and outcomes.
The first step of the analysis will be a simple descriptive characterisation of the trends in austerity, recession and outcome measures across nations. This will involve simple graphing of the trends over time and comparisons of these trends in exposures across countries to highlight those countries that experienced more or less austerity, the timing of such policies, and the length of the exposure; the extent and timing of recession across countries and trends in the outcome measures.
Before regression models are fitted, scatterplots of each of the exposures and outcome measures will be plotted to check for spurious or non-linear associations. Any change in the trends after 2007 in the exposure measures will then be identified by fitting a segmented regression model, and this will provide the start year for the austerity period. The full list of regression models to be run, including the sensitivity analyses, are shown in table 4. Poisson or negative binomial models will be fitted as appropriate. We will additionally explore whether or not it is possible to test for interactions between the exposure variables.
Regression models to be fitted
Ethics and dissemination
All of the data used for this study are publicly available, aggregated datasets with no individuals identifiable. There is therefore no requirement for ethical committee approval for the study. The study will be lodged within the NHS Health Scotland research governance system (which, over the course of the study will be amalgamated into the Public Health Scotland research governance system as part of an organisational change).
All results of the study will be published. Our approach to this will be to share our preliminary results and interpretation with the mortality special interest group administered by the Scottish Public Health Network and sponsored by the Directors of Public Health in Scotland for comment; and then our final paper with colleagues across the other UK public health agencies for information. We will then upload the paper to a prepublication website and submit the paper to a journal for peer review and publication. If no peer review journal is identified that is willing to publish the paper, a final version will be published on www.scotpho.org.uk. The study is due to start in December 2019 and be completed by December 2020 with a paper submitted for publication by this date.
There will not be any new datasets created as part of this work for deposition or curation.
Beyond this analysis, we intend to pursue several other related research questions and approaches, acknowledging the importance of triangulating insights from different methods, especially where those methods do not share the same biases.65 This includes analysis of the impact of austerity within the UK using smaller populations as the unit of analysis, and further analyses at international level using alternative methods.64
References
Footnotes
Twitter @gerrymccartney1, @FentonLynda, @JonMinton
Contributors The planning of this work was undertaken by GM, LF, CF, KL and CH. The manuscript was drafted by GM and received important critical comments from LF, JM, CF, MT, KL, CH, AC, FP and RM. Statistical advice was received from JM and FP. Assistance with the background literature searches was received from LF, JM, MT and RM. The final draft was approved by all authors. The conduct and reporting of the research has not yet been undertaken as this is a protocol.
Funding The authors are salaried within NHS or the University of Glasgow. This work also forms part of a course of PhD study for GM which was part-funded by NHS Health Scotland.
Competing interests None declared.
Patient consent for publication Not required.
Ethics approval All of the data used for this study are publicly available, aggregated datasets with no individuals identifiable. There is therefore no requirement for ethical committee approval for the study.
Provenance and peer review Not commissioned; externally peer reviewed.