Article Text

Abstract
Aims: To examine the dimensionality, internal consistency, and construct validity of a new physical workload questionnaire in employees with musculoskeletal complaints.
Methods: Factor analysis was applied to the responses in three study populations with musculoskeletal disorders (n = 406, 300, and 557) on 26 items related to physical workload. The internal consistency of the resulting subscales was examined. It was hypothesised that physical workload would vary among different occupational groups. The occupations of all subjects were classified into four groups on the basis of expected workload (heavy physical load; long lasting postures and repetitive movements; both; no physical load). Construct validity of the subscales created was tested by comparing the subscale scores among these occupational groups.
Results: The pattern of the factor loadings of items was almost identical for the three study populations. Two interpretable factors were found: items related to heavy physical workload loaded highly on the first factor, and items related to static postures or repetitive work loaded highly on the second factor. The first constructed subscale “heavy physical work” had a Cronbach’s α of 0.92 to 0.93 and the second subscale “long lasting postures and repetitive movements”, of 0.86 to 0.87. Six of eight hypotheses regarding the construct validity of the subscales were confirmed.
Conclusions: The results support the internal structure, internal consistency, and validity of the new physical workload questionnaire. Testing this questionnaire in non-symptomatic employees and comparing its performance with objective assessments of physical workload are important next steps in the validation process.
- BAS, BewegingsApparaat Studie
- DMQ, Dutch musculoskeletal questionnaire
- KANS, Klachten Arm, Neck, and Shoulder
- MID, minimally important difference
- physical workload
- assessment
- questionnaire
- validation
Statistics from Altmetric.com
- BAS, BewegingsApparaat Studie
- DMQ, Dutch musculoskeletal questionnaire
- KANS, Klachten Arm, Neck, and Shoulder
- MID, minimally important difference
Physical workload is thought to be an important cause of musculoskeletal disorders. These are common and often cause disability and sick leave.1–4 There is moderate to strong evidence for a relation between different aspects of physical workload and the occurrence of back, neck, shoulder, and hip pain.5–9
Investigating the contribution of physical workload to musculoskeletal disorders can be done in several ways. In retrospective studies (for example, case–control) or large prospective studies, observation or direct measurements are not usually feasible, so self administered questionnaires are used as an alternative. Although it is not possible to quantify the workload and only crude estimations of the amplitude, frequency, or duration of workload can be made, information collected by questionnaire may be sufficient to rank the physical workload of specific activities, tasks, or jobs.10
Several questionnaires on physical workload have been developed and most of these are composed of various items relating to physical load (for example, posture, manual handling loads, repetitive movements, static load). These items are either summed11 or analysed separately.12–14 Some investigators have divided their questionnaires into several subscales. Wiktorin et al15 developed a 92 item questionnaire for the assessment of physical load during work and leisure time. Thirty three questions concern occupational workload and are divided into six subscales (working postures involving whole or parts of the body, manual material handling, vibration, physical activity, exertion). Pope et al16 developed a self assessment questionnaire measuring physical workload and containing three subscales (working postures, manual handling activities, and repetitive movements of the upper limb). Items in a subscale should measure a single construct, but in none of the studies were the dimensional structure of the questionnaire and the internal consistency of the subscales examined. Only Hildebrandt et al17 applied principal component analysis on a screening instrument to assess musculoskeletal workload and other potential hazardous working conditions. The section “musculoskeletal workload” of their questionnaire has 63 items and is therefore too lengthy to use in large epidemiological studies, in which several questionnaires are employed. A short and simple workload questionnaire would be valuable for assessing physical workload in occupational health care as well as in epidemiological research. Our aim therefore was to create a new questionnaire with fewer items and a shorter administration time.
We created an item pool of questions related to physical workload and applied factor analysis and internal consistency analysis to facilitate item reduction and to study the dimensionality of our questionnaire. Three populations with musculoskeletal complaints were used to determine whether similar factor solutions were present. Finally, the first steps were taken to study the construct validity of the workload questionnaire.
METHODS
Item pool
The items to be included were taken from the Dutch musculoskeletal questionnaire (DMQ) developed by Hildebrandt et al.17 In contrast to other physical workload questionnaires, this one has been studied thoroughly for its dimensionality and validity. The DMQ is a screening instrument that allows global assessment of musculoskeletal workload and other potentially hazardous working conditions by seven indices. The DMQ consists of nine pages with approximately 25 questions per page, with a completion time of approximately 30 minutes. The index “musculoskeletal workload” consists of 63 items. Items selected contained static or unfavourable postures, and movements of the upper or lower extremities. We included items of force, dynamic and static load, repetitive load, (uncomfortable) postures, sitting, standing, and walking. A 26 item pool was composed with response options “seldom or never,” “sometimes,” “often,” and “(almost) always” (see appendix), thereby estimating the frequencies of postures, movements, and tasks. Selection of the items was based on face validity and a discussion among experts during a consensus meeting. Items chosen were expected to have an association with either upper extremity or lower extremity complaints. The score ranges from 0 to 3, with 0 for the first category (that is, seldom or never) and 3 for the last category ((almost) always).
Main messages
-
Although several questionnaires on physical workload exist, the dimensional structure and internal consistency of these questionnaires have not been addressed.
-
Physical workload can be measured with two short subscales: 12 questions related to heavy physical workload and six related to static postures or repetitive work
-
Our study provides evidence supporting the dimensionality, internal consistency, and construct validity of the new physical workload questionnaire tested in employees with musculoskeletal disorders
Data collection
Data were derived from two large prospective cohort studies in general practice in the Netherlands. The musculoskeletal disorders study (BAS) was partly carried out within the framework of the Second Dutch National Survey of General Practice (coordinated by the Netherlands Institute of Primary Health Care (NIVEL)).18 BAS focuses on the prognosis and clinical course of musculoskeletal complaints of the upper and lower extremities in general practice. Details are described elsewhere.19 Data were collected by means of multiple self administered postal questionnaires. The response to the baseline questionnaire was 88% (n = 1200). Subjects were subdivided into a group with musculoskeletal complaints of the neck or upper extremity (BAS-UE) and a group with musculoskeletal complaints of the lower extremity (BAS-LE). For the current study only subjects who reported that they were in paid work were included (n = 706).
Policy implications
-
Physical workload is an important risk factor for musculoskeletal disorders. Our study provides a validated measurement instrument to measure physical workload in symptomatic employees in a relatively easy way. Assessment of physical workload in large occupational populations should be based on validated scales.
The arm, neck, and shoulder study (KANS) in Rotterdam is a two year prospective cohort study in the south west of the Netherlands. It examines the incidence, course, and prognostic factors in people with non-traumatic musculoskeletal complaints of the upper extremity in general practice, using self administered questionnaires. Patients who consulted their GP for new upper extremity symptoms and gave written informed consent were included in the cohort. The response to the baseline questionnaire was 86% (n = 717); 557 of the 717 participants reported that they had paid work.
Both studies used the same questionnaire, although the KANS study included one additional item to the questionnaire “does your work involve adapting your posture because of bad vision.” We did not include this item in the analyses. Only baseline data from both studies were used. The informed consent procedure and protocol of both BAS and KANS were approved by the medical ethics committees of the VU University Medical Centre and the Erasmus MC, University Medical Centre Rotterdam, respectively. Characteristics of the study populations are summarised in table 1.
Descriptive data on the study populations
Factor analysis
Exploratory factor analyses of the responses on physical load at work were conducted using principal component analyses (PCA) with varimax rotation on all three populations separately. Factor analysis is a statistical technique that can be used to analyse interrelations among a large number of items while trying to explain these variables in terms of their common underlying dimensions.20
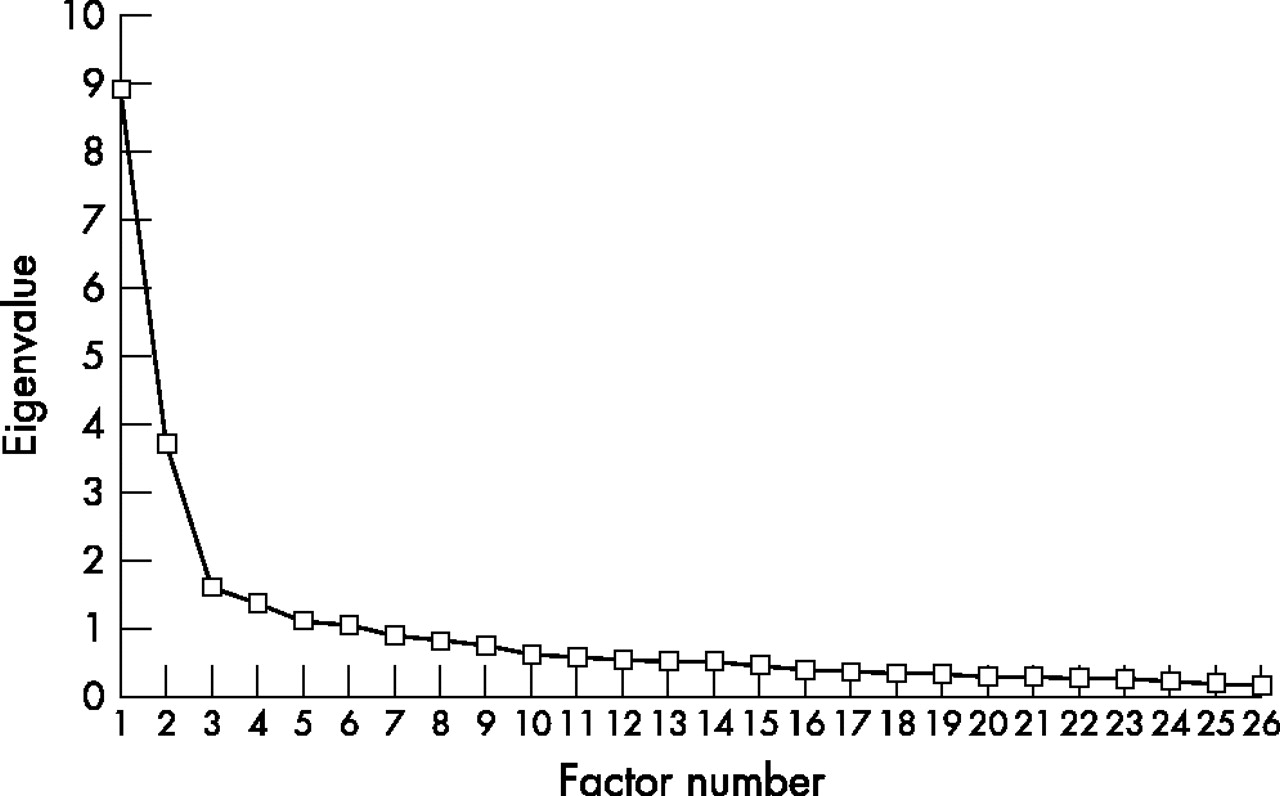
First, we identified the number of meaningful factors based on the Scree test21 and on the interpretation of the factor solutions. Using the Scree plot, we looked for a break between the factors with relatively large eigenvalues and those with smaller eigenvalues. Factors that appeared before the break were assumed to be meaningful, and factors that appeared on the approximately horizontal line after the break were considered to account for only a trivial amount of variance and were therefore not retained.
Second, we looked at the factor structure and factor loadings after varimax rotation. Items with a factor loading less then 0.5 on all factors were excluded. Furthermore, items that loaded on more than one factor were excluded. Each factor should be comprised of at least three items.21
Finally, we carried out a forced two factor analysis on the remaining items. The factor analysis resulted in a two factor structure: “heavy physical workload” (12 items) and “long lasting postures and repetitive movements” (six items).
Internal consistency
Internal consistency is a measure of the homogeneity of a scale. It indicates the extent to which items in a scale are intercorrelated and thus measure the same construct. The internal consistencies of the subscales created were examined using Cronbach’s α. Item-total correlations between individual items and the sum of the remaining items on a factor were calculated. Items with an item-total correlation of 0.40 or less were excluded.
Construct validity and statistical analysis
Validity is the degree to which an instrument measures what it is supposed to measure.22 The BAS study contained a question about the subjects’ occupations. We hypothesised that physical workload would vary among different occupational groups. Validity of the created subscales was assessed by comparing the subscale scores of four occupational groups with substantially different physical workloads. Scoring was done by simply adding up the response to each item, which produced raw scores of from 0 to 36 for the first subscale and 0 to 18 for the second subscale. The final scores were calculated by dividing the raw score by the maximum score, multiplied by 100, resulting in a final score ranging between 0 (no physical workload) and 100 (highest physical workload) for both subscales.
We classified the occupations of all subjects into four groups on the basis of expected physical load:
-
Group 1: no physical load (for example, teacher, hostess)
-
Group 2: both heavy physical load and long lasting postures and repetitive movements (for example, postman, house painter, hairdresser)
-
Group 3: long lasting postures and repetitive movements (for example, administrator, cashier, civil servant)
-
Group 4: heavy physical load (for example, nurse, cleaning lady).
Three investigators (SB, CT, DvdW) made this classification independently. Disagreements between the investigators were discussed and resolved during a consensus meeting. Occupations that could not be classified were grouped as missing (79 and 70 occupations in BAS-UE and BAS-LE, respectively). In all, we were able to classify the occupations of 317 subjects from the BAS-UE population and 212 from the BAS-LE population. Ten subjects from BAS-UE and 12 from BAS-LE did not fill in their occupation.
The following hypotheses were tested to assess construct validity:
-
The mean score on the subscale “heavy physical workload” is higher for the occupational group with heavy physical workload (group 2) than for the occupational group with static postures and repetitive movements (group 3).
-
The mean score on the subscale “heavy physical workload” is higher for the occupational group with heavy physical workload (group 2) than for the occupational group without physical workload (group 1).
-
The mean score on the subscale “long lasting postures and repetitive movements” is higher for the occupational group with static postures and repetitive movements (group 3) than for the occupational group with heavy physical workload (group 2).
-
The mean score on the subscale “long lasting postures and repetitive movements” is higher for the occupational group with static postures and repetitive movements (group 3) than for the occupational group without physical workload (group 1).
-
The mean score on the subscale “heavy physical workload” is higher for the occupational group with both physical heavy and static postures and repetitive movements (group 4) than for the occupational group without physical workload (group 1).
-
The mean score on the subscale “long lasting postures and repetitive movements” is higher for the occupational group with both heavy physical load and static postures and repetitive movements (group 4) than for the occupational group without physical workload (group 1).
-
In the occupational group with heavy physical workload (group 2) the mean score on the subscale “heavy physical workload” is higher than on the subscale “long lasting postures and repetitive movements.”
-
In the occupational group with static postures and repetitive movements (group 3) the mean score on the subscale “long-lasting postures and repetitive movements” is higher than on the subscale “heavy physical workload.”
We tested whether the data showed an approximately normal distribution. We used the independent t test to test the first six hypotheses, and the paired sampled t test to test the last two hypotheses. In case of skewed data the equivalent non-parametric test was used (that is, the Mann–Whitney U test or the Wilcoxon signed rank test). Probability (p) values less than 0.01 were considered significant. All analyses were done using the Statistical Package of Social Sciences, version 10.1 for Windows (SPSS Inc, Chicago, Illinois, USA).
RESULTS
The Scree plot applied to the data of BAS-UE shows a distinct break before factor 3, suggesting that only the first two factors were meaningful enough to be retained (fig 1). The Scree test in the other two population showed similar plots. This indicates that two factors may be adequate to describe the data. This initial solution accounted for 48.7% of the total variance for BAS-UE, 53.2% for BAS-LE, and 49.7% for KANS (table 2).
Factor analyses: factor loadings after varimax rotation

Scree plot of eigenvalues from the 26 item questionnaire applied in the population with upper extremity disorders from the musculoskeletal disorders study (BAS-UE).
Subsequently, we undertook a forced two-factor solution. The rotated factor loadings of these analyses are shown in table 2. The pattern of loadings of items on the factors was almost identical for the three study populations. Examination of the factor loadings showed that the items “prolonged sitting” (b) and “prolonged visual display units (VDU) work” (c) loaded highly negative on the first factor and did not load convincingly on the second factor, and they were therefore excluded. Three items (work with vibrating tools (t), operate peddles with feet (u), and climbing stairs (v)) with a loading less than 0.5 on both factors were excluded. The items twisted posture (g) and uncomfortable postures (s) were excluded because they loaded on both factors with similar loadings. The item “walking on irregular surfaces” (x) had a factor loading of less than 0.4 and an item-total correlation of 0.38 in the BAS-UE. Because this item had factor loadings only slightly above 0.5 in the other two populations, and the total variance explained increased when this item was deleted, we decided to exclude it.
As a result, 18 items remained (12 items factor 1, six items factor 2), which accounted for between 56.6% and 60.6% of the total variance after a forced two factor analysis with varimax rotation (table 3). The items that loaded high on the first factor were related to heavy physical work, and items that loaded high on the second factor were related to static postures or repetitive movements. The factors were labelled as “heavy physical work” and “long lasting postures and repetitive movements”. Item-total correlations and internal consistencies are shown in table 4. Item-total correlation ranged from 0.46 to 0.84. The first subscale “heavy physical work” had a Cronbach’s α of 0.92 to 0.93 and the second subscale “long lasting postures and repetitive movements” of 0.86 to 0.87.
Final factor loadings after a forced two factor solution with varimax rotation and exclusion of items
Item-total correlation and internal consistency
In table 5 the median subscales’ scores and interquartile ranges per occupational group are presented. Eight hypotheses concerning construct validity were tested. For six of the eight hypotheses there was enough evidence to confirm the hypothesis that the mean values were different (p<0.0001). Although the occupational group with long lasting postures and repetitive movements (group 3) scored higher on the subscale “long lasting postures and repetitive movements” than the occupational group with heavy physical workload (group 2), the difference was not statistically significant. Additionally, the occupational group with heavy physical workload (group 2) had similar mean scores on both subscales, although it was hypothesised that the mean score on the subscale “heavy physical load” would be higher.
Medians and interquartile ranges (in brackets) of subscale scores per occupation group
DISCUSSION
For large scale population studies, self administered questionnaires are a feasible alternative to objective assessment of physical workload. The scores of multiple item questionnaires are often reduced to one total score or a few subscores to avoid having to analyse each individual item as an outcome measure or a potential predictor of outcome. Factor analysis is a good technique for integrating various items, thereby reducing the number of variables to be analysed. In the current study a set of 26 items was reduced to 18 items and two interpretable factors, namely “heavy physical load” and “long lasting postures and repetitive movements.” The two factors accounted for approximately 60% of the variance. The pattern of the items’ loading on the two factors was almost identical for the three study populations, which means that our results may be generalised to other populations with musculoskeletal complaints.
Both subscales had good internal consistencies (0.92 to 0.93 for “heavy physical work” and 0.86 to 0.87 for “long lasting postures and repetitive movements”), and all item-total correlations were above 0.45. A Cronbach’s α value exceeding 0.90 may indicate item redundancy, which suggests that some items may be unnecessary. However, examining the correlation matrix (data not shown) revealed that the highest correlation found between two items was 0.81, which does not indicate redundancy.
We tested the validity of the created subscales of the questionnaire by comparing the subscale scores between four occupational groups with different physical workloads. We classified the occupations of the subjects into four groups on the basis of their expected physical load and used these as a gold standard. It is evident that this demonstration of the questionnaires’ validity is limited as the classification was done on job titles, which may lead to misclassification.23 Two of eight hypotheses were rejected. There was a small and non-significant difference between the scores in the group with physically heavy work and the group with static postures and repetitive movements on the subscale “long lasting postures and repetitive movements.” The group with physically heavy work had similar mean scores on both subscales, although we predicted that the mean score on the subscale “heavy physical work” would be higher. Although this could be explained by a possible flaw in the construction of the “long lasting procedures and repetitive movements” subscale, there was enough evidence to confirm six of the eight hypotheses. This result can also be explained by mistakes made during the classification of the occupation. It is plausible that jobs that we classified as “physically heavy” also entailed static postures or repetitive movements (such as neck bend forward, wrists bend or twisted, static posture), and hence these would score high on the second subscale as well. The tasks within an occupation can vary a great deal. Thus a better way of validating the questionnaire is to relate it to job tasks instead of jobs. Unfortunately we did not have that information. Nevertheless, the questionnaire could clearly distinguish between the scores of the group with static postures and repetitive movements. As expected, they scored low on the first subscale and high on the second. Also the hypotheses regarding the jobs we classified as involving both “physically heavy work” and “static postures and repetitive movements” were confirmed. This provides initial evidence for the questionnaire’s validity. Establishing validity is an ongoing process.22 The next step could be to administer the questionnaire in several groups of workers with occupations that differ greatly with respect to physical workload. Furthermore, validity may be further investigated by comparing the questionnaire with objective assessments of physical workload, and to compare its performances with other physical workload questionnaires.
One may argue that the method we used to assess validity is questionable, as finding a significant difference in scores is dependent on the sample size. Instead of comparing the actual difference between scores, the hypotheses should entail the definition of a relevant difference. However, as the questionnaire is newly developed, the minimally important difference (MID) is as yet unknown. The differences found between the occupational groups are quite large for the confirmed hypotheses (17 to 40 points) and hence are likely to be relevant. Furthermore, in a recent review of studies assessing the MID of health related quality of life instruments it was found that in most circumstances the MID appears to be approximately half a standard deviation.24 Although it is uncertain whether these results can be applied to a questionnaire on physical workload, the differences between the occupational groups on our study were at least half a standard deviation. We consider this an additional indication of the relevance of these differences, and thus of the validity of our approach.
It is not surprising that our factor structure differed from that found by Hildebrandt et al.17 Although we used their questionnaire to create an item pool, our list is substantially shorter and has only one type of response option instead of several different types. Our questionnaire can therefore be considered to be completely different. Hildebrandt et al presented one dimension of musculoskeletal workload and considered the items sitting, standing, walking, and uncomfortable postures as four separate factors. Our first factor corresponds with their factors “force exertion” and “dynamic loads” and our second factor with “static loads” and “repetitive loads”. Items that load on the same factor should share the same conceptual meaning. Force exertion and dynamic loads can be considered as aspects of heavy physical load and can thus be regarded as measuring the same construct. However, one may argue that “long lasting postures” and “repetitive movements” are different concepts. If we had included more items on repetitive movements, we might have found that the second subscale would split up into a “long lasting postures” scale and a “repetitive movements” scale. However, the internal consistency of the second scale was high, which indicates homogeneity among the items. Perhaps long lasting postures and repetitive movement often go together in job descriptions or activities.
Although we have attempted an accurate examination of the measurement properties of the new physical workload questionnaire, there are some aspects that merit discussion. One problem with self reported measurements of workloads is potential reporting bias and reverse causation because of differences in, for instance, pain, sex, and age. Under similar working conditions, employees with more pain, women, or older employees may report a greater physical workload than those with less pain, men, or younger employees. A longitudinal design would make it possible to examine the existence of reporting bias caused by pain or age. We tested the psychometric properties of this physical workload questionnaire using a secondary dataset containing records from employees with musculoskeletal complaints. Further studies should examine whether the questionnaire is also valid in other populations, for example employees without complaints.
One issue that was suggested by the results of the factor analysis may be of relevance to further development of the questionnaire. The items “sitting” and VDU work loaded highly negative on the first factor and did not load on the second factor. These items were not retained, because every subscale in a questionnaire should contain at least three variables.21 However, sedentary work may be an important factor in assessing (lack of) physical workload. A sedentary lifestyle induces a considerably increased risk of morbidity and mortality from several diseases.25,26 Furthermore, many jobs nowadays involve sitting and VDU work. Therefore, it might be suggested that these items should be combined into a third subscale of the questionnaire.
The results of our study provide evidence supporting the internal structure, internal consistency, and validity of the new physical workload questionnaire in a population with musculoskeletal disorders. Further psychometric work is needed to build this questionnaire and its psychometric properties.
APPENDIX
The questionnaire is reproduced in table 6.
Questionnaire derived from the Dutch musculoskeletal questionnaire (DMQ)