Article Text

Abstract
Background The rapid increase of frail older people worldwide will have a substantial impact on healthcare systems. The frailty process may be delayed or even reversed, which makes it attractive for early interventions. However, little is known about the determinants of frailty state changes. The aim of this study is to compare socio-demographic determinants of worsening in frailty state in 11 European countries.
Methods Data of 14 424 community-dwelling persons aged ≥55 years, enrolled in 2004 in the Survey of Health, Ageing and Retirement in Europe, were analysed. Three frailty states were identified (non-frail, pre-frail and frail) using Fried's criteria, and frailty state changes over a 2-year period were determined. Multinomial regression analyses adjusted for baseline frailty state were conducted to investigate whether sex, age, marital status and level of education determined a worsening in frailty state in the total and country-specific European population.
Results Of all individuals, 22.1% worsened, 61.8% showed no change and 16.1% improved in frailty state. Women, those aged ≥65 years, and lower educated persons showed an increased risk of worsening in frailty state. In Southern European countries, there was an earlier and larger increase in risk of worsening in frailty state in life, which was more pronounced in women compared with men.
Conclusions In Europe, persons aged ≥65 years, women and lower educated persons are at increased risk of worsening in frailty state. Differences between countries indicate that interventions aimed at delaying the frailty process in Southern European countries should start earlier with more attention towards women.
- Elderly
- social inequalities
- public health policy
- ageing
- geriatrics
- physical activity
- public health
- social epidemiology
- health expectancy
Statistics from Altmetric.com
- Elderly
- social inequalities
- public health policy
- ageing
- geriatrics
- physical activity
- public health
- social epidemiology
- health expectancy
Introduction
Frailty among older people is a geriatric syndrome that results from a reduction in reserve capacity of multiple organs and functions and may be initiated by disease, inadequate nutritional intake, lack of physical activity, stress and/or physiologic changes of ageing.1–3 Frail older people are at increased risk of disability, falls, dementia, hospitalisation, institutionalisation, healthcare utilisation and death.2 ,4–6 The prevalence of frailty among community-dwelling older people aged ≥65 years is reported to be 17.0%,7 increases with age and is about 25%–40% among those aged ≥80 years.8 ,9 With a worldwide ageing population, the number of frail older people will increase rapidly, which will have a substantial impact on economic, social and healthcare systems.1 There is a clear need to further develop public health strategies to prevent frailty among older people.
Until recently, studies mainly focused on frailty as a non-dynamic entity. However, frailty can be understood as a continuum with intermediate states that can be modified.10 Non-frail persons can become pre-frail, which can be seen as a precursor state of frailty. Of the community-dwelling older people aged ≥65 years, 52% are pre-frail.7 Compared with non-frail persons, pre-frail persons are more likely to progress to frailty, which illustrates the downward spiral association of the frailty syndrome.9 ,11 However, this is not a unidirectional process, that is, there is a possibility to recover from a frail state to a pre-fail and potentially to a non-frail state.11 It is thought that it is at the pre-frail state that the frailty process may still be reversed,1 which makes this state attractive for preventive strategies. As a first step towards such strategies, it is important to identify groups at increased risk of changing in frailty state. In this study, the phenotype of frailty as defined by Fried et al (2001) is used to measure frailty. This measure has been validated and modified for use in numerous published reports and could currently be considered as a gold standard.10 It is demonstrated that the construct of Fried's phenotype has a predictive validity for the adverse outcomes of frailty.9 ,12
Risk factors, such as socio-demographic factors, are likely to contribute to differences between countries in onset and worsening in frailty. Therefore, the aim of this study is to search for socio-demographic determinants of worsening in frailty state among community-dwelling older people in 11 European countries.
Methods
Design
Data of subjects in the Survey of Health, Ageing and Retirement in Europe (SHARE) in 2004 (wave 1) were used. The SHARE study is designed to investigate population ageing processes by looking at changes in health, economic situations and social networks of individuals aged ≥50 years. For this purpose, standardised computer-assisted face-to-face interviews were held. Nationally representative samples of 11 European countries (Sweden, Denmark, Germany, the Netherlands, Belgium, Switzerland, Austria, France, Italy, Spain and Greece) were drawn with an overall pooled household response in wave 1 varying from 38.8% in Switzerland to 79.2% in France. A complete description of the SHARE survey design is described by Börsch-Supan et al (2008, available online at http://www.share-project.org/).
Subjects
Data of community-dwelling persons aged ≥55 years at wave 1, who participated in wave 2 and with <3 missing Fried items at both waves, were used for analyses. Of all subjects included in wave 1, 78.6% (n=22 414) were aged ≥55 years. Among these persons, a total of 7542 persons did not participate in the second wave. After further excluding 221 persons with three or more missing Fried items at one or both waves and 227 persons institutionalised at either wave 1 or wave 2, data of 14 424 individuals were eligible for analysis (online appendix 1).
Frailty and frailty state changes
Frailty states were defined based on the five criteria of a phenotype described by Fried et al 9 including weakness, weight loss, exhaustion, slowness and low activity. Operationalisation of these criteria required adaptation to the SHARE survey contents for which the definition of Santos-Eggimann et al 7 was used. Weakness was defined by using the highest of four measurements of hand grip strength. Cut-offs for grip strength stratified by sex and body mass index were applied, as set by Fried et al.9 One was positive for weight loss when answering ‘less’ or ‘diminution in desire for food’ to the question ‘what has your appetite been like?’ or when answering ‘less’ to the question ‘So you have been eating more, or less than usual?’. Exhaustion was based on the question ‘In the last month, have you had too little energy to do the things you wanted to do?’ with answering ‘yes’ as being positive for exhaustion. One was positive for slowness when mentioning having difficulty walking 100 m or climbing one flight of stairs. At last, a participant was positive for low activity when answering ‘one to three times a month’ or ‘hardly ever or never’ to the question ‘How often do you engage in activities that require a low or moderate state of energy, such as walking, gardening, cleaning the car or going for a walk?’.
Frailty states were defined based on the total number of Fried criteria met (score ≥3= frail; score 1 or 2= pre-frail; score 0= non-frail). For our study, changes in frailty state within 2 years (from wave 1 to wave 2) were studied, which resulted in three groups: ‘worsening’, ‘no change’ and ‘improving’ in frailty state. Worsening was defined as changing from a non-frail or pre-frail state at wave 1 to a higher frailty state at wave 2. Improving in frailty state was defined as changing from a frail or pre-frail state at wave 1 to a lower frailty state at wave 2.
Socio-demographic determinants
The following socio-demographic factors measured at wave 1 were used for analyses: sex, age, marital status and level of education. Three variables were categorised: age (5-year groups), level of education (low =0–10 years, high =11–25 years) and marital status (married/registered partnership, never-married, divorced and widowed). For international comparisons of education, SHARE used the 1997 International Standard Classification of Education (ISCED-97).
Statistical analyses
When scores for one or two of the five frailty criteria were missing, values were imputed through single random imputation, using software package R V.2.7.1. The scores of the population without missing values were used to replace missing values through a logistic regression model. Using this model, the probability of scoring ‘positive for frailty’ on a frailty indicator for every individual (with one or more missing values) was predicted and a random draw from the binomial distribution with that probability was made. To check the influence of random imputation, the procedure was repeated and no essential differences were found. Data for 1 or 2 criteria were imputed for, respectively, 2080 and 2312 individuals in waves 1 and 2, which completed the data sets (online appendix 1).
As a first step, socio-demographic differences between the study population and the excluded sample were investigated using χ2 tests for sex, marital status and level of education and a t-test for mean age. In order to investigate which socio-demographic factors were associated with worsening in frailty state in the total study population, ORs with a 95% CI for sex, age, level of education and marital status were derived from multinomial logistic regression analyses, adjusted for baseline frailty state. Differences between countries in socio-demographic determinants of worsening (and improving) in frailty state were investigated by calculating odd ratios per country, adjusted for other determinants and baseline frailty state,13 ,14 using ‘no change’ in frailty state as a reference (p values <0.05 were considered significant). All analyses were conducted using SPSS V.17.0.
Results
Of the 14 424 included individuals, 52.1% were non-frail, 39.1% pre-frail and 8.8% frail at wave 1.
After a 2-year period, 22.1% had worsened, 61.8% showed no change and 16.1% had improved in frailty state. Among those who worsened, more than two-thirds (69.2%) showed a change from a non-frail state at wave 1 to a pre-frail state at wave 2. A proportion of 24.0% changed from a pre-frail to a frail state and 6.8% changed from a non-frail to a frail state. Of the persons who improved in frailty state, 76.9% changed from a pre-frail state to a non-frail state, 19.8% changed from a frail to a pre-frail state and 3.3% changed from a frail to a non-frail state. The distributions of frailty state changes per country showed that in Austria and Denmark most persons worsened in frailty state, that is, 26.2% and 25.4%, respectively, while the least persons worsened in frailty state in Greece (16.3%) and Germany (19.2%) (table 1).
Differences between countries in frailty state changes
Socio-demographic determinants
Baseline socio-demographic characteristics showed that more participants were women, the majority of the participants were below 70 years of age, married (or with a registered partnership) and lower educated (table 2). The study participants who remained in the study and completed follow-up were younger (p<0.001), more often with a spouse (p<0.001) and higher educated (p<0.001) compared with the individuals lost to follow-up. No sex differences were found between both samples.
Associations of socio-demographic factors with worsening in frailty state
Women showed a 1.26-fold (95% CI 1.16 to 1.38) higher risk of worsening in frailty state compared with men. In addition, persons aged ≥65 years had a significantly increased risk of worsening in frailty state which increased with age up to a risk of 3.55 (95% CI 2.97 to 4.25) for persons aged ≥80 years compared with persons aged 55–59 years. A significant higher risk of worsening in frailty state was also found for lower educated persons as compared with higher educated persons (OR=1.40, 95% CI 1.28 to 1.54). No significant differences in risk of worsening in frailty state were found for marital status (table 2).
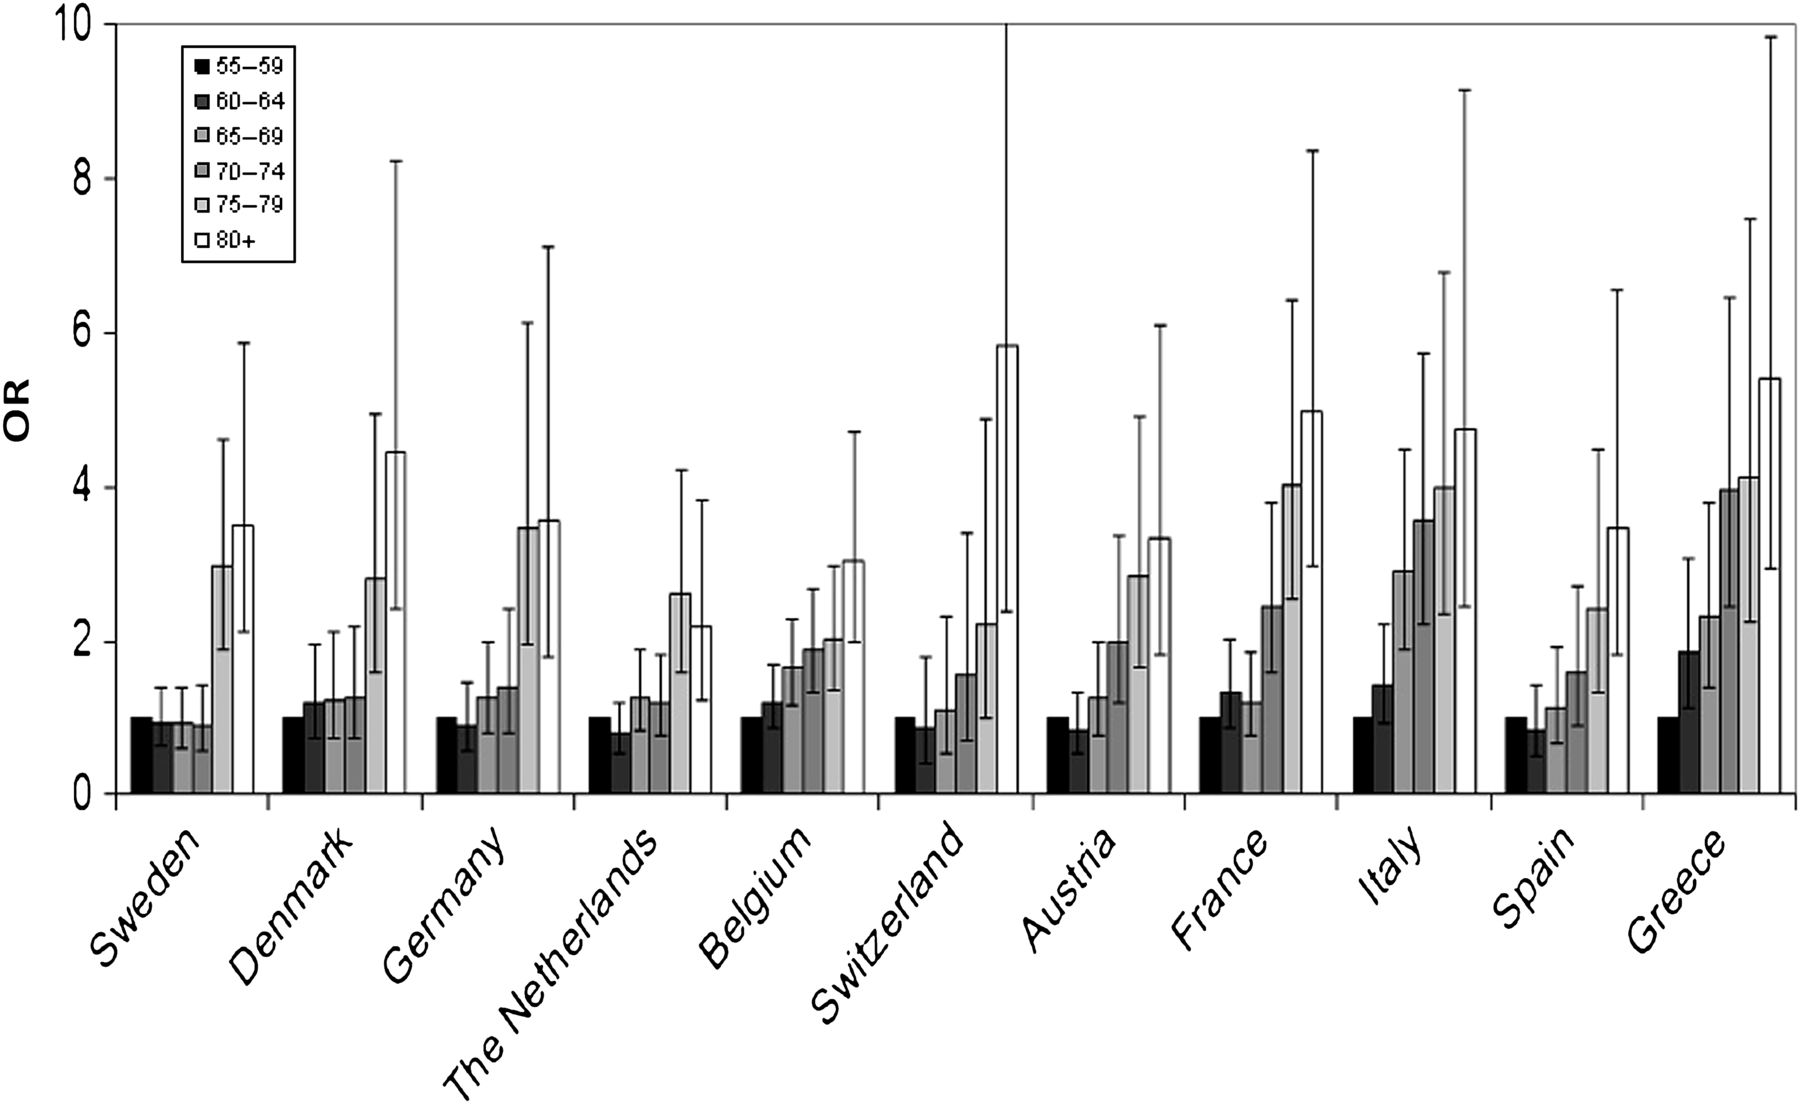
Differences between countries were found in associations of sex, age and level of education with worsening in frailty state. Figures 1–3 show these associations (adjusted OR's). All countries showed a significant increased risk for persons aged ≥75 years (online appendix 2). In Greece, this increased risk started at the age of 60–64, where persons had a 1.85-fold (95% CI 1.12 to 3.07) higher risk of worsening in frailty state compared with persons aged 55–59 years. Persons had a significantly increased risk of worsening from the age of 65 to 69 in Belgium (OR=1.64, 95% CI 1.17 to 2.28) and Italy (OR=2.90, 95% CI 1.87 to 4.49) and from 70 to 74 years in Austria (OR=2.00, 95% CI 1.19 to 3.38) and France (OR=2.45, 95% CI 1.58 to 3.80, p<0.001). The risk of worsening in frailty state for persons aged 75–79 years ranged from 2.02 (95% CI 1.37 to 2.98) in Belgium to 4.12 (95% CI 2.26 to 7.49) in Greece compared with persons aged 55–59 years. For persons aged ≥80 years, the risk of worsening ranged from 3.05 (95% CI 1.98 to 4.72) in Belgium to 5.84 (95% CI 2.39 to 14.30) in Switzerland. In general, Greece, Italy and France showed higher risks per age category compared with the other European countries (figure 1 and online appendix 2).

Differences between countries in worsening in frailty state by age: ORs (95% CI) adjusted for baseline frailty state, sex and level of education (n=14 424).

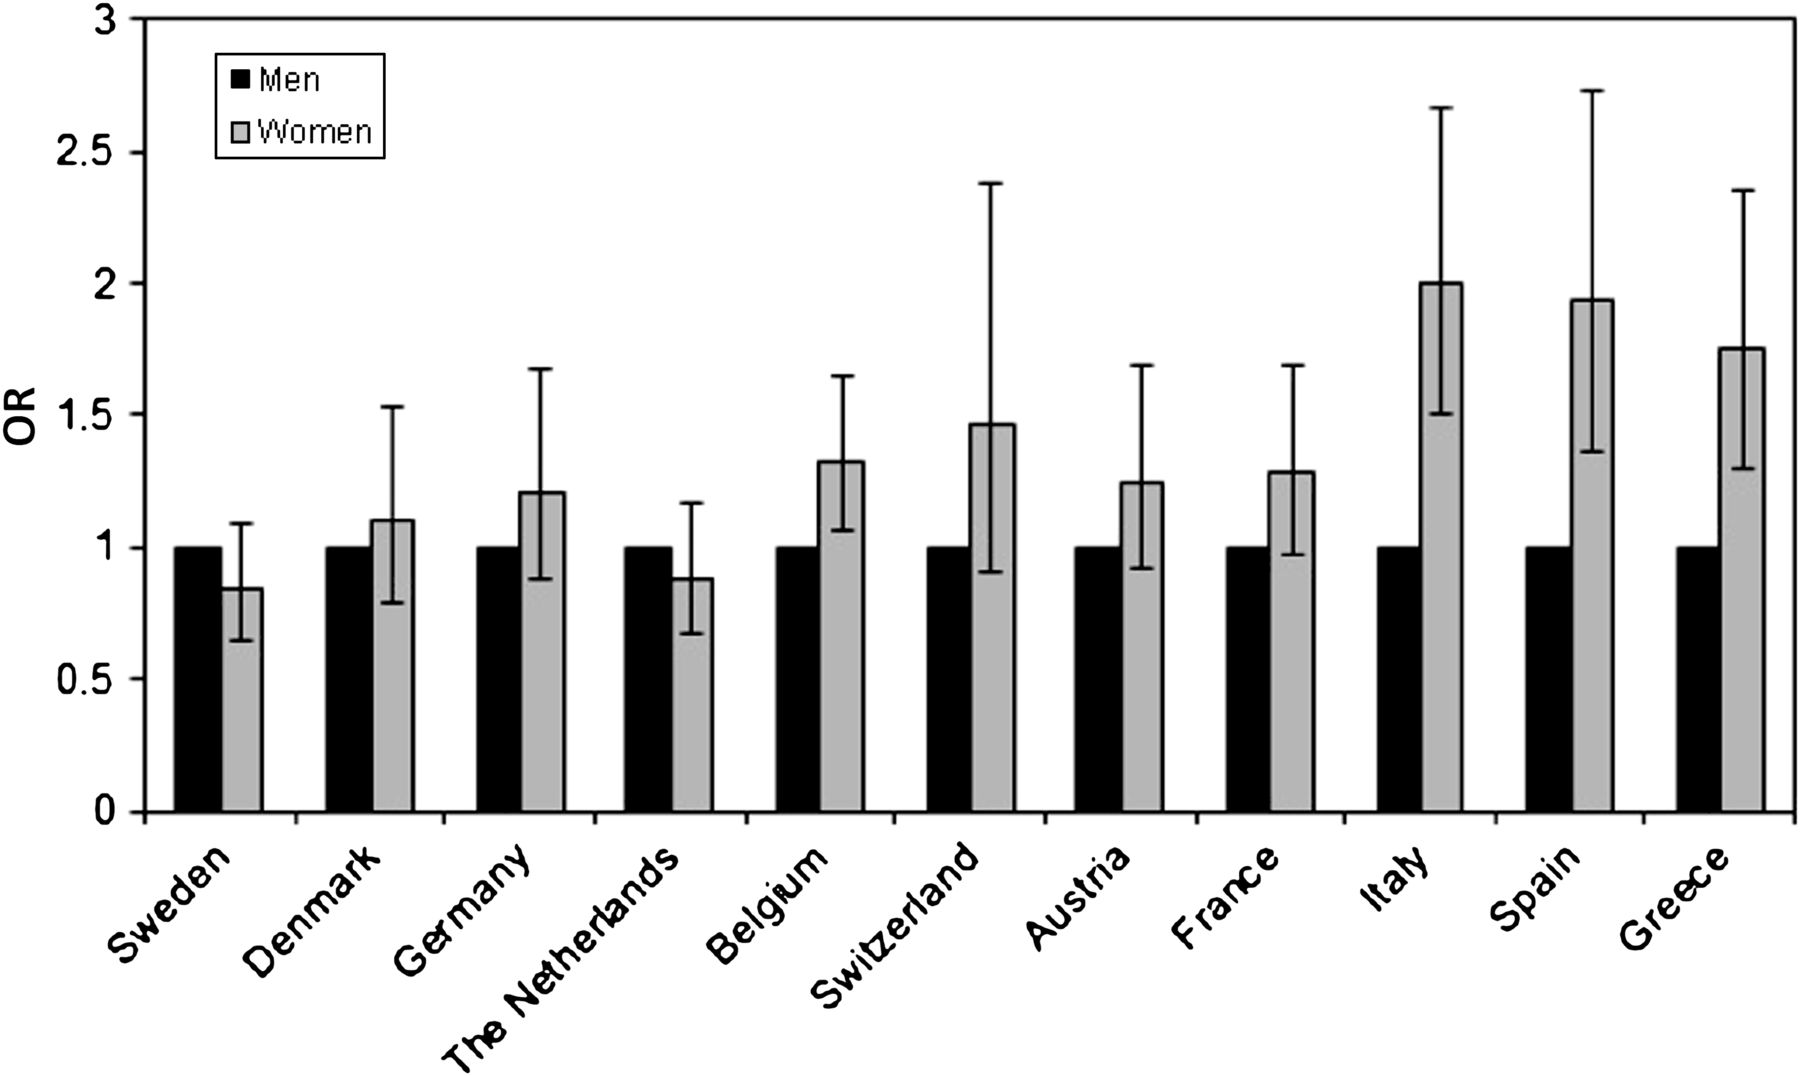
Differences between countries in worsening in frailty state by sex: ORs (95% CI) adjusted for baseline frailty state, age and level of education (n=14 424).

Differences between countries in worsening in frailty state by level of education: ORs (95% CI) adjusted for baseline frailty state, sex and age (n=14 424).
In Belgium, Italy, Spain and Greece, women had a significant higher risk of worsening in frailty state as compared with men with ORs for women ranging from 1.32 (p<0.05) in Belgium to 2.00 (p<0.001) in Italy. Seven countries did not show a significant difference between men and women in worsening in frailty state (figure 2 and online appendix 2).
An association of level of education with worsening in frailty state was found for six countries with a risk of lower educated persons ranging from 1.35 (95% CI 1.08 to 1.70) in Belgium to 1.64 (95% CI 1.03 to 2.63) in Spain as compared with higher educated persons. For Denmark, Switzerland, Austria, Italy and Greece, no association of level of education was found (figure 3 and online appendix 2).
Improving in frailty state
Similar differences between countries as found for worsening in frailty state were found for improving in frailty state (online appendix 3). In general, associations were found for age, sex, level of education and marital status.
In Austria, Italy and Greece, persons had a decreased probability of improving in frailty state from the age of 65 onwards. Persons had a decreased probability of improving from ≥70 years in Spain and France. In Sweden, the Netherlands, Denmark and Belgium, persons had a decreased probability from ≥75 years (OR ranging from 0.20 to 0.53). In Germany, persons had a decreased probability of improving from ≥80 years. No significant association with age was found for Switzerland. A significant association with sex was found for Denmark and Germany where women had a significant lower probability of improving in frailty state compared with men (OR=0.55, 95% CI 0.34 to 0.88 and OR=0.53, 95% CI 0.32 to 0.87, respectively). In Germany, Belgium, France and Italy, lower educated persons had a lower probability of improving in frailty state compared with higher educated persons. In addition, four countries showed that persons without a spouse (never-married or divorced) had a decreased probability of improving in frailty state compared with those who were married or had a registered partnership (OR ranging from 0.26 to 0.48). The complete results are shown in online appendix 3.
Discussion
In the European population, we found that women, those aged ≥65 years, and persons with ≤10 years of education were at increased risk of worsening in frailty state. Moreover, differences between countries were observed: persons in Southern European countries (France, Italy and Greece) showed an increased risk of worsening at an earlier age compared with those in Northern European countries (Sweden, Denmark, Germany, the Netherlands and Switzerland). No sex differences were found in Northern European countries, whereas in Southern European countries and in Belgium, women were at increased risk of worsening in frailty state as compared with men.
Some limitations of this study must be considered when interpreting these findings. Those lost to follow-up were significantly older, lower educated and more often without a spouse or registered partner. If health status determines who gets lost to follow-up, our results may underestimate ‘real’ associations. In the current study, Fried's phenotype as a measure of frailty is self-reported (four of five criteria). Differential misclassification by socio-demographic factors may have introduced bias in our findings, but it is unclear in what direction and to what extent. For operationalising Fried's phenotype in the SHARE study, the definition of Santos-Eggimann (2009) was used which does not fully match the original criteria as defined by Fried et al (2001). However, given that we studied changes in frailty state and that a potential measurement error would be equal at both waves of measurement, it is expected to be of minor influence to the reported changes. In this study, we used the Fried's criteria to measure frailty. Although Fried's criteria are widely used, there is currently no general agreement on the best way to measure frailty. Other measures like the Tilburg Frailty Indicator15 or the Sherbrooke Postal Questionnaire16 differ from Fried's criteria by inclusion of other domains besides physical frailty, for example, social and cognitive frailty. There is an ongoing discussion about the inclusion of cognitive status in Fried's phenotype, which has been found to be associated with adverse outcomes of frailty.17 These results raise some concerns about the validity of Fried's criteria and suggest that the inclusion of alternative criteria such as cognitive impairment might strengthen Fried's phenotype. It is currently unclear how inclusion of cognitive status or the use of another measure of frailty would have influenced our findings.
The findings contribute to the understanding of the frailty development process and can be related to outcomes of prior studies. The increased risk of women to worsen in frailty state is in accordance with the finding that considerably more women are frail compared with men.18 ,19 Fried et al (2001) and Walston et al (2002) found that the frailty prevalence is increasing with age, which is in line with our findings. In addition, the results showing that lower educated persons are at increased risk of worsening in frailty state is also found by Crimmins et al.20 Different studies did also found an association between level of education and frailty.21 ,22 Differences between countries have also been reported by Santos-Eggimann (2009), who found that more persons in Southern European countries are pre-frail compared with those in Northern European countries. For further understanding of the frailty process, it is of interest to search for (health and behaviour related) mediating factors, which could explain the temporal relationship between age, sex and educational level and frailty changes.
Southern European populations have a higher healthy life expectancy compared with Northern European populations.23 In this context, our finding of an earlier worsening in frailty state in Southern European countries seems a paradox. It might be explained by similar differences between countries in the delay of progress from (pre-) frailty to disability. The earlier onset of worsening in frailty state in Southern European countries may also be caused by lower rates of institutionalisation of (frail) older people and women in Southern European countries compared with Northern European countries,7 ,24 as our study population consists of community-dwelling individuals (55–102 years). This may lead to more (frail) older people in the community in Southern European countries with an increased risk of worsening in frailty state. Differences might also be present in healthcare access: Northern European older people and women might visit healthcare professionals more often because of better healthcare access compared with older people and women in Southern European countries. Therefore, persons in Northern European countries might benefit more from healthcare advice. In addition, health-related behaviours might explain the cross-national age and sex differences in worsening in frailty state, for example, in Northern European countries, older people are more physically active compared with Southern European countries and differences in physical activity between men and women are larger among Southern European older people.25 Whereas previous studies found a north-south gradient in health outcomes like self-rated health and mortality,26–28 socio-economic inequalities in worsening in frailty state appeared to be of similar magnitude in 11 European countries. Presumably, causes of differences between countries in the size of socioeconomic inequalities, such as differential healthcare access, or the stage of the epidemic of health behaviours apparently do not translate into differences in the size of educational inequalities in the worsening in frailty or are buffered by other (currently unknown) factors. Further research on understanding differences between countries in socioeconomic health inequalities should include this issue.
In conclusion, persons aged ≥65 years, women and lower educated persons are at increased risk of worsening in frailty state in the European population. Because of the growing number of persons at risk of frailty and the fact that frailty appears to be a dynamic process, delaying the frailty process is a major challenge in public health. Early interventions might delay the frailty development process and could even prevent pre-frail older people to become frail.
Public health interventions aimed at delaying the frailty process in Southern European countries should target persons earlier in life and pay more attention to women than in Northern European countries.
What is already known on this subject
-
Because of the growing elderly population, the number of older people at risk of frailty will also increase.
-
Frailty has a major impact on economic, social and healthcare systems.
-
Until recently, studies mainly focused on frailty as a non-dynamic entity. However, frailty can be understood as a continuum with intermediate states that can be modified, which makes it attractive for preventive public health strategies.
-
It is known that women and less educated persons are at increased risk of frailty.
What this study adds
-
It was found that persons aged ≥65 years, women and lower educated persons are at increased risk of worsening in frailty state in the European population.
-
Differences between countries were found in socio-demographic determinants of worsening in frailty state.
-
The differences between countries implicate that for intervention development aimed at delaying the frailty process, different groups should be targeted in Southern European countries compared with Northern European countries.
Acknowledgments
This paper uses data from SHARELIFE release 1, as of 24 November 2010, and SHARE release 2.3.1, as of 29 July 2010. The SHARE data collection has been primarily funded by the European Commission through the 5th framework programme (project QLK6-CT-2001-00360 in the thematic programme Quality of Life), through the 6th framework programme (projects SHARE-I3, RII-CT-2006-062193, COMPARE, CIT5-CT-2005-028857, and SHARELIFE, CIT4-CT-2006-028812) and through the 7th framework programme (SHARE-PREP, 211909 and SHARE-LEAP, 227822). Additional funding from the US National Institute on Aging (U01 AG09740-13S2, P01 AG005842, P01 AG08291, P30 AG12815, Y1-AG-4553-01 and OGHA 04-064, IAG BSR06-11, R21 AG025169) as well as from various national sources is gratefully acknowledged (see http://www.share-project.org/t3/share/index.php for a full list of funding institutions). We would like to thank Caspar Looman for his statistical advice.
References
Supplementary materials
Supplementary Data
This web only file has been produced by the BMJ Publishing Group from an electronic file supplied by the author(s) and has not been edited for content.
Files in this Data Supplement:
- Download Supplementary Data (PDF) - Manuscript file of format pdf
- Download Supplementary Data (PDF) - Manuscript file of format pdf
- Download Supplementary Data (PDF) - Manuscript file of format pdf
Footnotes
Funding This study was financially supported by the Erasmus University MC in Rotterdam.
Competing interests None.
Provenance and peer review Not commissioned; externally peer reviewed.