Article Text

Abstract
Background Reducing geographical inequalities in cancer survival in England was a key aim of the Calman–Hine Report (1995) and the NHS Cancer Plan (2000). This study assesses whether geographical inequalities changed following these policy developments by analysing the trend in 1-year relative survival in the 28 cancer networks of England.
Methods Population-based age-standardised relative survival at 1 year is estimated for 1.4 million patients diagnosed with cancer of the oesophagus, stomach, colon, lung, breast (women) or cervix in England during 1991–2006 and followed up to 2007. Regional and deprivation-specific life tables are built to adjust survival estimates for differences in background mortality. Analysis is divided into three calendar periods: 1991–5, 1996–2000 and 2001–6. Funnel plots are used to assess geographical variation in survival over time.
Results One-year relative survival improved for all cancers except cervical cancer. There was a wide geographical variation in survival with generally lower estimates in northern England. This north–south divide became less marked over time, although the overall number of cancer networks that were lower outliers compared with the England value remained stable. Breast cancer was the only cancer for which there was a marked reduction in geographical inequality in survival over time.
Conclusion Policy changes over the past two decades coincided with improved relative survival, without an increase in geographical variation. The north–south divide in relative survival became less pronounced over time but geographical inequalities persist. The reduction in geographical inequality in breast cancer survival may be followed by a similar trend for other cancers, provided government recommendations are implemented similarly.
- Cancer
- deprivation
- geography FQ
- health policy
- survival
This is an open-access article distributed under the terms of the Creative Commons Attribution Non-commercial License, which permits use, distribution, and reproduction in any medium, provided the original work is properly cited, the use is non commercial and is otherwise in compliance with the license. See: http://creativecommons.org/licenses/by-nc/2.0/ and http://creativecommons.org/licenses/by-nc/2.0/legalcode.
Statistics from Altmetric.com
Reducing regional inequalities in cancer survival in England was identified as a public health priority in two key policy documents relating to cancer services in England: the Calman–Hine Report of 1995 and the NHS National Cancer Plan of 2000.1 2 Cancer networks were founded in 2001, following these policy developments, to improve uniformity in the standard of cancer management and to ensure equitable distribution of cancer facilities and resources.2
In this paper we present estimates of 1-year age-standardised relative survival among adult patients (aged 15–99 years) diagnosed with a cancer of the oesophagus, stomach, colon, lung, breast (women) or cervix in the 28 cancer networks (as geographically defined in 2009) in England during 1991–2006 and followed up to 31 December 2007. The temporal trend in geographical differences in survival is analysed in three calendar periods, selected to coincide with the above-mentioned developments in cancer policy: 1991–5 (pre-Calman-Hine report); 1996–2000 (post-Calman–Hine report); 2001–6 (post-NHS National Cancer Plan). These periods coincide with those used in previous published research.3
Given their role in cancer management, cancer networks are a logical unit for the analysis of regional diversity in cancer survival in England.4 Also, since the population of each cancer network is between 0.6 and 3.0 million, they are more suitable units of analysis of survival from individual cancers than smaller NHS geographies such as primary care organisations.4 5
Methods
Data
National cancer registration data for England were obtained from the Office for National Statistics (ONS). The National Cancer Registry at ONS collates cancer registrations submitted by regional cancer registries in England. The National Health Service Information Centre (NHS-IC) updates these records with information about death or emigration and returns this to ONS. The data were extracted from the database at ONS in October 2008. Ethical approval to conduct the study was obtained from the ONS Medical Research Service (MR1101, 20 November 2007) and from the statutory patient information advisory group (PIAG; now the Ethics and Confidentiality Committee of the National Information Governance Board) under Section 61 of the Health and Social Care Act 2001 (PIAG 1-05(c)/2007, 31 July 2007).
All adult patients (15–99 years) who were diagnosed during 1991–2006 with an invasive primary malignancy of the oesophagus, stomach, colon, lung, breast (women) or cervix were eligible for inclusion in the study. They were followed up to ascertain their vital status to 31 December 2007. Patients were excluded if the behaviour of the tumour was benign, in situ, or uncertain if benign or malignant. Patients were further excluded if their cancer was registered from a death certificate only (DCO registration) or if they died on the same day as diagnosis (zero survival). Zero survival cases were excluded because before 1995 it is not possible to distinguish between DCO registrations and zero survival cases. Patients were also excluded if their record lacked relevant geographical data. A detailed description of data cleaning and exclusions has been published.3 6 7 The number of patients included was approximately 90% of eligible records (table 1).
Number of patients eligible for analysis and number excluded, for adults (15–99 years) diagnosed with one of six cancers in England during 1991–2006
There were originally 34 cancer networks in England when they were founded in 2001.4 Following various mergers, there are now 28 (figure 1). We applied the current boundaries retrospectively to 1991, to enable consistent comparison over time. The number of patients included for analysis in each cancer network is shown in table 2.

Cancer Network Boundaries, 2009.
Number of adult patients (15–99 years) diagnosed in England during 1991–2006 and included for analysis, by cancer and cancer network
Relative survival
We estimated relative survival 1 year after diagnosis for each cancer network by cancer, sex and calendar period. Relative survival is the ratio of the observed probability of survival and the probability of survival that would have been expected if the patients had experienced the normal background mortality in the area where they live.8–10
Relative survival is therefore a method of factoring out background mortality and estimating survival from cancer without requiring information on cause of death. Background mortality was obtained from population life tables, generated from death registration data provided by ONS. Complete (single year of age) life tables for ages 0–99 years were built for men and women for three index years (1991, 2001 and 2005), using deaths for three years centred on those index years and the midyear population.11 Life tables for the intervening years were created using linear interpolation. The life table for 2005 was used for 2006 and 2007.
In England, background mortality by sex and age varies by geographical region and socioeconomic status,12 so life tables were created for each government office region and deprivation category. Patients were assigned a deprivation score based on the income domain of the indices of multiple deprivation (2004) of the lower super output area of residence at the time of diagnosis.13 The deprivation score was categorised according to the quintiles of indices of multiple deprivation in the 32 483 lower super output area.
Relative survival is adjusted for background mortality by age, but it will vary between regions if there are underlying differences in the age structure of cancer patient populations. To control for these differences in age structure, we produced age-standardised survival using the direct method, wherein age-specific survival is weighted by a standard population age distribution.6
To create age-standardised estimates it is first necessary to estimate age-specific survival. This can be difficult because of the small number of events in some age groups when disaggregating by cancer, cancer network, sex and calendar period.
Analytical strategy
To overcome the problem of too few events, we estimated age-specific excess mortality (and relative survival) using a two-step approach. Excess mortality is the observed mortality among cancer patients minus the expected mortality in the general population.
In the first step, estimates were obtained using the cohort approach, with the publicly available Stata program strel, which uses the maximum-likelihood approach.10 14 We excluded all unstable estimates, defined a priori as follows: age, sex, cancer network and period-specific estimates from strel were discarded if there were no deaths in either the first or the second half year after diagnosis. The proportion of 1-year excess mortality estimates by cancer, sex, age, period and cancer network that were discarded because of non-convergence or instability varied from 0% for breast and lung cancer to 7% for cancer of the oesophagus.
In the second step, the retained excess mortality estimates were modelled using a generalised linear model, assuming a Poisson error distribution, which enabled us to produce more reliable estimates of relative survival for all combinations of cancer, sex, age group and calendar period. Calendar period, follow-up time and five age groups (15–44, 45–54, 55–64, 65–74 and 75–99 years) were included in the model as main effects. Interactions were added between period and age, period and follow-up time, and follow-up time and age in order to deal with the non-proportionality of excess hazards over time. Backward stepwise selection was used to choose the interaction terms, while the main effects were locked into the model.
The direct method of age standardisation was then applied using the age-specific results for each cancer, sex, period, cancer network combination obtained from the generalised linear model. The standard age weights were derived from the age distribution of cancer patients diagnosed in England and Wales in 1996–9.
Funnel plots
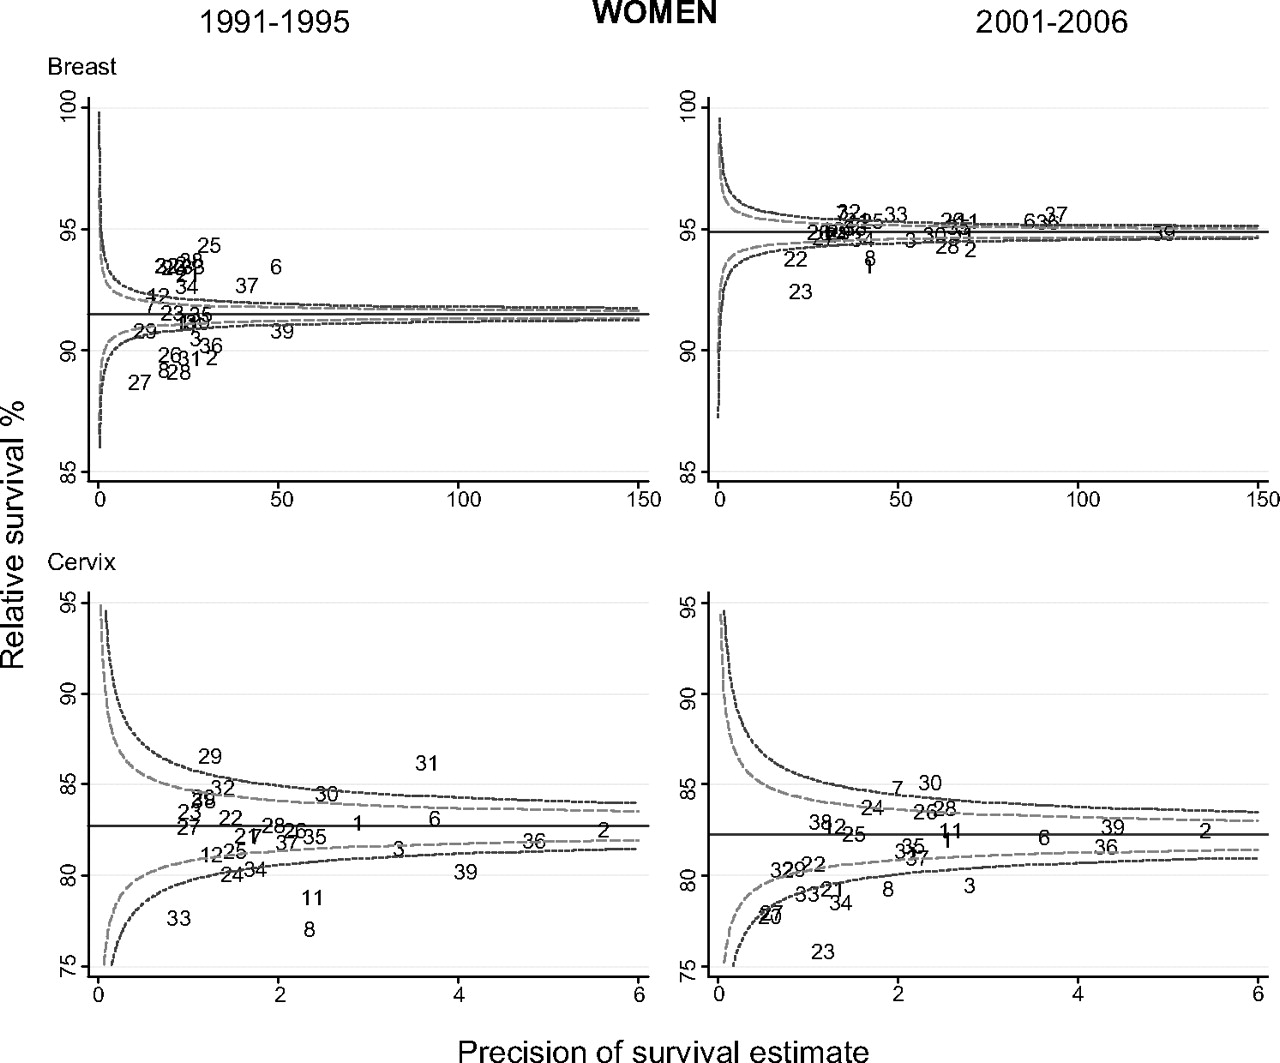
Funnel plots are a means of presenting comparative data that avoids spurious ranking of estimates for particular population units. They permit visualisation of how much a specific value differs from the England-wide value, given the precision of the estimate.3 15–17 Age-standardised 1-year relative survival estimates were plotted for each cancer network against the precision of the estimates, calculated as the inverse square of their standard errors (figure 2). The England-wide value, or ‘target’, is plotted as a solid horizontal line through the middle of the plots, together with its 95.0% and 99.8% control limits (dashed lines). The control limits around the target estimate for England were calculated as a function of the precision range of the cancer network-specific estimates. Cancer network-specific estimates (numbered in the plots) falling outside the control limits represent those cancer networks showing wider disparity from the England-wide value than could be expected due to chance alone.
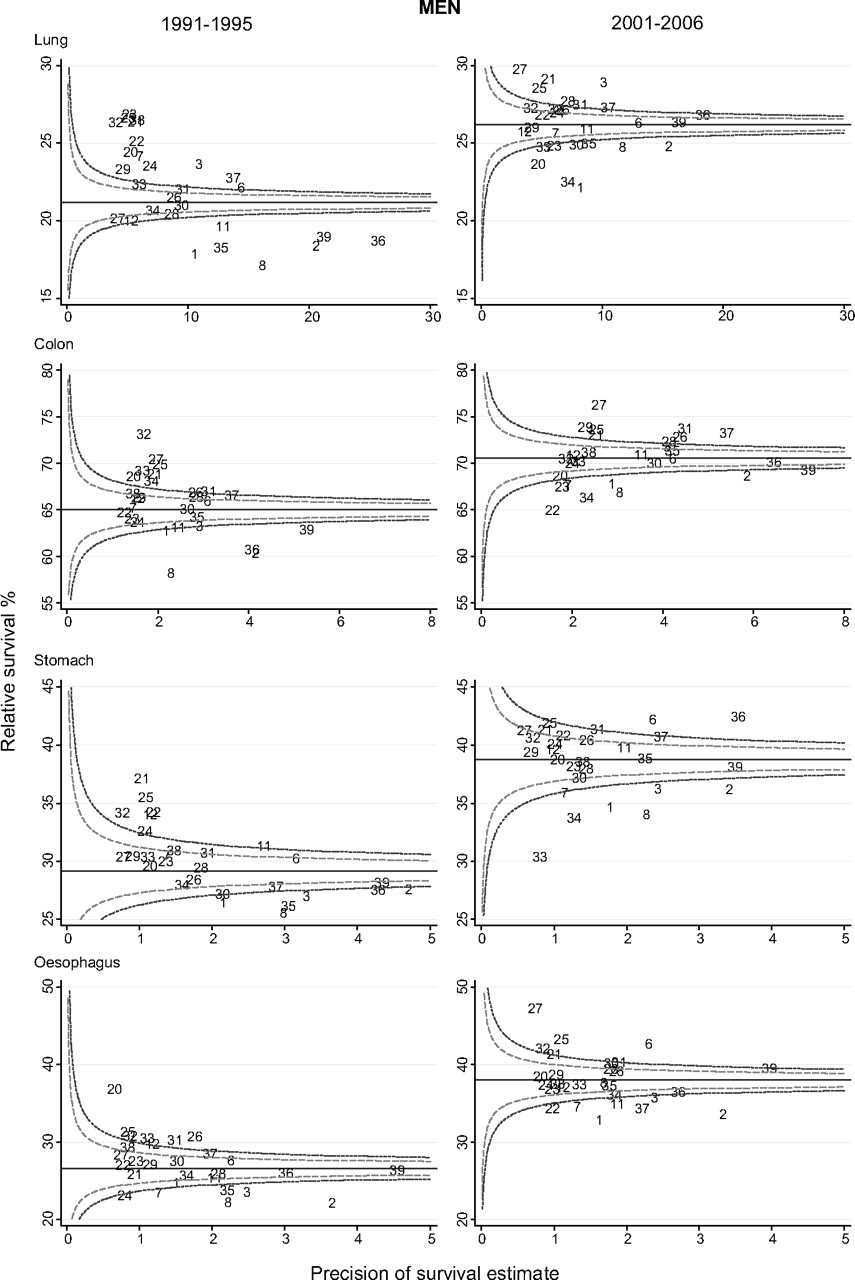


Funnel plots of 1-year relative survival in the cancer networks of England: by cancer, sex and period.
Results
Geographical diversity in 1-year relative survival varied by cancer (table 3). For women diagnosed in 2001–6, the range in relative survival across cancer networks varied from 15.9% (oesophageal cancer), to 3.4% (breast cancer). For men, the range varied from 14.3% (oesophagus) to 7.5% (lung). Both the range and interquartile range reduced over time in women for all cancers except oesophageal cancer, for which the interquartile range increased from 3.2% in 1991–5 to 5.5% in 2001–6. Among men, the range widened in both oesophageal and stomach cancer and narrowed for cancers of the lung and colon.
One-year relative survival (%) in England, and range and IQR in 1-year relative survival across cancer networks, by cancer, calendar period of diagnosis and sex
One-year relative survival for each cancer network is shown in funnel plots (figure 2), comparing the first and final periods (1991–5 and 2001–6, respectively).
In England, 1-year survival improved by up to 10 percentage points for all cancers analysed here over the period 1991–2006, with the exception of cervical cancer. In general, the dispersion of relative survival estimates was wide and a large proportion of cancer networks were outliers in relation to the England value. Trends in survival and the outlying cancer networks were similar in men and women. For breast cancer, dispersion clearly reduced over time. There were also fewer lower outliers in 2001–6 for lung and stomach cancer in women.
To establish which cancer networks had consistently lower relative survival than the England-wide value, we summed the number of times each cancer network fell below the lower 99.8% control limit on the funnel plots across the various cancers (four in men and six in women) and the three calendar periods of diagnosis. These sets of estimates were used to measure the extent of geographical variability over time.
The number of relative survival estimates below the lower 99.8% control limit of the England-wide value across all three calendar periods is shown in figure 3. An overall figure of 12 for men or 18 for women would indicate that relative survival was below the England lower control limit for every cancer examined, in all three periods. Cancer networks with consistently lower survival than the England-wide value are illustrated with darker shading. Figure 3 provides strong evidence of geographical clustering of poor survival from the six cancers in England. For men, poorer survival was clustered in the north, whereas cancer networks in the south and west had survival consistent with the England estimate. For women, the north–south pattern was similar, although less marked, with a larger number of outlying estimates in the south west than found for men.
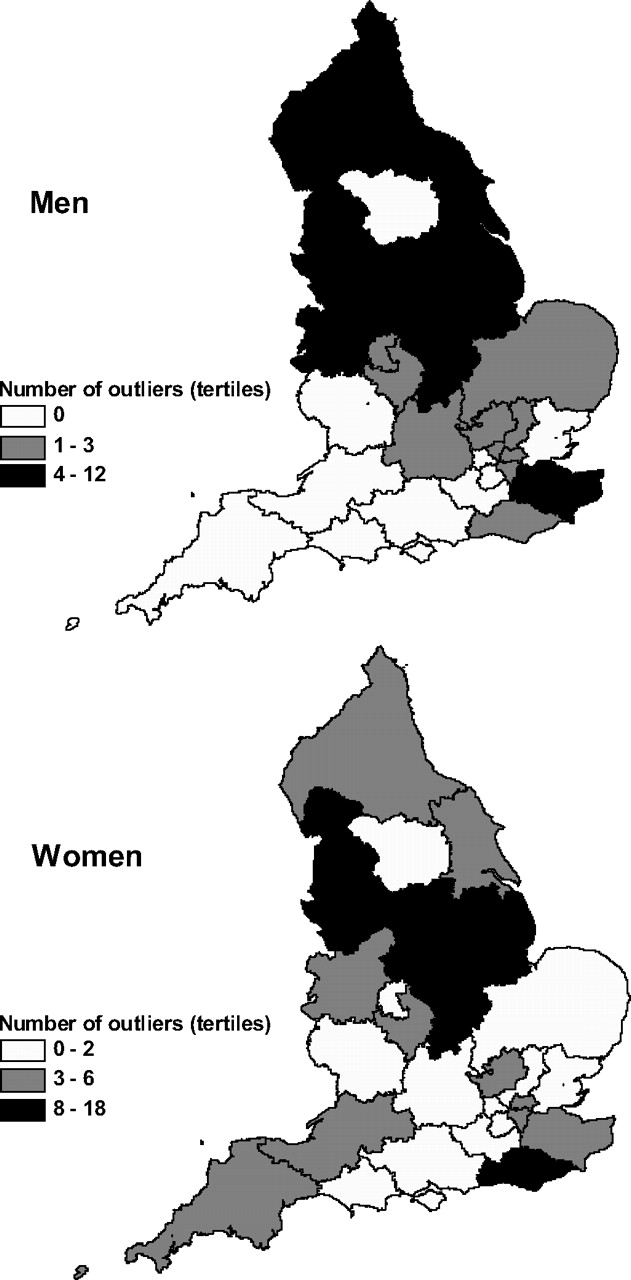
The number of cancers (out of four in men and six in women) for which relative survival fell below the lower 99.8% control limit of the England value, totalled over three calendar periods, by sex and cancer network.
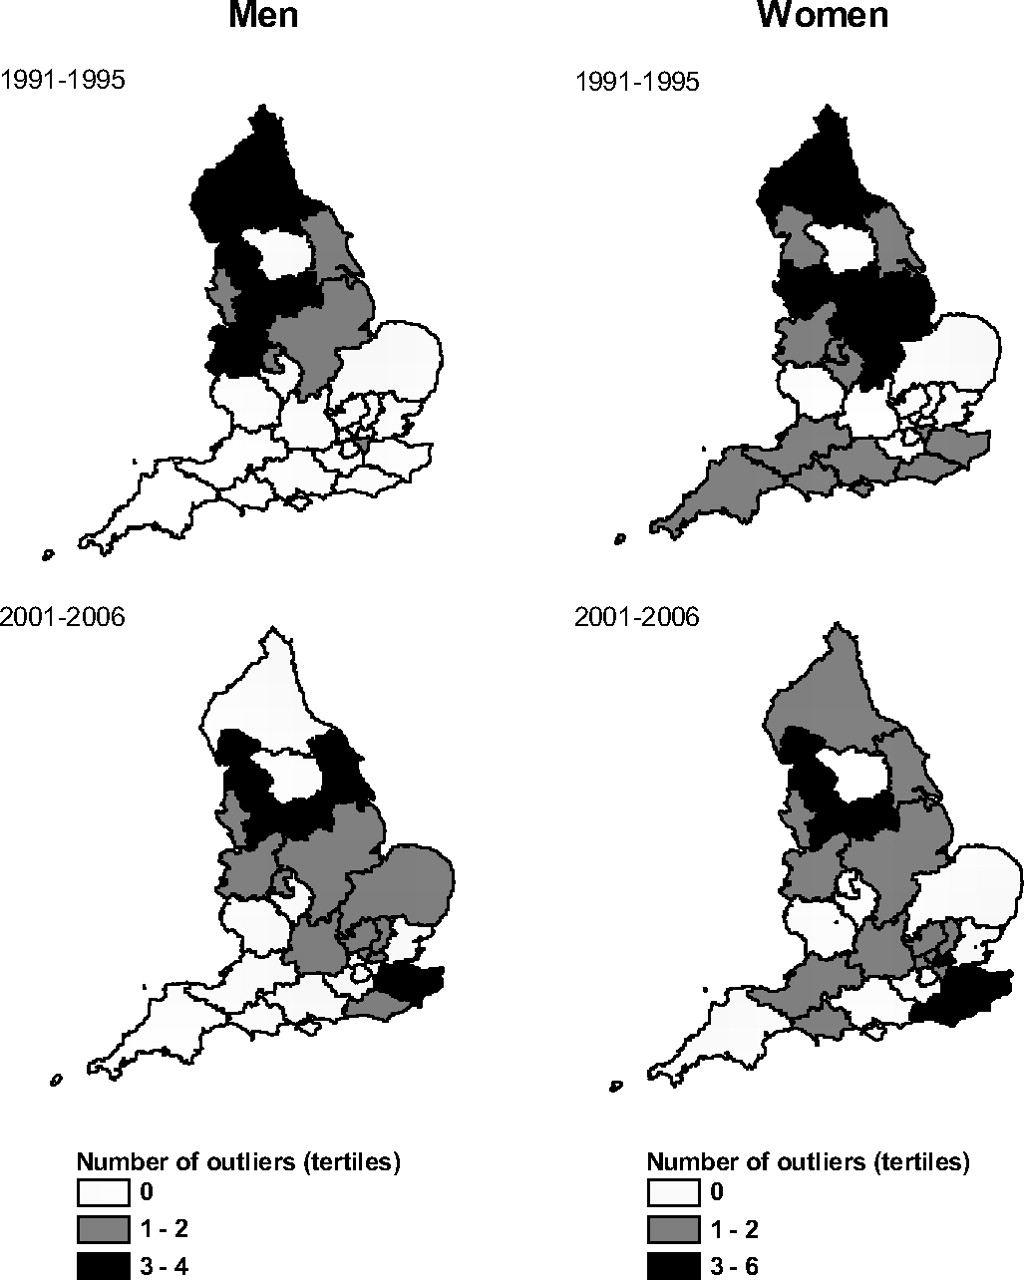
Figure 4 shows the number of survival estimates below the 99.8% control limit within each calendar period (results shown for 1991–5 and 2001–6). A total of four in men and six in women would indicate that the cancer network was an outlier for all cancers examined. Although the number of cancer networks that are lower outliers has remained relatively stable over time, the north–south divide was less pronounced for patients diagnosed in 2001–6 than for patients diagnosed in 1991–5.

The number of cancers (out of four in men and six in women) for which relative survival fell below the lower 99.8% control limit of the England value, by calendar period (showing 1991–5 and 2001–6), sex and cancer network.
Overall, the proportion of cancer and cancer network combinations that were lower outliers compared with the England value was relatively stable across the three calendar periods for women, with the proportion at 24%, 26% and 24% in each of the three periods. By contrast, for men, 21% and 22% of cancer network-specific survival estimates were below the lower control limit in 1991–5 and 1996–2000, respectively, but this figure rose to 28% in the period 2001–6. The percentage of cancer network-specific survival estimates that were outliers above the upper control limit decreased over time. The percentage fell from 40% to 27% for men and from 40% to 29% for women between the first and last calendar periods of diagnosis. Much of the reduction occurred in the second period (1995–2000).
To consider the potential effect of variable data quality on differences in survival by cancer network, the proportion of DCO registrations was compared between cancer networks (by sex, calendar period and cancer) and the correlation with relative survival was ascertained (table 4). The variation in the proportion of all exclusions combined depends almost solely on the proportion of DCO registrations, other exclusion categories being rare or, for multiple tumours for a given cancer site, very stable between cancer networks. DCO registrations in conjunction with zero survival represent 80.7% of the exclusions in this study (table 1). Table 4 shows that the greatest variability in the proportion of DCO registrations occurred in 1991–5, and this proportion declined over time. There was indeed some correlation between the proportion of DCO registrations and relative survival in this earliest period, but no evidence of continuing correlation after 1995 (except for oesophageal cancer, for which there was some correlation in 1996–2000).
Range of percentage of eligible patients that were DCO registrations across cancer networks (minimum and maximum presented), Spearman rank correlation with 1-year relative survival, by cancer, calendar period of diagnosis and sex
Discussion
In England, 1-year relative survival improved dramatically for all cancers analysed, with the exception of cervical cancer, between 1991 and 2006. The lack of improvement in cervical cancer survival has been found in previous studies and may be attributable to stage migration following the introduction of effective screening.18 19 Since 1998, cervical screening has reached at least 85% of eligible women in England. Near-universal screening means that many more cancers are detected at an in situ stage, and are removed before they become invasive. This has led to a dramatic decline in the incidence of invasive cancers.20–22 There is mounting evidence from other countries with near-universal screening programmes that the invasive cancers that are now identified tend to occur in women who have not attended screening, or to be particularly aggressive cancers with poor prognosis.22–26 Given the improvement in multidisciplinary team working and chemotherapeutic advances for cervical cancer since the 1990s it is more likely that screening rather than treatment explains the plateau in survival for this cancer.19
The results of this study show clear geographical inequality in survival. Cancer networks that had consistently low outlying survival estimates compared with the England estimates were clustered across northern England and the East Midlands, while results for southern and western cancer networks were more consistently comparable with, or above, the England estimates. This broadly confirms the findings of previous studies that have pointed to the north–south divide in cancer survival in England.5 6 27 28
The largest increase in the proportion of cancer networks that were low outliers occurred in the period 2001–6, following the NHS National Cancer Plan. This increase was observed in men only. Three of the four cancers in men were poor prognosis cancers, compared with three of the six in women, and it is possible that this played a role in the sex difference observed here. To explain why the proportion of low outliers increased for men but not women, it is also worth noting that women had a higher degree of variation at baseline for at least two cancers: the IQR for cancers of the oesophagus and colon was considerably higher in women (table 3).
The lack of a significant reduction in geographical inequalities in cancer survival following the NHS National Cancer Plan echoes previous research showing there has been little or no reduction in the deprivation gap in short-term survival by socioeconomic status in England in this period.29
Given the large rise in overall survival, however, it is notable that the geographical inequalities have not widened more significantly, as shown by the rather stable proportion of cancer networks that were low survival outliers over time. Furthermore, even though the number of lower outliers remained stable over time, the distribution of these outliers has shifted, leading to a less-pronounced north–south divide in survival.
Although regional disparities in survival from most of these cancers did not fall over time, breast cancer is the exception, with a distinct convergence of the cancer network-specific survival estimates around the England value in the later period. The reduced variation can partly be explained by the fact that 1-year survival from breast cancer in 2001–6 is reaching the ceiling of 100%. Even accounting for this, it is clear that variation reduced, as can be seen by the relatively small number of outliers outside the (very narrow) control limits on the funnel plots in the final period. This is an important finding given that the improving outcomes guidance (IOG) issued in the mid-1990s was implemented earliest for this cancer. Multidisciplinary team working was universally established for breast cancer by the time it was assessed by the Audit Commission in 2001. At that time, implementation of the IOG for lung, bowel and the gynaecological cancers was uneven across the country.30
If this reasoning is correct, it may be hypothesised that the reduction in geographical inequalities for breast cancer may soon be followed by a similar convergence in regional survival for other cancers, provided the guidance issued in the manual for cancer services 31 (which has now replaced the IOG) is implemented with the same dedication and with equivalent resources as for breast cancer. We may even predict that regional disparities in survival from bowel cancer will similarly decline in the near future, since the National Cancer Peer Review of 2004–7 established that multidisciplinary teams in this sector had caught up with the breast cancer standard.32
A further issue to consider is the impact of screening on regional variation in survival through earlier diagnosis. Three of the six cancers included in this analysis were the subject of screening programmes. National programmes of cervical and breast cancer screening were effective throughout this study period, and two rounds of the colorectal screening pilot were conducted in 2000 and 2003–5 in some primary care trusts (PCT) in the Arden cancer network (N12).
Given that the proportion of eligible women attending screening for cervical cancer has remained stable since the late 1990s at over 80% in nearly 90% of health authorities,21 it is unlikely that the screening programme was responsible for the reduction in geographical inequalities in survival during 1991–2006.
Breast cancer screening expanded during the period of study in terms of the number of eligible women reached and the definition of eligible women. By 2006, coverage was over 70% of eligible women in 90% of PCTs and screening was contributing to the reduction of breast cancer mortality.33 34 However, less than one third of invasive breast cancers are screen detected.35 It is therefore unlikely that expansion of the screening programme played an important role in rising regional equality in breast cancer survival.
The colorectal screening pilot was rolled out in several PCT in the Coventry and Warwickshire area in 2000 and 2005–7. These PCT became part of the Arden cancer network when it was formed in 2002.36 Survival from cancer of the colon did improve very slightly in Arden relative to other cancer networks between 1996–2000 and 2001–6, but so did survival for patients with lung cancer and in women with oesophageal and cervical cancer. It is too early to say whether the launch of the national bowel cancer screening programme in 2007 will reduce geographical inequalities in survival.37
It is unlikely that variation in the quality of registration data has contributed to the regional inequalities identified in cancer survival, at least since the mid-1990s. Registration quality in England is determined by cancer registries (of which there are eight) rather than cancer networks. The annual reports of the United Kingdom Association of Cancer Registries show that quality is relatively homogenous between the registries today (with the exception of bladder cancer, see below).38 The proportion of eligible patients excluded from analysis through the quality control conducted for this analysis was largely driven by the number of DCO registrations and patients with zero survival (making up 80.7% of all exclusions). We showed in table 4 that this proportion was indeed correlated with survival in 1991–5, but not in the later calendar periods, and that regional diversity in the proportion of DCO has decreased.
The cancer sites included in this study were those incorporated for survival analysis in the annual compendium of clinical and health indicators for public health monitoring in England.39 Bladder and prostate cancer are also included in those indicators but were excluded here. Results for bladder cancer were excluded because wide changes in pathological coding, and diversity between cancer registries in the implementation of those changes, have led to non-interpretable trends in survival. Age-standardised survival from prostate cancer proved to be very difficult to estimate because of small numbers of deaths in some age groups at the cancer network level, so results were not reported.
We acknowledge that presenting data grouped by calendar period disguises fluctuations in trends and may not accurately portray the timing of change; however, the small sample sizes in the analysis by cancer network precluded the estimation of annual relative survival. Further methodological developments are in progress to enable age standardisation for small populations, in order that survival estimates can be produced for sparse data.5
What is already known on this subject
There is a north-south divide in cancer survival in England, with lower survival in the north. Policy changes under the Labour Government, including the NHS Cancer Plan (2000), aimed to reduce geographic inequality in survival. It is necessary to assess whether these policy changes have reduced geographic inequality in survival in England. This study uses the most suitable unit for analysis: cancer networks, which were formed to oversee the process.
What this study adds
There has been a lessening of the north-south divide in cancer survival but the overall level of geographic inequality has remained stable despite policy change. Breast cancer is the exception, showing a reduction in geographic variation in survival. If guidance is implemented with the same consistency for other cancers, geographic inequality in cancer survival may similarly decline.
Acknowledgments
The authors would like to thank the GIS team at the West Midlands Cancer Intelligence Unit for supplying the cancer network digital boundary information and the staff of the English cancer registries for collecting the data on which this analysis is based.
References
Footnotes
Funding This study was funded by the National Cancer Intelligence Network, National Cancer Research Institute (NCRI), 18th Floor, Portland House, Bressenden Place, London SW1E 5RS.
Competing interests None.
Ethics approval This study was conducted with the approval of the ONS Medical Research Service (MR1101, 20 November 2007). Patient Information Advisory Group (PIAG; now the Ethics and Confidentiality Committee of the National Information Governance Board) under Section 61 of the Health and Social Care Act 2001 (PIAG 1-05(c)/2007, 31 July 2007).
Provenance and peer review Not commissioned; externally peer reviewed.