Article Text

Abstract
Background Gains in life expectancies have stalled in Scotland, as in several other countries, since around 2012. The relationship between stalling mortality improvements and socioeconomic inequalities in health is unclear.
Methods We calculate the difference, as percentage change, in all-cause, all-age, age-standardised mortality rates (ASMR) between 2006 and 2011 (period 1) and between 2012 and 2017 (period 2), for Scotland overall, by sex, and by Scottish Index of Multiple Deprivation (SIMD) quintile. Linear regression is used to summarise the relationship between SIMD quintile and mortality rate change in each period.
Results Between 2006 and 2011, the overall ASMR fell by 10.6% (138/100 000), by 10.1% in women, and 11.8% in men, but between 2012 and 2017 the overall ASMR fell by only 2.6% (30/100 000), by 3.5% in women, and by 2.0% in men. Within the most deprived quintile, the overall ASMR fell by 8.6% (143/100 000) from 2006 to 2011 (7.2% in women; 9.8% in men), but rose by 1.5% (21/100 000) from 2012 to 2017 (0.7% in women; 2.1% in men).The socioeconomic gradient in ASMR improvement more than quadrupled, from 0.4% per quintile in period 1, to 1.7% per quintile in period 2.
Conclusion From 2012 to 2017, socioeconomic gradients in mortality improvement in Scotland were markedly steeper than over the preceding 6 years. As a result, there has not only been a slowdown in overall reductions in mortality, but a widening of socioeconomic mortality inequalities.
- deprivation
- socioeconomic
- mortality
- inequalities
- health inequalities
This is an open access article distributed in accordance with the Creative Commons Attribution Non Commercial (CC BY-NC 4.0) license, which permits others to distribute, remix, adapt, build upon this work non-commercially, and license their derivative works on different terms, provided the original work is properly cited, appropriate credit is given, any changes made indicated, and the use is non-commercial. See: http://creativecommons.org/licenses/by-nc/4.0/.
Statistics from Altmetric.com
Introduction
Improvements in mortality in Scotland have slowed in recent years, as in a number of other high-income countries.1–3 The most recent published data (2015–2017) showed that life expectancy fell by 0.1 years for both men and women, compared with the previous period.4 Scotland has the lowest level of life expectancy in Western Europe, and absolute inequalities in premature mortality have increased since 2013.5 6
High levels of socioeconomic inequality in mortality have been suggested as an explanation for why overall life expectancy in Scotland has historically lagged behind comparable countries.7 The degree to which the recent stalling improvement in mortality rates is associated with changes in health inequalities is unclear.
Age-standardised mortality rates (ASMRs) permit comparison of mortality risks across time and place. National Records of Scotland (NRS) publish aggregate data on ASMRs by population quintile, as ranked by Scottish Index of Multiple Deprivation (SIMD).8 9 We used these recently published aggregate data to provide a preliminary analysis of whether changes in mortality in Scotland vary by deprivation in a recent 6-year period of stalling improvements (2012–2017) compared with the preceding 6 years (2006–2011).
Methods
Published all-cause ASMRs (using European standard population 2013) for Scotland by SIMD quintile (SIMD quintiles were assigned according to the version of SIMD most relevant to the year in question. Years 2001–2003 use SIMD04, 2004–2006 use SIMD06, 2007–2009 use SIMD09, 2010–2013 use SIMD12 and 2014 onwards use SIMD16), for men and women of all ages, were downloaded from the NRS website.8 This data release does not include count data, which limited the analytical approaches available. Data from 2012 onwards were considered to represent the recent period of slower mortality improvement on the basis of analysis in England which identified a breakpoint in mortality trends in the early 2010s, and our replication of this analysis for Scotland which found a contemporaneous breakpoint.10
The percentage change in ASMRs between 2006 and 2011 (period 1) and between 2012 and 2017 (period 2), by sex, overall for Scotland, and by SIMD quintile, was calculated from the absolute difference between start and end years. This was expressed as a percentage of the start year rate (percentage change) to support clear presentation and interpretation, and to account for the large range of mortality rates between deprivation categories. This range means that absolute changes are difficult to interpret in terms of their proportional effect on mortality risk.
To assess inequalities in mortality changes, we regressed the percentage ASMR change against SIMD quintile (as a continuous variable) using linear regression for both periods. The gradient provided an indication of the average increase in percentage improvement with each move up one quintile, and the intercept a prediction of the change in the most deprived quintile.
A technical appendix (see online supplementary file 1) provides details of calculations and code.
Supplemental material
Results
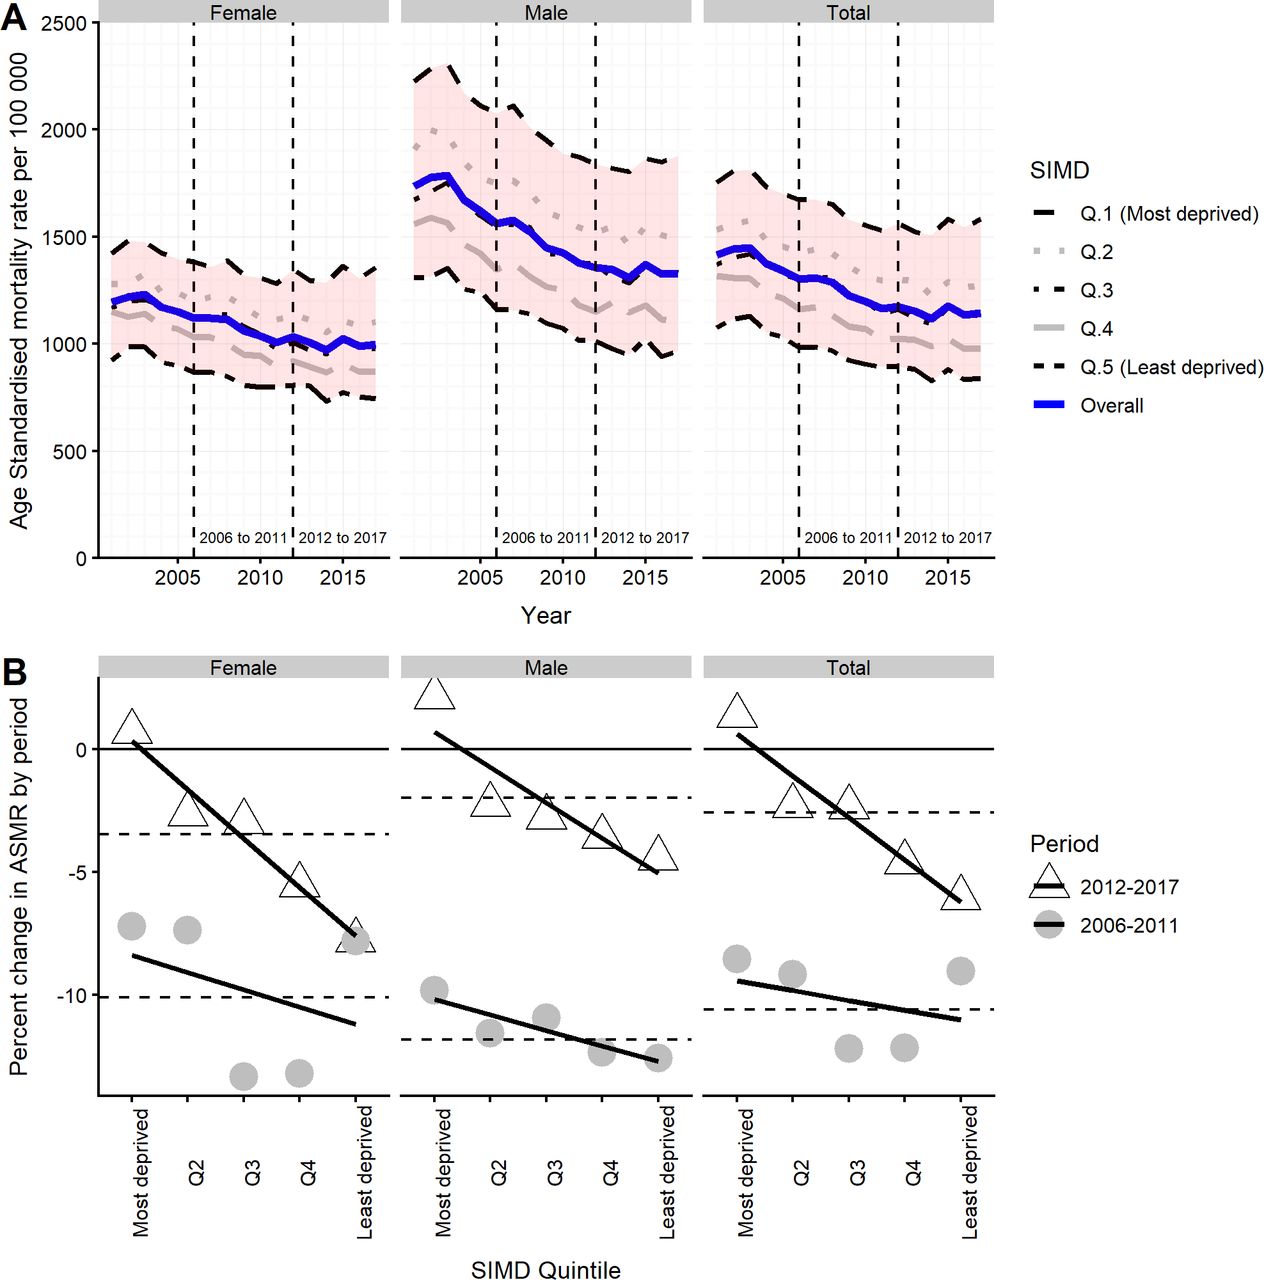
Between 2001 and 2017, the overall ASMR fell from 1415 to 1143/100 000 (1195 to 997/100 000 for women; 1735 to 1329/100 000 for men), and in all deprivation quintiles, as shown in figure 1A. Between 2006 and 2011, the overall ASMR fell by 10.6% (138/100 000), by 10.1% for women and 11.8% for men. Between 2012 and 2017, ASMRs changed much less, falling by 2.6% overall (30/100 000), by 3.5% in women, and 2.0% in men.
(A) All-cause ASMRs, Scotland, 2001–2017, by sex and SIMD quintile. (B) Percentage change in ASMR by period (2006–2011; 2012–2017) by sex and SIMD quintile. Horizontal dashed lines indicate average change in Scotland by period and sex. ASMRs, age-standardised mortality rates; SIMD, Scottish Index of Multiple Deprivation.
ASMR improvements were smaller in the later than earlier period in all deprivation quintiles, except the least deprived females (see figure 1B and table 1). Observed mortality rates were higher in 2017 than in 2012 for the most deprived quintile (note, we were unable to derive CIs for rates in the absence of count data). In both periods, the most deprived SIMD quintile (1) saw the smallest mortality improvements. Figure 1B shows the relationship between percentage change in mortality rate and SIMD quintile, for the two periods. This shows that there is a steeper socioeconomic gradient in mortality improvement in period 2 than in period 1. Among men, there is a gradient across quintiles in both periods, but among women the relationship in the period one is U-shaped, with the most and least deprived groups having smaller mortality improvements than quintiles 3 and 4.
Percentage and absolute change in ASMR for two time periods (2006–2011 and 2012–2017) by sex, SIMD quintile (Q), and results of linear model
The gradient of the linear model can be considered a measure of the importance of the socioeconomic gradient to mortality changes. This increased markedly, from 0.4% per quintile in period 1, to 1.7% per quintile in period 2 (ratio of gradients 4.25; difference in gradients 1.3%). The change in ratio of gradients was steeper for women (16.5) than for men (2.3), and the difference in gradients was greater for women (1.3%) than men (0.8%).
The intercept indicates the percentage change in the most deprived quintile (1) predicted by the linear models. The model-predicted values for this quintile (third column of table 1 and figure 1B) are more favourable than the observed values; therefore, the 95% CIs of the intercepts do not necessarily provide an adequate proxy measure of uncertainty in observed mortality rates in this quintile.
Discussion
This paper shows that from 2012 to 2017 mortality improvement in Scotland was much more modest than over the preceding 6 years, that mortality rates increased in the most deprived fifth of areas and that improvements also slowed markedly in less deprived areas. The socioeconomic gradient in recent mortality rate change is steepest among women. The percentage change results suggest that the slowdown in overall mortality improvement was associated with a steeper socioeconomic gradient in mortality change. However, the analyses of absolute changes, and the fact that some regression coefficients crossed zero, highlight the need for further assessment of these trends.
Our results are similar to findings from England, which found that the life expectancy gap between the most deprived and least deprived deciles increased between 2001 and 2016 and that life expectancy fell for women in the most deprived quintile.11 Cause of death analysis was beyond the scope of this short report, but age and cause decomposition of the life expectancy inequality observed in England in 2016 indicated a broad range of causes across the life-course, including respiratory disease, ischaemic heart disease, lung cancer and neonatal deaths.11 A similar approach to contributors to overall life expectancy change between 2011 and 2016 found that reduced improvements in cardiovascular mortality, and deaths from dementia and respiratory disease were important.12
The use of routinely published mortality data allowed us to undertake a timely assessment of recent changes by deprivation. The use of these data did, however, restrict the analyses we were able to undertake, as we did not have access to count data. Further analyses using such data should seek to calculate the uncertainty around rate changes, and could apply alternative approaches, such as count-based modelling. The model regression coefficients presented are based on five data points per population and period, and so the CIs should be interpreted with appropriate caution. The use of all-cause ASMR may mask potentially important interactions between sex, age, deprivation and cause of death. For example, in England, research found that the socioeconomic gradient in mortality among young adult men is smaller than at other ages. However, most age groups and major causes of death follow the pattern displayed by all-cause ASMRs.13
This paper analysed changes in ASMRs by SIMD quintile. Further research should be conducted to test the dependence of findings on choice of health outcome and socioeconomic variable. The SIMD includes a health domain, raising the possibility of circularity in the analysis; however, the overall index is very highly correlated with the income–employment domains which might be used to address this concern. Area-based deprivation analyses in Scotland have previously been found to misclassify a proportion of people who are individually deprived.14 The consequence of such misclassification is to underestimate inequalities compared with individual measures. An updated assessment of the extent of misclassification in Scotland would be welcome.
The selection of comparison periods is important, and the use of 2012–2017 for the latter period is justified by analyses demonstrating a change in mortality trends around 2012. Our analyses assess mortality rate change between the first and last year for each period, which might raise concerns if either of these years were atypical. For this reason, a sensitivity analysis comparing values modelled on the trend of rates across the 6 years of each period was conducted. This produced qualitatively similar conclusions (see online supplementary file 2: sensitivity analysis, and online supplementary figure 1B).
Supplemental material
Supplemental material
Further research is needed to investigate the drivers of recent adverse mortality trends, and the interaction between stalling mortality improvements and health inequalities. Research to further characterise and explain recent aggregate trends should incorporate consideration of the importance of socioeconomic inequalities within proposed explanations.
We have shown that stalling mortality improvements have occurred across the whole population of Scotland, but are most acute in the most socioeconomically deprived areas. The identification of this important inequalities aspect to recent mortality trends highlights the need for policymakers to develop responses which seek to undo the fundamental causes of inequality, and which are also proportionate to need, in terms of access to key public services for care and prevention.
What is already known on this subject
Improvements in mortality rates slowed markedly around 2012 in Scotland and a number of other high-income countries.
Scotland has large socioeconomic health inequalities, and the absolute gap in premature mortality between most and least deprived has increased since 2013.
The relationship between stalling mortality improvements and socioeconomic inequalities in health is unclear.
What this study adds
A slowdown in mortality improvement has occurred across the whole population of Scotland, but is most acute in the most socioeconomically deprived areas.
Mortality rates in the most deprived fifth of areas were higher in 2017 than in 2012.
Research to further characterise and explain recent aggregate trends should incorporate consideration of the importance of socioeconomic inequalities within proposed explanations.
Footnotes
Contributors LF and JM drafted the manuscript and undertook the analyses. All authors made substantial contributions to editing the manuscript and approved the final draft.
Funding The authors have not declared a specific grant for this research from any funding agency in the public, commercial or not-for-profit sectors.
Competing interests None declared.
Patient consent for publication Not required.
Provenance and peer review Not commissioned; externally peer reviewed.