Article Text

Abstract
Background Reducing health inequalities requires interventions that work as well, if not better, among disadvantaged populations. The aim of this study was to determine if the effects of price discounts and tailored nutrition education on supermarket food purchases (percentage energy from saturated fat and healthy foods purchased) vary by ethnicity, household income and education.
Method A 2×2 factorial trial of 1104 New Zealand shoppers randomised to receive a 12.5% discount on healthier foods and/or tailored nutrition education (or no intervention) for 6 months.
Results There was no overall association of price discounts or nutrition education with percentage energy from saturated fat, or nutrition education with healthy food purchasing. There was an association of price discounts with healthy food purchasing (0.79 kg/week increase; 95% CI 0.43 to 1.16) that varied by ethnicity (p=0.04): European/other 1.02 kg/week (n=755; 95% CI 0.60 to 1.43); Pacific 1.20 kg/week (n=101; 95% CI 0.06 to 2.34); Māori −0.15 kg/week (n=248; 95% CI −1.10 to 0.80). This association of price discounts with healthy food purchasing did not vary by household income or education.
Conclusions While a statistically significant variation by ethnicity in the effect of price discounts on food purchasing was found, the authors caution against a causal interpretation due to likely biases (eg, attrition) that differentially affected Māori and Pacific people. The study highlights the challenges in generating valid evidence by social groups for public health interventions. The null findings for tailored nutritional education across all social groups suggest that structural interventions (such as price) may be more effective.
- Diet
- diet RB
- ethnic CG
- ethnic groups
- health education
- household income
- inequalities
- inequalities SI
- interventions
- price discounts
- randomised trials
- social class
- socioeconomic
- educational qualification
Statistics from Altmetric.com
- Diet
- diet RB
- ethnic CG
- ethnic groups
- health education
- household income
- inequalities
- inequalities SI
- interventions
- price discounts
- randomised trials
- social class
- socioeconomic
- educational qualification
Introduction
Good diet and nutrition are essential to good health.1–3 Important differences in dietary patterns and nutrient intakes between different socioeconomic and ethnic groups lead to health disparities.4–8 In New Zealand, 47% of all deaths in Māori (indigenous people) versus 39% of all deaths in non-Māori in 1997 were attributed to nutrition-related risk factors.8 In order to improve population nutrition and reduce inequalities, interventions must be as, if not more, effective among disadvantaged populations.
It is well-established that socioeconomic factors influence food purchases and consumption.4 9–11 Price is reported to be one of the main barriers to increased consumption of healthier foods, especially fruit and vegetables.4 11 12 Unhealthy, energy-dense foods are generally substantially cheaper per calorie than more healthy less energy-dense foods. The lower cost of an energy-dense and micronutrient poor diet is plausibly a key mechanism whereby lower socioeconomic groups have worse diets, or put another way a high household income facilitates a healthier diet directly through improved affordability.13 A 10% decrease in the price of fruit and vegetables might increase purchasing by approximately 6–7%, with tentative evidence that price elasticity is greater among lower socioeconomic groups.14 “Most, but not all, studies have shown that financial incentives to improve nutrition are effective to some extent.12 15 16 However, recent reviews of the effectiveness of financial incentives have consistently found an under-representation of disadvantaged populations in studies, prohibiting firm conclusions on whether financial incentives work at least as well among disadvantaged populations.12 17 18
Diet also varies by educational level and understanding of nutrition.5 6 11 Educational interventions to improve dietary habits have had some, albeit variable, success. In general, individually tailored and interactive approaches are more effective than population-wide generic education or simple dissemination of information.19–21 The current evidence suggests that tailored nutrition education (ie, education tailored to recipients characteristics such as ethnic group or dietary habits) is effective for different ethnic and income groups,21 22 but few studies to specifically address this question have been conducted.
The Supermarket Healthy Options Project (SHOP) recently conducted in New Zealand provides an opportunity to understand how price discounts and tailored nutrition education affect supermarket food purchases among different ethnic and socioeconomic groups. SHOP was a large randomised controlled trial (N=1104) in which food purchase data were collected prospectively using individualised supermarket electronic scanner sales data. The nutrition education resources used in the trial were developed separately for Māori, Pacific people, and non-Māori non-Pacific people.23 The results of the SHOP trial for the study population as a whole have been reported previously 24 (and are summarised in the ‘All participants’ columns of tables 2 and 3). Briefly, neither a 12.5% price discount on healthier foods nor tailored nutrition education had a significant effect on the primary outcome, change from baseline in percentage energy from saturated fat (PESF) in supermarket food purchases, at the completion of the 6-month intervention phase. However, the increase from baseline in the amount of healthier foods purchased was significantly greater at completion of the intervention phase for participants who received price discounts compared with those who did not receive discounts (0.79 kg/week, 95% CI 0.43 to 1.16).
The aim of this paper is to present preplanned subgroup analyses of the effects of the SHOP interventions by ethnicity, income and educational qualifications, in order to provide information about equity impacts of price discounts and tailored nutrition education on food purchasing.
Methods
Study design
The design of the SHOP trial has been described in detail previously.23–26 Briefly, the trial was a 2×2 factorial randomised controlled trial with a 12-week baseline period, a 24-week intervention period and a 24-week follow-up phase. Eligible participants were randomly assigned to one of the following four intervention arms: (i) price discounts (12.5%) on healthier supermarket foods, (ii) tailored nutrition education promoting purchase of healthier supermarket foods, (iii) a combination of price discounts and tailored nutrition education, or (iv) control (ie, no intervention).
Individualised food purchasing data were collected through a handheld barcode scanner system that registered shoppers used to self-scan their groceries. Food purchase data were linked to a nutrient database to calculate the purchases of foods and nutrients by a participant.26 A modified version of the Heart Foundation Tick nutrient profiling criteria was used to classify the 3000 top-selling foods as healthier (n=1032; 35%) or less healthy.27
Participants and recruitment
To be eligible for the study, participants had to be either existing users of the handheld scanner system or willing to sign up and use the system for the duration of the trial. Most study participants were recruited through mailouts to randomly selected existing registered scanner users. In addition, targeted in-store and community-based recruitment strategies involving Māori and Pacific recruiters were used to encourage participation of Māori and Pacific peoples, as described elsewhere.24 25 Briefly, sufficient numbers of European/other were recruited directly from the list of existing users of the scanner system. However, this was not the case for Māori and Pacific people for two reasons. First, a low proportion of scanner users were Māori and Pacific. Second, the list of users did not state ethnicity, precluding directly targeted recruitment. Thus, we had to first recruit Māori and Pacific people to use the scanner system to be eligible for the study. This in turn resulted in greater attrition of Māori and Pacific shoppers during the study, as they were not established scanner users.
Interventions
Study participants randomised to receive discounts were mailed a printed list of discounted foods at the commencement of the 24-week intervention period. The price of all eligible healthier food products was automatically discounted by 12.5% when participants randomised to receive discounts scanned their personalised card at the checkout during the intervention.
Study participants randomised to receive tailored nutrition education were mailed a printed package of food-group-specific information monthly during the 24-week intervention. The tailored nutrition education intervention was developed using a participatory approach involving input from Māori and Pacific communities.23 Māori and Pacific participants were additionally offered group education sessions.28 All participants randomised to education received individualised computer-generated tailored feedback and shopping lists promoting brand-specific healthier substitutions for ‘less healthy’ supermarket foods usually purchased by the participant (based on baseline electronic supermarket sales data).26 Generic supportive resources, including recipes and recommended serving sizes, were also provided.
Outcomes
Change from baseline in PESF contained in supermarket food purchases at the completion of the 6-month trial intervention phase was the primary trial outcome. Secondary outcomes in the main study analysis included: change from baseline in other nutrients at 6 months (total fat, protein, carbohydrate, energy density, sodium and sugar); change in quantities of healthier foods purchased (by weight) at 6 months; and changes at 12 months of follow-up for the same variables. In order to minimise chance findings arising from a large number of comparisons, in this paper we only tested for a differential effect of intervention by ethnicity or socioeconomic status (income, education) for the primary outcome, and the only secondary outcome to show any effect in the main study (healthier foods purchased by weight (kg/week)).24 For all analyses, ‘all food’ refers to the 3000 top-selling foods/non-alcoholic beverages, and ‘healthier’ foods refers to the 1032 foods that were classified as healthier and eligible for discounts (excluding non-core foods, sport supplements and baby foods).
Statistical analysis
Study participants were classified by the ethnicity that they most identified with: Māori, Pacific, or non-Māori non-Pacific (majority European, and hereafter referred to as European/other). Income group was defined by the pre-tax household income in the household: high >NZ$60 000/year, low <NZ$60 000/year, or declined to answer. Education was grouped as: (i) none/secondary school, or (ii) higher education (university/polytechnic degree or diploma, trade certificate or other). Randomisation was stratified by ethnicity and income in order to balance the number of participants within each stratum between treatment arms.
All randomised participants who provided shopping data for the 12-month study period were included in an intention-to-treat analysis. On the assumption that data were missing at random, no imputation was used.
A repeated measures analysis with two observations per participant (end of intervention and end of follow-up) was conducted using a mixed model to estimate the effects of the interventions in terms of differences in mean change from baseline between intervention arms. Since there was no statistically significant interaction, the two interventions were analysed separately as is standard practice, that is (i) price discount (price discount only group plus combined intervention group vs control group plus nutrition education only group), and (ii) nutrition education (nutrition education only group plus combined intervention group vs control group plus price discount only group). Prespecified potential confounding factors adjusted for in the regression model were baseline measures of food and nutrients, ethnicity, household income, age and sex.
The significance of interaction with social groups was evaluated separately for the intervention (0–6 months) and follow-up (6–12 months) periods using the analysis of covariance regression (ANCOVA). Using ethnicity as an example, the treatment by ethnicity term in the ANCOVA model, and its accompanying p value, provided the statistical test of interaction.
All analyses were carried out using SAS version 9.1.3 (SAS Institute, Cary, North Carolina, USA), and R version 2.8.1 (R Foundation for Statistical Computing, Vienna, Austria). Statistical tests were two-sided with a 5% significance level.
Results
Table 1 shows the distribution of the randomised participants by ethnic and socioeconomic group. At baseline, Pacific people were more likely to shop at two or more other supermarkets (53%) than either Māori or European/other (both 38%). Maori and Pacific shoppers were one and a half to two times more likely than European/other to buy food from non-supermarket outlets, for example dairies (corner stores) or service stations, markets, fruit and vegetable shops, and superettes/conveniences stores (mini marts).
Baseline characteristics and group allocation by ethnicity, income and education, and loss to follow-up in during 6-month intervention phase
Summary of overall intervention effect for price discounts and tailored nutrition education, and any interaction of the intervention effect with social group (ethnicity, household income, educational qualification)
Estimates of effect of price discounts (n=513) versus no price discounts (n=515) on mean change from baseline in nutrient and food purchases by ethnicity†
The amount of food purchased at the supermarkets included in this study was highest among European/other (14.5 kg/week), intermediate among Māori (11.3 kg/week), and lowest among Pacific people (9.9 kg/week). The percentage of this total food shopping that was healthier also varied by ethnicity: 57% for European/other, compared with 44% for Māori, and 44% for Pacific people. At baseline, Māori shoppers had higher PESF in total purchases (15.7%, SD 5.1%) than Pacific (14.1%, 4.5%) and European/other (14.4%, 3.8%).
The numbers of Pacific (101) and Māori (248) randomised were less than the targeted 400 each, for many reasons as presented elsewhere.25 There was also loss to follow-up post-randomisation: 76 people had no shopping data in the 6 months intervention phase, and this was more common among Māori (17%) and Pacific people (16%) than European/other (3%; table 1).
Table 2 shows the main study findings for all participants combined (as reported elsewhere 24), and p values for interactions of these main effects by social groupings. For all participants combined, there was no effect of tailored education on either saturated fat or healthier food purchasing, but there was a significant effect of price discounts on healthier food purchasing. Those receiving price discounts purchased 0.79 kg (95% CI 0.43 to 1.16) more per week than controls during the intervention period, with some persistence in the follow-up period (0.38 kg, 95% CI 0.01 to 0.76). Of the 12 interactions tested for during the 6-month intervention phase, the two involving price discounts by ethnicity had p values less than 0.05. (One additional interaction in table 2 had a p value of 0.04, but given it was only for the follow-up in the context of multiple comparisons, we treated it as a chance finding.) Beyond price discount effects by ethnicity in the first 6 months, there was no clear or meaningful patterns in any of the other interactions.
Given the significant main effect of price discounts on purchasing, and the interaction with ethnicity, more detailed results are shown in table 3 and figure 1. The ‘All participants’ column in table 3 is as previously reported.24 The interaction with ethnicity on PESF in the first 6 months (p=0.02) is such that the reduction from price discounts among European/other (−0.34%) had a 95% CI ranging from −0.75% to 0.06%. However, CIs for the change in PESF for Māori and Pacific people were wide and substantially overlap with each other, European/other and the combined overall effect (figure 1).

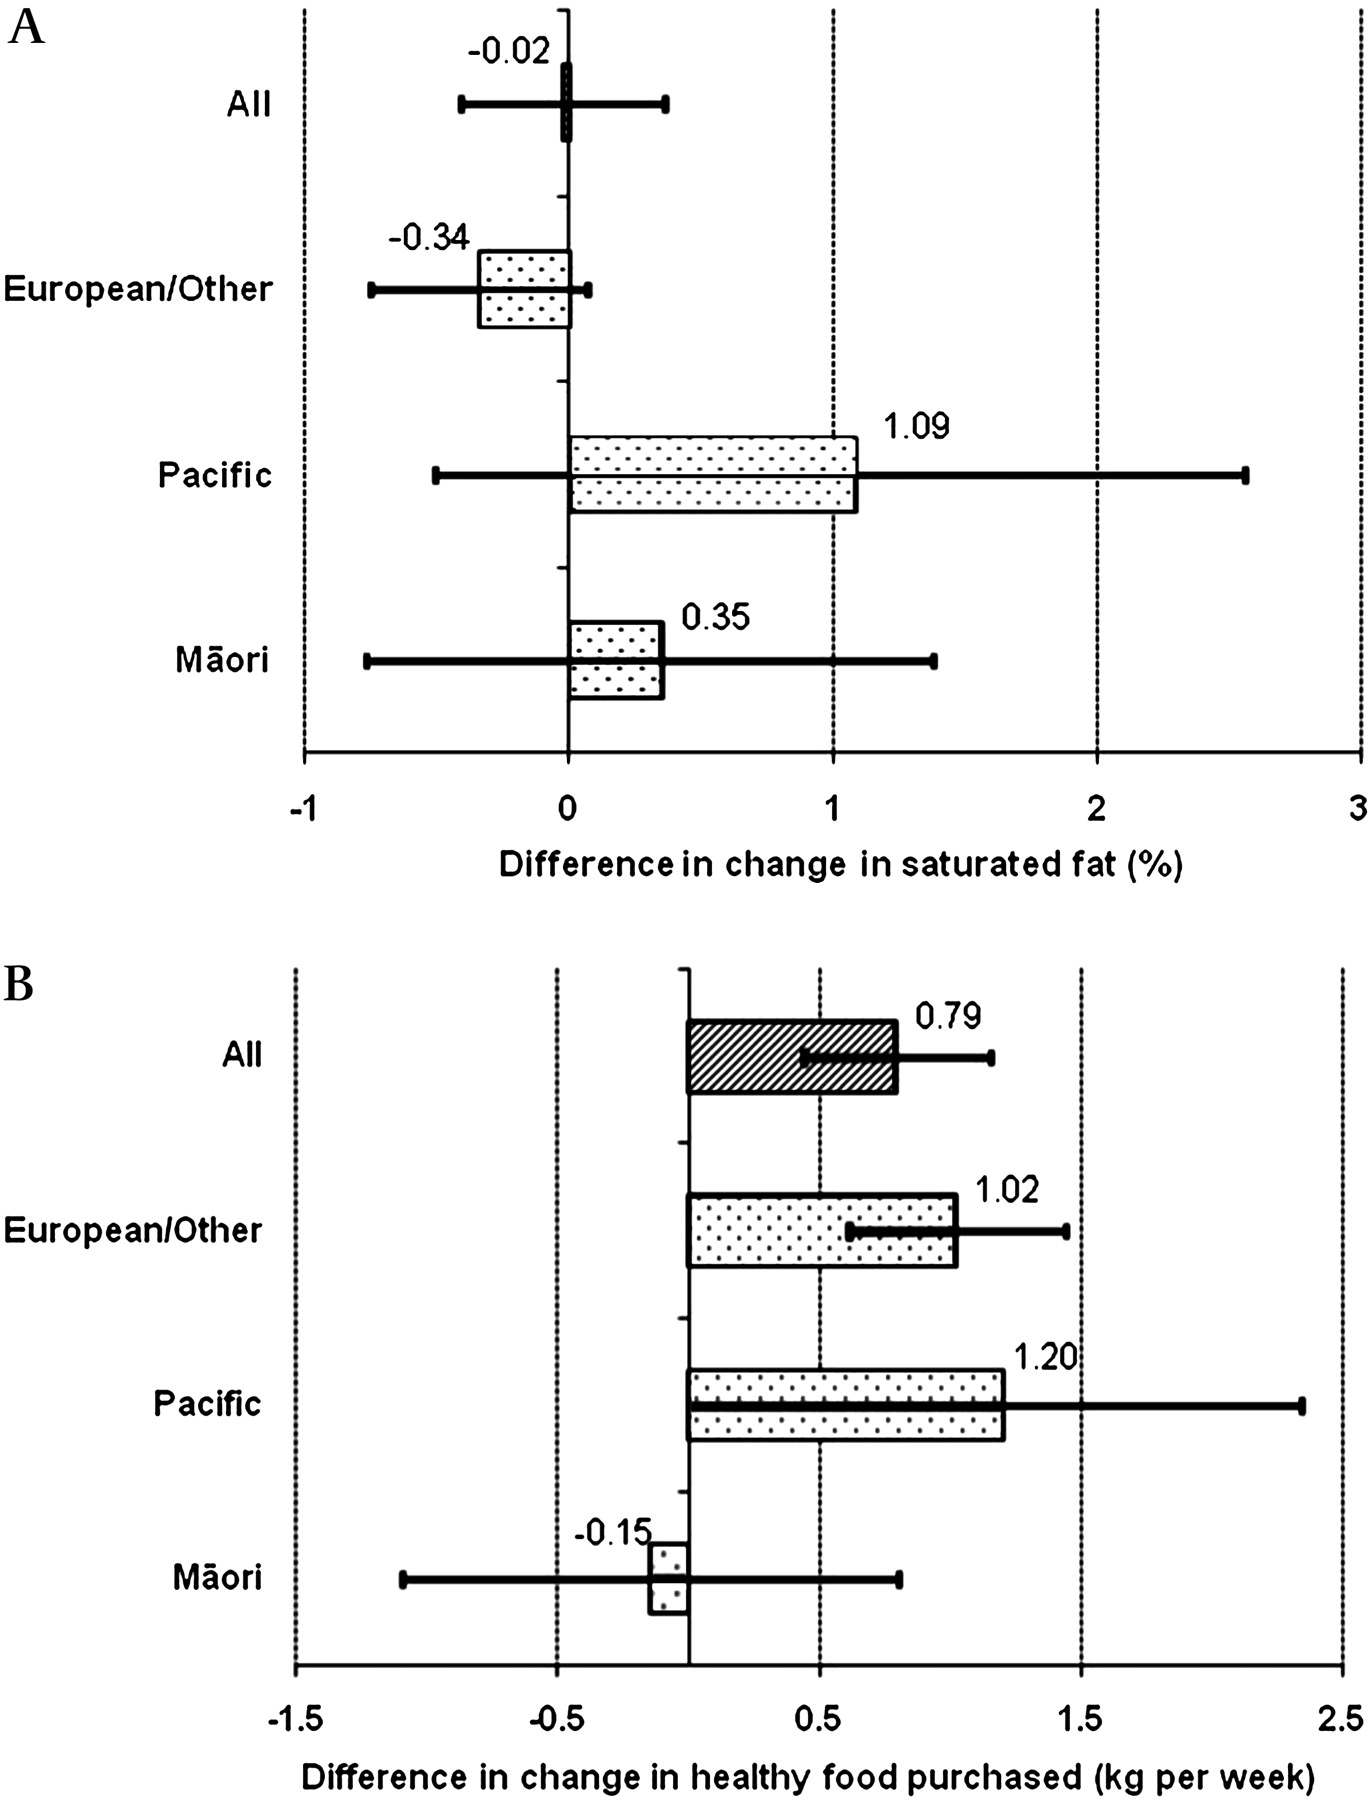
Effect sizes of price discounts by ethnicity on: (A) saturated fat, and (B) healthy food purchasing.
The interaction of price discounts with ethnicity on healthier food purchasing in the first 6 months (p=0.04) is such that there were statistically significant increases among European/other (1.02 kg/week, 95% CI 0.60 to 1.43) and Pacific (1.20 kg/week, 95% CI 0.06 to 2.34), but not among Māori (−0.15 kg/week, 95% CI −1.10 to 0.80)—although it must be noted that the CIs between all three ethnic groups overlap (figure 1). The patterns observed for all healthier foods were replicated for the healthier fruit and vegetables subgroup.
Discussion
We found little evidence of variation in intervention effects by ethnic and socioeconomic groups, except by ethnicity for the effect of price discounts on healthier food purchasing (p=0.04 for interaction) and PESF (p=0.02) in the first 6 months. First, European/other had a 1.02 kg/week (95% CI 0.60 to 1.43) increase in healthier food purchases, Pacific had a 1.20 kg/week (0.06 to 2.34) increase, and Māori had a 0.15 kg/week decrease with 95% CI values including the null (−1.10 to 0.80). Second, European/other receiving price discounts had a 0.34% decrease in saturated fat with 95% CI values just including the null (−0.75% to 0.06%). Pacific and Māori people had increases in PESF, although with wide CIs that comfortably included the null, and overlapped with European/other (figure 1).
Strengths and limitations
The strengths of this randomised trial include its relatively large size, including moderately sized diverse education and household income groups. The study was undertaken in a real-life setting and employed precise objective collection of food purchasing outcome data (ie, electronic supermarket sales data). The tailored nutrition education intervention was culturally specific and developed using a participatory approach, strengthening the confidence of a true null finding. For the main analysis, several sensitivity tests of possible threats to the internal validity of the price discount finding (eg, that shoppers allocated to price discounts simply shifted more of their total shopping to eligible supermarkets with no net improvement in healthy food purchasing) suggested our overall study findings were robust.24 However, there were insufficient numbers to conduct these sensitivity analyses separately by socioeconomic and ethnic groups.
We encountered many challenges that threaten robust comparisons across subpopulations (especially ethnicity). First, the numbers of Māori and Pacific people randomised (248 and 101) were substantially less than our targeted 400 each. Consequently, CI values were wide. Some variations in effects might also be considered inconsistent (eg, Pacific people in the price discount groups had an increase in the proportion of saturated fat purchased of 1.09% (95% CI −0.38% to 2.56%), despite a concomitant increase in healthier food purchasing (95% CI 0.06% to 2.34%; table 3), although a case could be made for increased purchasing of fatty foods being permitted by savings on healthy foods.
In addition to chance variations, systematic biases that differed by subpopulation may have affected our results. For example, an attrition or selection bias may have occurred due to most of the recruited Māori and Pacific shoppers being new to the use of the electronic scanner (compared with European/other who were all existing users).29 As a consequence, attrition was higher for Māori (17% had no shopping data in the intervention phase) and Pacific people (16%) compared with European/other (3%) (table 1). (The volume of food purchases overall (ie, before considering healthy vs unhealthy) also fell more among Māori (15.1%) and Pacific people (8.8%), compared with European/other (3.3%), for the 6-month intervention compared to baseline.) We did not use imputation or other missing data methods to address possible resultant selection bias 30, as complete shopping events were missing (eg, due to forgetting to use the card) not just occasional variables (eg, fruit and vegetables missing, but PESF present). Our analysis therefore assumes that data were missing at random, given the adjusted covariates; however, this may not be a plausible assumption.
Additionally, as Māori and Pacific shoppers were new to the scanner system, the 3-month lead-in period may not have provided stable baseline data for accurate determination of changes in outcome variables. Thus, there was greater risk of selection bias and information bias for Māori and Pacific shoppers (in addition to reductions in study power), suggesting we need to be cautious in concluding that the price discounts were ineffective among Māori.
Regarding the nature of the price discount intervention itself, it is possible that the effect of price discounts might have been greater if the list of 1032 discounted items was mailed out more frequently, and accompanied by point-of-purchase promotions such as in-store signage. An exit survey of participants found that 40% of survey responders (n=166) in the price discount arm ‘only sometimes’ or ‘never’ bought discounted foods, often (52%) because it took too long to sort through the list. It is conceivable that effectiveness of this mechanism of delivery varied by ethnicity, although responses to the above exit survey did not differ by ethnicity.
Implications for accruing evidence to reducing inequalities in health
Evidence of which approaches work in reducing inequalities, rather than ‘just’ improving overall health, is starting to be collated.31–35 Our study had the assessment of equity impacts of price discounts and nutritional education at the centre of its study design, with major effort (and resource) invested in the recruitment of a range of social groups,25 and the tailoring of nutrition interventions to ensure cultural appropriateness.21 23 For the one instance where we found an interaction (price discount effects varying by ethnicity) we suspect that the cumulative effects of limited study power and a number of systematic biases may be the explanation rather than any true interaction. Further, this may be a paradoxical or unintended consequence of ‘doing the right thing’ and working hard to recruit more Māori and Pacific people to the study, resulting in probable differential selection and information biases by ethnicity. We hope that this aspect of the study will provide other researchers with ‘food for thought’ to maximise the internal validity of future studies. For example, while study participation must be enhanced for lower socioeconomic groups, it should be done in such a way as to not introduce differential systematic biases (eg, information and selection biases) between the social groups one wants to compare the intervention effect across. Therefore, in our study, it would have been ideal to recruit Māori and Pacific shoppers in an identical manner to European/other shoppers; however, that was impossible due to low pre-existing numbers of Māori and Pacific users of the electronic scanner. Perhaps we should have had a run-in period longer than 3 months for new users, but that would have complicated study implementation and seen greater attrition. Elsewhere we have recommended ‘If a similar supermarket trial were to be repeated in the future, we recommend the use of a simpler tracking system such as a personalised card that could be scanned at checkout to link individual shoppers to their food purchases’.25 Such a simpler system would presumably improve recruitment, and reduce attrition, especially among lower socioeconomic groups. We encourage other researchers to thoroughly consider these issues at study design stage, and also collect data that may be useful for later sensitivity analyses about potential differential systematic biases across subgroups.
However, the study was also successful on many grounds. The overall study findings are based on a study population that is over-representative of disadvantaged populations. The null findings for tailored nutritional education also reinforce that structural aspects of the food environment, in this case price, may be more important determinants of healthy eating behaviours than interventions conditioned on education and personal responsibility. With regard to price discounts, there are good theoretical grounds for expecting the price elasticity to be greater among lower socioeconomic groups (especially lower household income groups). However, our study was unable to demonstrate such a differential or a pro-equity impact of price discounts on healthy food.
What is already known
Diet is an important determinant of overall population health, and inequalities in health. Tailored nutritional education is thought to be effective for all socioeconomic groups, but few studies have been conducted. Most, but not all, studies have shown that financial incentives to improve nutrition are effective to some extent.
What this study adds
We found no association of tailored nutritional education with healthy food purchasing, but reducing the price of healthy food by 12.5% increased purchasing by 11%. In contrast to our expectations, we found that price had a weaker and null effect among Māori (indigenous population) than among European New Zealanders. However, it seems probable that biases (eg, attrition) affected Māori more severely, highlighting the difficulty in generating valid evidence of intervention effectiveness by social group—even in a large randomised controlled trial.
Acknowledgments
We thank our 1104 study participants for their dedication and contribution to the research. We are grateful to Laurie Wharemate-Keung, Christina McKerchar, Hinewai Hawaikirangi and Iutita Rusk who provided valuable input into the Supermarket Healthy Options Project trial design and oversight; Kokiri Marae and Whakaue Research for recruitment and follow-up of Māori participants; Tohoa Tahinurua, Florence Curr, Chris Tuumatavai, Kitiona Tauira, Anthony Leaupepe and Brenda Collins for recruitment and follow-up of Pacific participants; staff at the University of Otago who coordinated participant recruitment and data collection (JennyWilton, Jess Mackenzie, Maryanne Samling and Kerri Kruse); staff at the University of Auckland who undertook data entry (Gery Smith and Henry Bohte) and project management (Shireen Chua); the Heart Foundation for permission to use their Tick programme nutrient profiling criteria; and to Foodstuffs (Wellington) Cooperative Society Ltd for participation of their stores in the trial.
References
Footnotes
Funding Health Research Council of New Zealand. The Supermarket Healthy Options Project was supported by the Health Research Council of New Zealand (06/379). CNM holds the Heart Foundation Senior Fellowship (grant 1380). HE is supported by a Heart Foundation of New Zealand postgraduate scholarship (grant 1285). TB, SMc and KS receive salary support from the Health Inequalities Research Programme, funded by the Health Research Council of New Zealand (08/048).
Competing interests None.
Ethics approval This study was conducted with the approval of the Wellington Regional Ethics Committee. The study protocol was also approved by the University of Auckland Human Ethics Committee (reference 2006/462), and all participants provided written informed consent.
Provenance and peer review Not commissioned; externally peer reviewed.