Article Text

Abstract
Study objective: As part of the APHEA project this study examined the association between airborne particles and hospital admissions for cardiac causes (ICD9 390–429) in eight European cities (Barcelona, Birmingham, London, Milan, the Netherlands, Paris, Rome, and Stockholm). All admissions were studied, as well as admissions stratified by age. The association for ischaemic heart disease (ICD9 410–413) and stroke (ICD9 430–438) was also studied, also stratified by age.
Design: Autoregressive Poisson models were used that controlled for long term trend, season, influenza epidemics, and meteorology to assess the short-term effects of particles in each city. The study also examined confounding by other pollutants. City specific results were pooled in a second stage regression to obtain more stable estimates and examine the sources of heterogeneity.
Main results: The pooled percentage increases associated with a 10 μg/m3 increase in PM10 and black smoke were respectively 0.5% (95% CI: 0.2 to 0.8) and 1.1% (95% CI: 0.4 to 1.8) for cardiac admissions of all ages, 0.7% (95% CI: 0.4 to 1.0) and 1.3% (95% CI: 0.4 to 2.2) for cardiac admissions over 65 years, and, 0.8% (95% CI: 0.3 to 1.2) and 1.1% (95% CI: 0.7 to 1.5) for ischaemic heart disease over 65 years. The effect of PM10 was little changed by control for ozone or SO2, but was substantially reduced (CO) or eliminated (NO2) by control for other traffic related pollutants. The effect of black smoke remained practically unchanged controlling for CO and only somewhat reduced controlling for NO2.
Conclusions: These effects of particulate air pollution on cardiac admissions suggest the primary effect is likely to be mainly attributable to diesel exhaust. Results for ischaemic heart disease below 65 years and for stroke over 65 years were inconclusive.
- cardiovascular disease
- air pollution
Statistics from Altmetric.com
In the past decade, a number of epidemiological studies have shown that ambient air pollution adversely affects human health even at levels lower than current national standards.1 Particulate matter is the pollutant that has most consistently been associated with short-term effects in mortality. The independence of this association from other pollutants, especially SO2, has been questioned. In particular, this independent effect of particulate matter has been shown in the US.2,3 In Europe the impact of SO2 was not modified by particles levels,4 the impact of particles was reduced somewhat by control for SO2.4,5 The impact of air pollution on hospital admissions is less documented in Europe especially regarding cardiovascular causes.6–9
The association between air pollution and daily mortality and hospital admissions has been studied in Europe, mostly within the APHEA project (Air pollution and Health: a European Approach). This study has found consistent results for mortality in large Western European cities.3,10,11 For hospital admissions, though, only respiratory diseases were investigated.12–14 The objective of this paper is to study the short-term effect of particles on hospital admissions for cardiovascular diseases.
METHODS
Table 1 shows daily mean hospital admissions for cardiac diseases (International Classification of Diseases, 9th revision, 390–429), ischaemic heart diseases (ICD9,410–3), and stroke (ICD9, 430–8) by age groups in eight European cities. The Netherlands was taken as one large urban area. This was justified by the fact that the level of particulate air pollution in urban areas was the same as for the non-urban part of the Netherlands,15 and by the high correlation among the PM10 monitors in the country. For example, Verhoeff and coworkers found the correlation between PM10 in Rotterdam and Amsterdam so high (>0.90) that they were able to substitute Rotterdam measurements when data were missing in Amsterdam.16 Routine registers in all cities provided daily admission data. Emergency admissions were used in every city except in Milan, Paris, and Rome where only general admissions data were available. In Rome although the system does not permit a straightforward classification of emergency admissions, those conditions that were more likely to be elective were excluded. The excluded codes have been selected based on the comparison between emergency and elective admissions of the London data 1992–94. We excluded the corresponding codes when 70% or more of the admissions were elective admissions. To this list we added code 414, “Other forms of chronic ischaemic heart disease”. Approximately 65% of these admissions are elective, and while it does not meet the 70% cut off point, the actual numbers are so great that they could have an impact on the results for ischaemic heart disease and cardiovascular diseases. The Netherlands did not provide information for cardiac causes for all ages or old people. The pollutants, both particles and gases, were those generally measured in European cities (tables 2 and 3). Pollution levels were assessed by fixed monitoring sites. Monitors with too many missing values were excluded, using previously published criteria.17 A standardised procedure 17 was used to fill in days with missing data. A missing value on day i in year k in monitoring station j was replaced by a weighted average of the values from the rest of the monitoring stations—that is: Particles were measured mostly by PM10, except in Paris (PM13) and in Milan and Rome (total suspended particulate, TSP). To ensure comparability of the results, TSP estimates in Milan and Rome have been scaled to equivalent PM10 measures using a locally derived conversion factor of 0.75.18 For Paris, the PM13 values were taken as being equivalent to PM10 in the analyses. Five cities were also able to provide black smoke data (BS). Sulphur dioxide (24 hour average), nitrogen dioxide (hourly values and 24 hour average), and ozone (hourly value and maximum eight hour average) measurements were available in all cities and carbon monoxide (eight hour average) in all except Paris. Stations were chosen to represent background inner city air quality levels, except for ozone. Thus, stations located by limited access highways were excluded.
Health data
Particle measures: descriptive statistics
Effect modifiers: environmental data
Each centre collected, prepared, and sent its data to the centre (Paris) in which the analysis was centralised. The statistical analysis followed a jointly decided methodology. Autoregressive Poisson models allowing for overdispersion were fitted. We controlled for potential confounders including long term trend, season, days of the week, holidays, influenza epidemics, temperature, and humidity.19 We used generalised additive models 20 to adjust for non-linear relations between confounders and morbidity. Diagnostic tools for the models included the partial autocorrelation function of the residuals and Akaïke’s information criterion (AIC).21
Hospital admissions are often highly correlated over time. This results in part from environmental factors such as season, meteorology, or pollution, but also from other factors such as day of the week and readmissions. The inclusion of the omitted variables (season, weather, . . .) reduces the degree of serial correlation in the outcome series and therefore a good indicator of the omission of explanatory variables is residual autocorrelation. In our study, seasonal control was achieved by minimising the autocorrelation in the residuals and by examination of residuals plots. We systematically included a smooth function of temperature and humidity for the same day as the admissions. Inclusion of lagged effects up to three days or averaged on one to three days for temperature and humidity, was based on AIC. Interaction between temperature and humidity was also investigated. In every city, particles were introduced as a linear term, using the average of the levels on the day of admission and the preceding day. It has been shown that log transformed air pollutant concentrations give the best fit in settings with high levels of air pollution (that is, higher than 150 μg/m3 for particles, SO2 or BS).22 Therefore, in our meta-analysis, using linear terms for PM10, we restricted the analysis to days with levels of air pollution below 150 μg/m3. If serial correlation remained in the residuals of the final models, autoregression terms were added.23
To provide a quantitative summary of results across the cities, we applied hierarchical methods by obtaining a pooled regression coefficient as a weighted mean of city specific regression coefficients. The weights used were inversely proportional to the city specific estimate’s variance. We determined the weights assuming a fixed effects model when a χ2 test failed to detect heterogeneity at the sensitive level of α=20%. The between cities variance was estimated from the data using the moment method of Der Simonian and Laird.24 When the assumption of homogeneity had to be rejected and at least five coefficients were available to ensure enough power, we conducted a second stage regression of local coefficients on non-time dependent effect modifiers, following the method developed by Berkey et al.25 We fit this regression using weighted least squares with weights inversely proportional to the variance, including a random variance component. Tables 3 and 4 show an overview of potential effect modifiers collected in each centre. These were indicators of the general population health status (percentage of smokers, standardised lung cancer mortality, proportion of death in people over 65 years and standardised mortality), climate conditions (temperature and humidity), situation of air pollution (number of monitoring stations, pollution levels, and correlation between pollutants and meteorological variables). As only eight cities were available, effect modifier were included alternatively in the models.
Effect modifiers: other factors
When heterogeneity was present and less than five cities were available, a random effect model was adopted. In this model, the between cities variance is added to each estimated local variance, thus giving more similar weights, but also a larger overall variance. This variance inflation reflects greater uncertainty about the summary estimate when local results are heterogeneous.
In each city, we applied also two pollutant models, in which particles and another pollutant were simultaneously included into the model as linear terms. Second stage regressions on these models were also performed following the methodology developed by Berkey et al.26 Specific functions were written to perform autoregressive GAM model 23 and meta regression in S-plus software.
RESULTS
Table 1 shows the daily means of hospital admissions during the study period. The cities comprise a total population close to 38 million, including 15 million people from the Netherlands (table 4).
Table 2 shows the descriptive statistics for particles. The daily mean levels for PM10 ranged from 15.5 μg/m3 in Stockholm to 52.5 μg/m3 in Rome. Daily mean levels for BS ranged from 12.5 μg/m3 in the Netherlands to 38.7 μg/m3 in Barcelona. Correlation coefficients between PM10 and BS measures ranged from 0.5 to 0.8 (data not shown). Table 3 presents the daily mean levels for the other pollutants. SO2 daily mean levels ranged from 3.8 μg/m3 in Stockholm to 29 μg/m3 in Milan. The highest levels of O3 were in Stockholm, Barcelona, and the Netherlands. The levels of NO2 reached 86.5 μg/m3 in Rome and 97.9 μg/m3 in Milan. The highest levels of CO were in Barcelona. Yearly average of temperature ranged from 8.0°C in Stockholm to 16.8°C in Barcelona. Rome was the driest city and the Netherlands the wettest. The number of particle monitoring stations in each city ranged between 1 and 12.
The following analysis presents for each outcome, firstly, results for individual cities, secondly, pooled estimates and if heterogeneity is found, a complementary analysis to explain it.
Cardiac admissions all ages
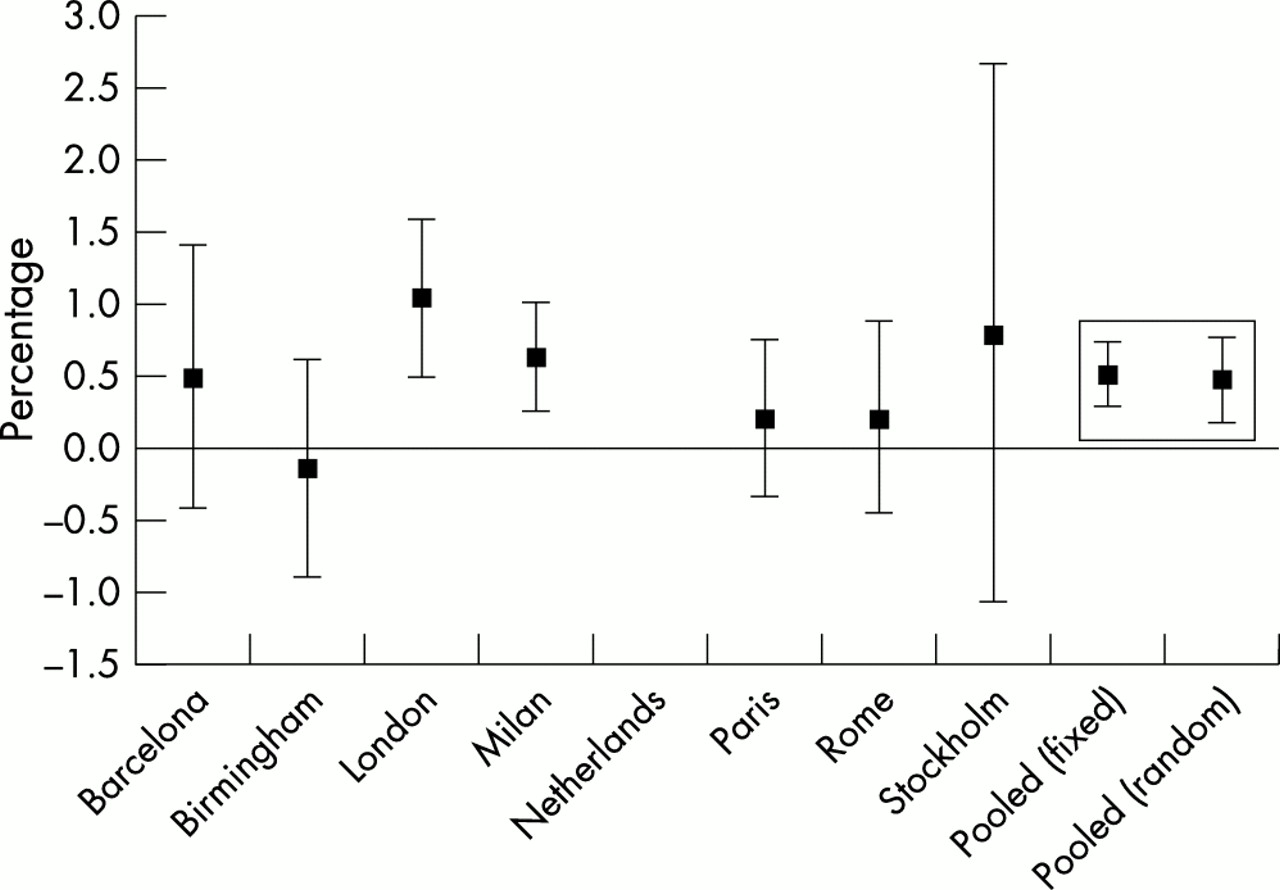
Figure 1 shows the city specific as well as the pooled fixed and random effect estimates and their 95 % CIs associated with a 10 μg/m3 increase in the average of PM10, for 0 and 1 day average lag, on cardiac admissions. All the local estimates were positive except in Birmingham, and reached the nominal significance level (5%) in two cities (London and Milan). The random joint effect estimate was a 0.5% increase in admissions (95 % CI: 0.2 to 0.8). The PM10 results showed some heterogeneity across cities (p for heterogeneity =0.17). Eighty four per cent of this heterogeneity was explained by the correlation between PM10 and NO2. Alternatively, the proportion of all cardiac admissions occurring in people over 65 years of age explained 87% of the heterogeneity. The additional increase in admissions associated with a 10 μg/m3 of PM10, for the city with either the highest correlation between PM10 and NO2 or the highest proportion of cardiac admissions for people over 65 years, was respectively of 0.5% and 0.7% compared with the city with the lowest correlation or proportion. Results for BS were heterogeneous (p for heterogeneity =0.03), but with only four cities, we were not able to further investigate the source of the observed heterogeneity. The random joint effect was equal to a 1.1% rise in admissions (95 % CI: 0.4 to 1.8) (table 5).
Pooled percentage increases under fixed and random effect models for a 10 μg/m3 increase in pollutant levels

The estimated percentage increase in cardiac admissions in each city is shown as well as pooled fixed and random effect estimates associated with a 10 μg/m3 increase in the average of PM10 for 0 and 1 day average lag.
Cardiac admissions for people over 65 years
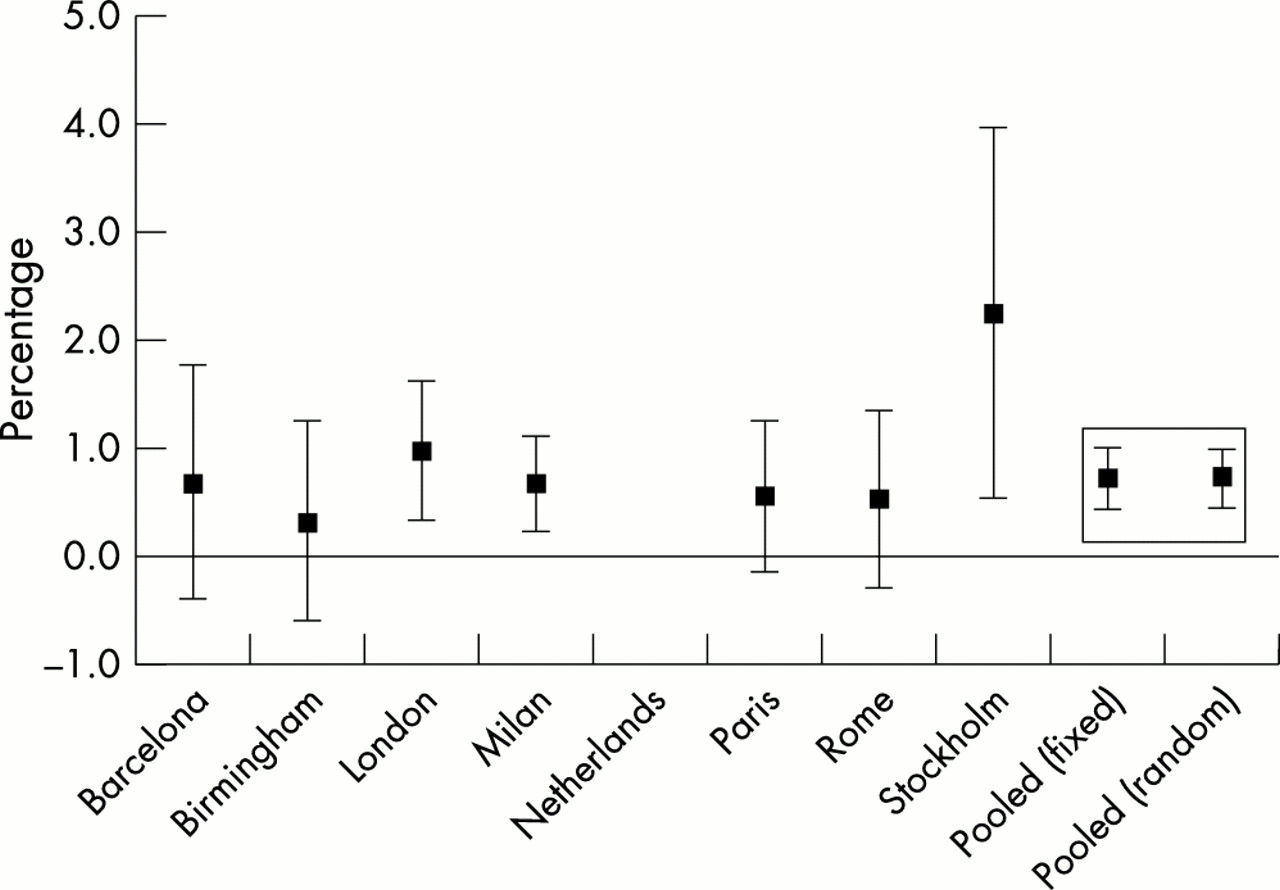
Figure 2 shows the city specific as well as the pooled fixed and random effect estimates for the effect (95% CI) of PM10 on cardiac admissions for people over 65 years old. All the city specific estimates were positive, and they reached the nominal significance level (5%) in three cities (London, Milan, and Stockholm). The fixed joint effect estimate was equal to a 0.7% rise in admissions (95 % CI: 0.4 to 1.0). There was no substantial heterogeneity in PM10 results across cities (p for heterogeneity =0.56). Results for BS showed some heterogeneity (p for heterogeneity =0.02). The random joint effect estimate was equal to a 1.3% rise in admissions (95 % CI 0.4 to 2.2) (table 5).

The estimated percentage increase is shown in cardiac admissions for people over 65 years in each city as well as pooled fixed and random effect estimates associated with a 10 μg/m3 increase in the average of PM10 for 0 and 1 day average lag.
Ischaemic heart disease admissions for people less than 65 years
Results for ischaemic heart disease for people below 65 years in relation with PM10 were not conclusive. Four of eight local estimates were positive, and only one significant (London). The overall random or fixed effect estimates were equal to 0.3 and non-significant (table 5). There was no significant heterogeneity in PM10 results across cities (p for heterogeneity =0.24). Results for BS were also inconclusive as we found a negative effect in one city, a null effect in another one, and a positive one in three cities. Confidence intervals were non-significant. The fixed effects estimate associated to 10 μg/m3 increase in BS was equal to 0.1% (95 % CI: −0.4 to 0.5) (table 5). No heterogeneity was found (p for heterogeneity =0.87).
Ischaemic heart disease admissions for people over 65 years
Figure 3 shows the city specific as well as the pooled fixed and random effect estimates and their 95% CI associated with a 10 μg/m3 increase in the average of PM10 for 0 and 1 day average lag on ischaemic heart disease admissions for people over 65 years. All the city specific estimates were positive, except in Barcelona, and they reached the nominal significance level (5%) in four cities (London, Netherlands, Paris, and Stockholm). The random joint effect estimate was equal to a 0.7% rise in admissions (95 % CI: 0.3 to 1.2). The PM10 results were heterogeneous across cities (p for heterogeneity =0.07). Factors that univariately explained some of this heterogeneity were the standardised lung cancer mortality rate (25% of it), the correlation between PM10 and CO 8h, (40% of it), and the annual level of O3 (41% of it). Figure 4 shows the city specific PM10 effect estimates for ischaemic heart disease admissions in people over 65 years plotted versus the annual mean level of O3 in each city. The triangles represent the individual city estimate and the error bar, its 95% CI. The line corresponds to the fitted regression of these estimates versus the annual mean level of O3, and the bubbles centered around individual estimates are proportional to the local weight used in univariate metaregression. This regression was significant at p<0.05, and the magnitude of the effect modification was substantial. The additional increase in admissions associated with a 10 μg/m3 rise in PM10, for the city with either the lowest correlation between PM10 and CO or the lowest standardised lung cancer mortality or the lowest annual level O3 was respectively of 1.2%, 0.8%, and 1.4% compared to the city with the highest correlation or lung cancer mortality or annual level of O3.

The estimated percentage increase in ischaemic heart disease admissions is shown for people over 65 years in each city as well as pooled fixed and random effect estimates associated with a 10 μg/m3 increase in the average of PM10 for 0 and 1 day average lag.

The estimated percentage increase in ischaemic heart disease admissions is shown for people over 65 years associated with a 10 μg/m3 increase in the average of PM10 for 0 and 1 day average lag plotted versus the annual mean level of ozone.
The fixed joint effect estimate associated with a 10 μg/m3 increase in BS on ischaemic heart disease admissions for people over 65 years was equal to 1.1 (95% CI 0.7 to 1.5) (table 5). There was no significant heterogeneity in BS results across cities (p for heterogeneity =0.28).
Stroke admissions for people over 65 years
Results for stroke for people over 65 years in relation with PM10 were less conclusive. Four of eight local estimates were positive, but non-significant. The fixed joint effect estimate was equal to zero. There was no substantial heterogeneity (p for heterogeneity =0.74). The same pattern occurred for BS with a fixed joint estimate equal to −0.1 (95% CI −0.5 to 0.4) (table 5).
Two pollutant models
We next examined the potential that the above associations were confounded by other pollutants by fitting two pollutant models for hospital admissions for cardiac causes (all ages and for people over 65 years) and for ischaemic heart disease for people over 65. In these two pollutant models, we calculated overall and specific (one for each pollutant) χ2 tests for heterogeneity. When the specific test on particles led to a rejection of the hypothesis of homogeneity, we used a random effect model, otherwise we used a fixed effect model. Special attention was paid to PM10 BS models. In this case, if one of the overall or specific tests led to heterogeneous results, random-effect models were used. In some cities, BS or CO were not available. To compare the PM10 or BS effects between a single and a two pollutant model in the same cities, we first calculated pooled results for PM10 and BS, excluding cities with missing BS data for PM10 analyses, or missing CO data for BS or PM10 analyses. The estimates were similar, although their variance were slightly larger. PM10 estimates and 95% CI were stable after controlling for O3 or SO2 (table 6). Controlling for CO reduced the estimated effect size and, widened the confidence intervals. PM10 estimates became close to zero when combined with NO2, or BS. We also observed an inflation of the variance estimates, leading to wide confidence intervals.
Pooled estimates for the increase in the total daily number of deaths associated with PM10 increase of 10 μg/m3 (average of lags 0 and 1) adjusting alternatively for other pollutants in two pollutant models
BS results (table 7) were more consistent and robust, except with control for NO2. Controlling for NO2, diminished the BS effect by a factor of almost two for cardiac admissions, and almost four for ischaemic heart disease. The sum of the BS and NO2 effects was of the same magnitude as the one for BS in a single pollutant model. For cardiac admissions, all ages, BS estimates, controlling for any pollutant (including PM10) but not NO2 were mostly unchanged and remained significant at the nominal level of 5%. For cardiac admissions, for people over 65 years, BS estimates controlling for pollutants other than NO2, were mostly unchanged but remained significant at the nominal level of 5% only for the CO and PM10 models. The estimate for ischaemic heart disease for people over 65 was quite robust, except with NO2, but combined with PM10, its variance was wider and it was no longer significant.
Pooled estimates for the increase in the total daily number of deaths associated with black smoke (BS) increase of 10 μg/m3 (average of lags 0 and 1) adjusting alternatively for other pollutants in two pollutant models
DISCUSSION
This combined analysis summarises the results from eight European cities concerning the short-term effects of PM10 and BS on hospital admissions for cardiovascular causes. It should be noted that certain frequently encountered problems of meta-analysis do not apply in our study.4 There was no selection bias in the sense that the participating cities were not selected based on the results of their analysis, but were preselected in advance, based on their ability to provide data. All the city specific analyses were centralised in one place, giving homogeneity in the statistical methodology. Data on exposures and confounding factors were collected to an agreed specification to ensure consistency across cities. One problem encountered with data comparability on health outcomes was that Paris, Milan, and Rome were not able to provide emergency admissions only. An analysis of London data showed that emergency admissions were the main part of general admissions for cardiovascular causes, the proportion of emergency to total admissions (all ages) being 62% for cardiac, 82% for ischaemic heart disease, and 80% for stroke. Because Paris, Milan, and Rome have non-elective admissions, this would tend to underestimate the coefficients compared with the cities that have only emergency admissions.
A common criticism of meta-analyses of air pollution health effects, is that they combine relative risks chosen at different lags, thus maximising the impact of air pollution. To avoid this criticism, an a priori choice of a mean of exposure on the day of and day before the event was made. However, defining a priori a fixed lag between exposure and response for each city can induce heterogeneity in the results, as the effect of air pollution may differ in time between cities, depending on the frailty of the population, processes of admission to hospital, ventilation rates of buildings or the exposure to air pollution. Variations in the serial correlation of the exposure variable may also affect how well a two day unweighted mean represents the true lagged effect of air pollution, which may be spread over more than two days, but with unequal weights. A recent paper examined distributed lag models versus single day exposures, or the mean of two days, in 10 US cities. It reported that there were city to city variations in how well the two day mean did in explaining the overall effect of PM10 on all cause mortality.27 Similar results have also been reported for hospital admissions for cardiac disease.9
We found a significant effect of PM10 and BS on admissions for cardiac causes (all ages), and cardiac causes and ischaemic heart disease for people over 65 years. The percentage increases associated with a 10 μg/m3 increase in PM10 and BS were respectively around 0.5 and 1. The impact of PM10 per unit of pollution is half of that found in the United States.4,9
The pattern of the PM associations in combination with other air pollutants was quite suggestive. PM10 did not seem to be confounded by O3 or SO2. The effect was reduced when CO was incorporated in the regression model and eliminated when controlling for NO2. CO is primary a traffic pollutant representing mainly gasoline fuelled engines and NO2 a secondary pollutant also mainly influenced by traffic (diesel and non-catalysed gasoline fueled cars), as is part of PM10. These results suggest that the association of air pollution with cardiovascular hospital admissions is primarily attributable to traffic exhaust. The stronger confounding by NO2 than by CO, suggests that diesel exhaust is primarily responsible. This conclusion is also supported by the finding that BS, which is dominated by diesel particles, is little affected by control for CO or PM10 and less affected by control for NO2 in our analysis. In contrast, the coefficient of PM10 after controlling for BS is close to zero, suggesting that particles from non-traffic (and primarily non-diesel) sources are not involved in the association.
Further support for a role of diesel exhaust comes from the negative slope in the meta regression of the PM10 coefficient against mean ozone concentration. Ozone is formed by photochemical processes, which also result in the formation of secondary particles. Hence, higher ozone towns tend to have higher levels of secondary particles. The finding of higher PM10 slope in towns where there are fewer secondary particles also suggests diesel exhaust. A recent report supports this finding. A recent analysis using factor analysis of daily measurements of the elemental composition of particles has reported that traffic derived particles are more associated with cardiovascular mortality and sulphate particles with respiratory mortality.28 Another recent US study compared the effect estimates for PM10 on cardiac hospital admissions in 14 US cities to data on the composition of the particles in those cites.29 Janssen and coworkers found that the percentage of particles from traffic was a strong predictor of the PM10 effect, with substantially larger effects in town with a greater proportion of diesel and traffic particles.
Key points
-
Eight European cities provided data on hospital admissions and air pollution.
-
There is little evidence of an impact of particles on hospital admissions for ischaemic heart disease in people below 65 years or stroke for people over 65 years.
-
The primary effect of particulate air pollution on cardiac admissions is probably mainly attributable to diesel exhaust.
We found little evidence of an impact of particles on hospital admissions for ischaemic heart disease in people below 65 years or stroke for people over 65 years. Burnett 30 also found a weak association between air pollution and hospitalisation for cerebrovascular and peripheral vascular diseases.
Particles seem to be the pollutant for which recent biological studies indicate a possible causal effect. Recent findings tend to relate particulate pollution to an increased plasma viscosity,31 increased risks of raised heart rate,32 electrocardiographic changes in dogs 33 and humans,34–36 and the triggering of myocardial infarction.37 Concentrated human exposure to concentrated air particles has also been associated with increase in plasma fibrinogen.38 Epidemiological associations have been reported between plasma fibrinogen and both particles and NO2.39,40 Particles and NO2 have also been associated with the incidence of ventricular arrhythmia and ventricular tachycardia in patients with implanted cardioverter defibrillators.41 These studies suggest that particles have an effect on the physiology of cardiovascular system, but none of these studies clearly points to a possible effect on stroke for which we did not find any consistent result. Several studies have indicated that the smaller particles, those less than 2.5 μm, are mainly responsible for these effects. Watkinson 42 shows that rodents exposed to fugitive oil fly ash particles present an increase in the incidence and duration of serious arrhythmic events.
We must acknowledge several limitations to our analysis. The analysis of PM10 effects was hindered by the different measurement methods that were used. Italian cities (Milan and Rome) provided TSP and Paris PM13 instead of PM10. Combining results using these different measurements in a meta-analysis may increase heterogeneity, and consequently, add noise to the overall estimate.
When we found significant heterogeneity between local estimates, we performed an univariate metaregression. We found that cardiac admissions (all ages) and ischaemic heart disease admissions for people over 65 years were heterogeneous in regard to PM10 effect. Hospital admissions for cardiac causes (all ages and for people over 65 years) were also heterogeneous regarding a BS effect. We found a greater risk for people over 65 years than for people below 65 years. This finding was confirmed by the fact that heterogeneity in the effect of PM10 on cardiac admissions for all ages was explained, in part, by the proportion of cardiac admissions for people over 65 years on all ages. We did not find any evidence that meteorological conditions were modifying particle results. Regarding the health status of the population, we only found a negative relation between standardised lung cancer death and PM10 estimates for ischaemic heart disease admissions for people over 65 years. The meaning of this association is not clear, and need to be confirmed in future research.
If we examine figure 4, which expresses the percentage increase for 10 μg/m3 of PM10 on ischaemic heart disease for people over 65 years, ranged by at the annual mean level of O3, we can see the fragility of the relation. Removing one city can lead to a different effect of the mean O3 concentration on local estimates, either positive or negative. As these univariate metaregressions were performed in eight cities, the inclusion or exclusion of one city may lead to non-negligible changes in results. This issue is going to be investigated with a large pool of cities, in the framework of APHEA2-NMMAPS collaboration.
This study brings new evidence on the effects of particles on cardiac diseases and points out the specific role of diesel exhaust in Europe. Although the most consistent results were for BS, and not for PM10, globally our results are in the same range that those already published in the US, and consistent with recent US studies suggesting a greater role for traffic exhaust particles in exacerbating heart disease.
REFERENCES
Footnotes
-
Funding: The APHEA 2 study is supported by the European Commission (EC) Environment and Climate 1994–98 Programme (Contract number ENV4-CT97–0534). The Swedish group had national funding only.
-
Conflicts of interest: none.