Article Text

Abstract
STUDY OBJECTIVE To identify which of seven indicators of socioeconomic status used singly or combined with one other would be most useful in studies of health inequalities in the older population.
DESIGN Secondary analysis of socioeconomic and health data in a two wave survey.
SETTING Great Britain. Participants were interviewed at home by a trained interviewer.
PARTICIPANTS Nationally representative sample of 3543 adults aged 55–69 interviewed in 1988/9, 2243 of whom were interviewed again in 1994.
METHODS Desirable features of socioeconomic measurement systems for identifying health inequalities in older populations were identified with reference to the literature. Logistic regression was used to examine variations in self reported health by seven indicators of socioeconomic status. The pair of indicators with the greatest explanatory power was identified.
MAIN RESULTS All indicators were significantly associated with differences in self reported health. The best pair of variables, according to criteria used, was educational qualification or social class paired with a deprivation indicator.
DISCUSSION For a range of reasons the measurement of socioeconomic status is particularly challenging in older age groups. Extending our knowledge of which indicators work well in analyses and are relatively easy to collect should help both further study of health inequalities in the older population and appropriate planning.
- health inequalities
- elderly people
- socioeconomic status
Statistics from Altmetric.com
Reducing inequalities in health has been identified as a key target in the recent government Health of the Nation strategy and a range of initiatives have been launched with the aim of implementing this policy.1 2 Closely related is the government's policy to reduce “social exclusion” through targeted initiatives to improve the circumstances and life chances of the most disadvantaged.3 Both these policies clearly require some means of measuring socioeconomic status and disadvantage. Because of the association between health and use of health care, and between socioeconomic status and use of health services,4 planners and providers of health care services also need information on social inequalities at both national and subnational level.
In developed countries with old age structures most deaths occur at older ages and older people account for the majority of those in poor health. This would suggest a particular need to investigate health inequalities in the older population but, although research on this topic is increasing,5-10 it remains sparse in comparison with the volume of work on younger and middle aged people, particularly middle aged men.11 This relative neglect may partly reflect past assumptions of homogeneity in the older population.9 Measuring the socioeconomic status of older people presents particular difficulties and this itself may have discouraged research, as well as hampering policy making. In this paper we consider desirable characteristics of socioeconomic status measures in studies of health inequalities and the strengths and weaknesses of the main indicators in current use with reference to the older population. We then analyse data from a nationally representative study of 55–75 year olds in Britain to see which of seven socioeconomic indicators used singly or in combination with one other performs best in analysis of differentials in self reported health status.
Measures of socioeconomic status
Ideally any system of measurement of socioeconomic status should be grounded in theory12 and based on data that can be collected relatively easily and reliably. For the purpose of studying health inequalities, further desirable features include sufficient sensitivity to allow identification of a manageable number of groups ranked in some logical hierarchy so that gradients in health inequalities can be investigated. This requirement may be less important if the measure is to be used for identifying only the most disadvantaged, in which case greater sensitivity at “the bottom” of the scale will be more important than differentiation between more advantaged groups. Additionally, measures of socioeconomic status should not themselves be an outcome of health status (as problems of possible reverse causation make interpretation difficult). If the measure is to be used as a proxy indicator of need for health care or other services, rather than for identifying possible causal pathways between health and socioeconomic status, this feature will not be important.
Theories about the relation between socioeconomic status and health essentially focus on three mechanisms.13-16 The first is a materialist one; those with higher incomes are able to purchase better food, better housing, live in safer environments and have better access to health care. The second emphasises behavioural or “lifestyle” factors, such as smoking, diet, alcohol consumption and appropriate use of health care, which may vary with cognitive skill and access to information. The third places more emphasis on psychosocial factors such as empowerment, relative social status and social integration, including exposure to stresses that may result from low status and low autonomy in important arenas of life, such as work.
The three most commonly employed indicators of socioeconomic status in contemporary industrialised societies are income, education, and occupation.17 18 Choice of indicator may reflect preference for one theoretical pathway. If materialist explanations for health inequalities are preferred, then income would seem the most appropriate indicator. Behavioural influences might be hypothesised to relate more closely to education, while occupational characteristics or measures of relative deprivation, might be chosen by analysts wishing to investigate psychosocial links between socioeconomic status and health. However, as all these indicators are interrelated and none of them capture in entirety domains identified as important in the theoretical literature, such an approach may be over simplistic. In practice all three of these indicators, together with others considered below, are widely used in analyses of health inequalities.19-22 In many studies these measures, which are highly correlated, are used almost interchangeably although this may hamper efforts to understand how social position affects health.3 23 One thing all have in common is that their use for studying older populations is problematic.
In Britain fewer than 10% of men and 5% of women aged 65 and over are working and even among 60–64 year old men who are technically of “working age” those in employment are now a minority.24 This clearly makes use of classifications based on occupation problematic, not least because hypothesised links between work environments and health are not directly applicable (although work conditions in midlife may be hypothesised to influence health in later life). Additional complications arise because reasons for leaving work early may be health related and poor health may be associated with downward social mobility towards the end of working life.13 25 Moreover the employment histories of men and women differ substantially, both in terms of labour market involvement and types of occupation.7 26
Income is strongly associated with employment27 28 and so for the same reasons problematic of as an indicator of socioeconomic status in older age groups. Additionally, as those with serious health or disability problems are eligible for various types of financial assistance, reverse causation problems are compounded.29Apart from these factors that complicate interpretation, collecting comprehensive and accurate data on income is difficult especially for groups, such as older people, who may have a number of different income sources including, in some cases, money paid on their behalf, rather than directly to them (for example, housing benefit, which in Britain is paid to landlords). Collecting these data requires a large number of questions, preferably supplemented by examination of relevant documents and this, coupled with the sensitivity of the topic, results in lower response rates in surveys dealing with income than in other types of survey.24
Education is often regarded as an indicator of first choice because, as educational attainment is normally fixed early in life, problems of reverse causation are much less serious.30 However in Britain, and many other European countries, most of today's older population left school at the minimum age with no academic qualifications. This means that the extent of differentiation possible is limited and educational variables may only allow the most advantaged to be distinguished from the rest of the population.22
An alternative to individual based measures is to use couple or household indicators. For married women social class classifications based either on husband's occupation or on the occupation of the highest status household member (the “dominance” method) tend to be associated with greater differentiation in mortality and health than measures based on own occupation.26 31 However, for older women, fewer of whom are currently married, Arber and Ginn found that both methods gave similar results.7
Other household based indicators, such as access to cars and housing tenure, are also frequently used32 33 and have been advocated as a sensible way of classifying groups, such as married women and older people, not themselves in the labour market.34 Ownership of resources is an indication of wealth, which has been shown to be associated with health35 and may also facilitate social participation. Availability of a car may make shopping for food, access to health care services and social activities easier. Housing tenure may be associated with type of neighbourhood and to some extent with housing quality although much of the poorest housing lived in by older people is owner occupied or privately rented.36 Certain amenities (such as central heating) may reduce the risk of exposure to damp or cold.37 In general these variables are treated as indicators of socioeconomic status and as all are associated with the three dimensions of socioeconomic status considered above (occupational social class, education and income, as well as with wealth) indirect associations are clearly applicable. Household-based measures obviously have the advantage of applying to nearly everybody (except those in institutions) but may be influenced by factors other than socioeconomic status, including health, in the older population. Lack of access to a car, for example, may be a consequence of widowhood or some health impairment rather than low income. Deteriorating health may also prompt support related moves to the households of relatives or specialist housing and associated changes in tenure type and household resources38 39 that reflect socioeconomic status of the relatives rather than the older person. This problem is more marked in studies of the older old as in the age groups considered in this study the proportions who move to live with relatives is very small.
Related to, but not equivalent to, systems of socioeconomic classification are the issues of identifying poverty and deprivation. Primary poverty—that is, lack of sufficient food and basic shelter—now affects only a small minority in developed countries such as Britain. Deprivation, defined by Townsend40 as the inability to participate in normal activities because of a lack of material resources, is more widespread. Measuring deprivation requires a conceptual framework that takes account of the circumstances of the whole population and defines some within it as lacking resources considered normative. Townsend used a checklist approach to ask about resources commonly regarded as necessities. A similar approach has been used in more recent studies, in some cases with additional distinctions made between “basic” or “luxury” items.23 41Explanations for associations between deprivation and health rest on psychosocial theories about health, as well as on possible direct links between ownership of certain resources, such as adequate heating and cooked meals, and health outcomes.
One other important approach is the use of ecological data. The literature suggests that living in a deprived area has direct effects on health status42 43; area classifications are also often used to draw inferences about the socioeconomic status of people living in these areas. The possible “ecological fallacy” arising from this approach is widely recognised.44 This may be particularly true for older people as often the socioeconomic indicators included in area based classifications, such as unemployment rates, are not directly applicable to them. Moreover localities that are now deprived may not have been so in the past when the older people resident in them set up home. This may explain why in some areas with high excess mortality among younger people, mortality among elderly people is below the national average.45 The social characteristics of neighbourhoods, particularly “social capital” indicated by the extent of community participation, feelings of trust and mutual support and, less positively crime and vandalism, are also increasingly recognised as potentially important influences on health.46 However, few surveys of people include relevant indicators.4 6
In this paper we examine differentiation in a sample of 55–75 year olds using seven indicators of socioeconomic status and analyse associations between these variables, singly and in combination, with an indicator of health status. Our aim is to see which measure or pair of measures best meet the criteria discussed above (grounded in theory, easily collected, sensitive enough to allow identification of gradients and identification of the most disadvantaged and not an outcome of health status). Our broader purpose is to provide information useful to analysts of health differentials in the older population, those responsible for collecting data for health needs assessments of populations and health care planners.
Methods
The data we use come from the Retirement and Retirement Plans Survey that was carried out in 1988/9, with a follow up survey conducted in 1994. The survey was commissioned by the Department of Social Security and carried out by the Office for National Statistics and has been described in detail elsewhere.29 46 In brief, at baseline a questionnaire was administered to a nationally representative sample of 3543 adults aged 55–69 identified through a prior sift of a random sample of addresses. In this sift 2717 households including one of more adults in the target range were identified, of which 88% agreed to take part in the survey. In 1994, surviving respondents were traced and 70% (2243) were re-interviewed using essentially the same questionnaire. A re-weighting procedure was applied to the data to reduce bias arising from differential response to follow up (see survey report for full description29). We have previously used these data to analyse differentials in health and disability status.10 47 Our aim in these earlier analyses was to analyse the effect of demographic and socioeconomic factors, both current and past, on health and disability and changes over time in disability. Here we are concerned with illuminating the use of common indicators and identifying which may be most useful in studies of the health of the older population.
Three measures based on individual characteristics were used in the analysis, these were:
Occupationally defined social class
The dataset includes occupational histories from which lifetime social class measures may be derived. However, as this level of detail is not available in most surveys, we used information on current or last occupation to derive social class, based on the OPCS Classification of Occupations48 and the registrar general's six category social class grouping, as this was the classification current when the data were collected. Married women's social class was assigned on the basis of their own last occupation.
Income
Information on all sources of income was collected. The measure we use here is net “benefit unit” income (benefit units are roughly equivalent to families and in the case of this survey essentially distinguish married from unmarried respondents). In the case of couples, individual income was set at 0.8 of the income of the couple, in line with recognised practice.49 In the analyses shown here we have differentiated the sample by income quartile.
Educational qualifications
Information on a wide range of qualifications, including vocational qualifications gained at work, was collected. Here we distinguish between four groups: those with no qualifications; those with clerical, commercial or trade qualifications; those with O level or equivalent; (academic qualifications gained through exams usually taken at age 16) and those with A level (academic qualifications gained through exams usually taken at age 18) or equivalent or higher qualifications.
Household based measures included housing tenure, differentiated into three groups (owner occupiers; local authority and housing association tenants; and tenants in private rented accommodation) and two indicators of resources. These were based on a battery of questions about access to a car and a range of nine other household durables or amenities. Respondents in households that lacked an amenity were asked whether the reason for not having it was “because you do not need or want one, or because you can't afford it?” In our analysis we have separated the item on car access from the others and distinguish those who lacked a car because they could not afford it from those with cars and those who lacked them for other reasons. We adopted a similar approach to derive number of other durables/amenities (here termed household resources) lacked because respondents could not afford them. This measure therefore differs from a tally of durables/amenities because it takes into account reason for the lack of a particular item.
Deprivation indicator
A subset of the questions devised by Townsend for inclusion in his survey of poverty in the UK40 was also included in the survey. These questions concerned ownership of basic items (such as a warm winter coat), items considered essential for social exchange (presents for friends and family once a year) or “normative” (a holiday away from home each year). As with the household resources questions respondents were asked whether they lacked items because they could not afford them or because they did not want them and we used this information to differentiate groups on the basis of how many of these items they lacked because they could not afford them.
The items included in the household resources and deprivation indicators are shown in the . We have also drawn on a recent survey50 to show (where possible) what proportion of the general population considered the item in question something “necessary, which all adults should be able to afford and which they should not be without”. Nearly all the Townsend items, and several of the household resources, were considered necessary by at least half the population. This suggests that those who could not afford these items meet the criteria of deprivation.
Health indicator
The outcome measure we used was self reported general health status. Respondents were asked to assess their general health over the past 12 months as good, fair or not good. For this analysis we dichotomised this into good health versus fair/not good health. Similar measures have been widely used in surveys and have been shown to relate well to other health indicators and to mortality.51 52The survey also collected detailed information on disability using the battery of scales developed for the 1985/6 OPCS Disability Surveys.53 We repeated the analyses reported using presence/absence of any disability identified using these scales as an outcome measure. Results using either outcome were very similar. The results using disability are not reported here in the interests of brevity, but are available on request.
ANALYSIS STRATEGY
Each socioeconomic factor was first investigated separately in order to gauge its effect on the two health status outcome measures using logistic regression. Further analysis combined individual socioeconomic factors with household factors in order to investigate which combination achieved the best fit to the data. Each of the socioeconomic factors was treated as an ordered categorical variable and all models controlled for age of respondent. A total of 120 men and 108 women did not have complete socioeconomic status data in 1988/9 and so were excluded from this analysis. For the same reason two men and 40 women were excluded from the analysis of the 1994 data. We present results for both 1988/9 and 1994 (based on current circumstances) in order to extend the age range considered and include data for a more recent year.
Results
key points
-
Health inequalities in the older population have received relatively little attention, perhaps partly because of measurement problems.
-
Measuring socioeconomic status in older age groups life presents particular difficulties, but is necessary for research and policy.
-
This paper identifies criteria against which the usefulness of socioeconomic status measures can be judged.
-
Variations in self reported health among 55–74 year olds were then analysed using seven indicators of socioeconomic status.
-
Results suggest that social class or education paired with a deprivation indicator met the criteria best in this population.
Weighted distributions (%) of respondents by socioeconomic characteristics
Figures 1-4 show graphically the odds ratios of fair or not good health and 95% confidence intervals for each of the socioeconomic status variables investigated, controlling for age (single years). The graphs are shown separately for men and women and baseline and follow up surveys. All the variables show significant associations with the outcome measure. Where the data are structured in an ordered ranking, the results for 1988 generally show gradients in the expected direction in odds of fair/poor health by income quartile, household resources lacked and Townsend indicator and, for women, also by educational qualification and social class (although as can be seen by examining the confidence intervals differences between subgroups were generally not significant at the 5% level). In the older, and smaller, 1994 sample income quartile and the Townsend indicator also seem to be associated with health status in a graded fashion (although confidence intervals are wide). However, among men associations with household resources are not as expected.
To examine further the best indicators of social status, individual level factors were paired with household level ones and the effects on model fit were investigated. Table 2 gives the results of this analysis. The individual level variable that resulted in the largest reduction in deviance varied. In the 1988 male sample the education variable performed best in this regard, in 1994 it was social class. For the women in 1988 income quartile seemed best, in 1994 either income or education. All pairings with a household based measure produced improvements in model fit, as indicated by statistically significant reductions in deviance. (Changes in deviance follow an approximate χ2 distribution and can be tested using a χ2 test.54) In general, car affordability gave the least reduction in deviance when paired with an individual level measure, while the Townsend deprivation and household resources indicators appeared best, although differences in degrees of freedom also need to be taken into account. In the 1994 female sample there was little to choose between adding housing tenure or the Townsend indicator, we have chosen the Townsend indicator for inclusion in the summary of “best” indicators shown in table 3, partly because it is easier to interpret and because it shows gradients with outcome, which tenure does not. Table 3 also shows whether the addition of other socioeconomic variables significantly improved the model further, in three cases the addition of housing tenure and another variables produced further significant reductions in deviance.
Results from logistic regression analysis of risk of fair or not good health for pairs of socioeconomic variables
Variables (pair) included in best fit models
Discussion
The issue of how best to measure socioeconomic status is an important one for both researchers and policy makers and the replacement of the registrar general's Social Class schema with the new UK National Statistics Socioeconomic Classification53makes such a consideration timely. Previous work on this topic has largely focused on how to measure women's status.7 26 34 Davey Smith and others also investigated whether social class (based on occupation) or education was more strongly associated with differentials in smoking and in mortality using data from the West of Scotland workplace study, a follow up study of men recruited from a range of workplaces 1970–73.13They concluded that in this study social class performed better. We are not aware of other studies using a wide range of indicators, as here, and focusing on an older sample of both men and women.
In the introductory section of this paper we identified various criteria against which the utility of socioeconomic status indicators in studies of health inequalities could be judged. These included having a theoretical basis, ease of collection, sufficient sensitivity to allow identification of gradients and identification of the disadvantaged, and not an outcome of health. None of the variables we have considered meet all these criteria on their own. From our results, income quartile seems attractive as it produced the most consistent gradients. However, as discussed in the introduction, it is difficult to collect reliable information on this except in specialist surveys. Information on past or current occupation is easier to collect and could be supplemented by collection of some retrospective job history data in order to reduce problems associated with health related downward mobility in later working life.5 Social class has the advantage of allowing gradients to be examined, but the differing distribution of men and women remains a problem. Information on educational level is more complicated to collect than it might seem because of the need to code a wide range of qualifications, even so it is widely used and accepted and is easier to collect information on than income. Age at completing full time education, used as a simpler method of classification in some surveys, is problematic because of the even lower heterogeneity on this variable than on qualifications in the older population and the need to take account of changes in school leaving age. The education indicator we used took account of post school qualifications, including those resulting from apprenticeships and other training at work. While preferable in many ways this means that it may be more influenced by possible effects of health in early adult life on ability to continue training than measures based on school age qualifications. Education on its own does not allow enough differentiation in older age groups, and this is even truer of the older old not included in our analyses. However, this is likely to change as current cohorts of older people are replaced by those with a wider range of educational experiences.
The addition of a household based indicator to models including one or other of the individual measures improved model fit considerably and certain pairings of individual and household measures seem promising, although avoiding the problem of reverse causation altogether is not possible using concurrent measures of socioeconomic status and health.
The Townsend indicator we used was based on a much longer schedule of questions devised over 30 years ago. However, it seems to perform relatively well as a way of identifying the most disadvantaged. The household resources measure was also useful in this regard, although gradients were not as consistent as with the Townsend indicator. Derivation and testing of a new combination household resource/Townsend indicator would seem a promising avenue to pursue. One possible limitation of using information on reported reasons for lack of amenities is that these may be associated with factors such as morale that may also influence self reported health status. Analyses of differentials in mortality and other health indicators based on observation rather than report would allow this to be investigated.
Housing tenure increased the explanatory power of most of the models and clearly has many advantages in that it is easily collected and allows identification of three reasonably sized groups. However, as with the other household based measures most of the population are in the “most advantaged” group. This will be even more marked in future cohorts of older people as policies designed to promote owner occupation, such as the sale of council housing, led to sharp reductions in the proportions of local authority tenants during the 1980s and mean that the predominance of owner occupation is higher, and increasing, among those who are now middle aged. In 1998, for example, 78% of households headed by someone aged 45–59 were in owner occupied accommodation.56 Changes such as these illustrate the importance of recognising that all measures of socioeconomic status are context dependent, a factor that may be particularly important in international comparative studies.
A further consideration, particularly for those charged with undertaking local needs assessment surveys, is whether national comparison data are available. Data on occupation and education are collected in many censuses and national surveys (although not always for those over pensionable age), income data are not available in the UK census and are collected in only a few surveys. Information on ownership of various consumer durables is collected in the British General Household Survey and equivalent surveys in many countries, although respondents are not asked the reasons for lacking a particularly item. A recent British survey collected national information on some of the Townsend indicators, but this was a “one off” rather than a regular survey.50 Data on housing tenure are routinely collected in the national census and many surveys.
One limitation of this paper is that the group we considered comprises “young” elderly people, rather than the older old for whom all the various problems we have mentioned are likely to be more serious. Additionally some 20% of those aged 85 and over are in institutions. Not only are no household-based measures applicable to this group, but analyses that exclude them will be biased as risk of residence in an institution is associated with both health and socioeconomic status.57
None of the variables we have considered are ideal on their own and most are subject to “reverse causation” problems. The combination that would seem most promising would be either occupational social class or education paired with the Townsend deprivation indicator or perhaps a combination household resource/Townsend deprivation indicator. We would suggest that using a combination of this type in studies of health inequalities and differentials in use of health care would improve our knowledge of the extent, possible causes and consequences of social inequalities in the older population.
References

Odds ratios (95% confidence intervals) of fair or not good health by each of the socioeconomic status variables, men 1988/9 (aged 55–69).

Odds ratios (95% confidence intervals) of fair or not good health by each of the socioeconomic status variables, women 1988/9 (aged 55–69).
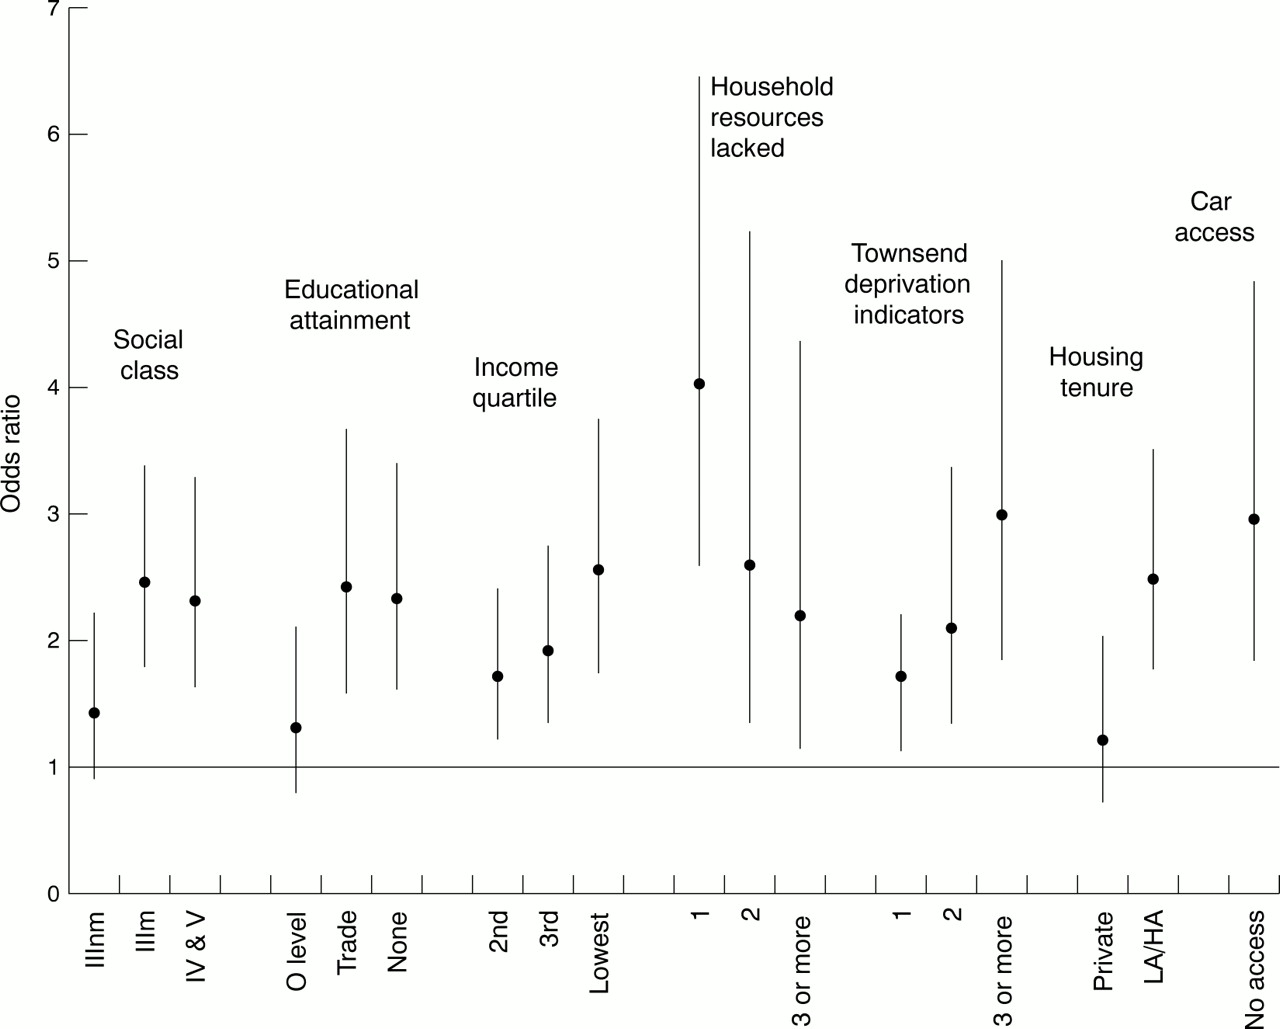
Odds ratios (95% confidence intervals) of fair or not good health by each of the socioeconomic status variables, men 1994 (aged 59–75).

Odds ratios (95% confidence intervals) of fair or not good health by each of the socioeconomic status variables, women 1994 (aged 59–75).
Footnotes
-
Funding: the research reported here was funded by the Economic and Social Research Council (UK) as part of its Health Variations Programme, grant reference number L128 25 1040.
-
Conflicts of interest: none.