Article Text

Abstract
OBJECTIVE To investigate the association between outdoor air pollution and mortality in São Paulo, Brazil.
DESIGN Time series study
METHODS All causes, respiratory and cardiovascular mortality were analysed and the role of age and socioeconomic status in modifying associations between mortality and air pollution were investigated. Models used Poisson regression and included terms for temporal patterns, meteorology, and autocorrelation.
MAIN RESULTS All causes all ages mortality showed much smaller associations with air pollution than mortality for specific causes and age groups. In the elderly, a 3–4% increase in daily deaths for all causes and for cardiovascular diseases was associated with an increase in fine particulate matter and in sulphur dioxide from the 10th to the 90th percentile. For respiratory deaths the increase in mortality was higher (6%). Cardiovascular deaths were additionally associated with levels of carbon monoxide (4% increase in daily deaths). The associations between air pollutants and mortality in children under 5 years of age were not statistically significant. There was a significant trend of increasing risk of death according to age with effects most evident for subjects over 65 years old. The effect of air pollution was also larger in areas of higher socioeconomic level.
CONCLUSIONS These results show further evidence of an association between air pollution and mortality but of smaller magnitude than found in other similar studies. In addition, it seems that older age groups are at a higher risk of mortality associated with air pollution. Such complexity should be taken into account in health risk assessment based on time series studies.
- air pollution
- mortality
- socioeconomic status
Statistics from Altmetric.com
Early documented air pollution episodes such as the London smog of 1952 led to the premature deaths of thousands of people, and prompted governments of many countries to create and enforce environmental policies that contributed to reduce their urban levels of air pollution.1 A relation with mortality at lower levels of exposure has only become apparent with recent improvements in analytical tools, including the use of time series methods.
A number of recent time series mortality studies have provided evidence of positive associations between air pollution and all cause mortality,2-5 cardiovascular mortality,6-9respiratory mortality10 11 or even more specific causes such as pneumonia and chronic obstructive pulmonary disease (COPD) mortality.12 13 Fine particulate matter (PM10) has been implicated in most studies and many consider this pollutant the most important. Less frequently, pollutants such as sulphur dioxide (SO2), nitrogen dioxide (NO2) and ozone (O3) have also been found to be related to health events.14-16 As yet few of these studies have focused on developing countries.
There remains a need for studies in cities of developing countries, where levels of air pollution and meteorological conditions are different from North America and Western Europe. In addition, despite early evidence indicating that the effect of air pollution was possibly higher in more vulnerable sub-populations such as young children and the elderly,17 few studies conducted so far have attempted to explore this issue in depth. Moreover, no studies to date have examined the role of socioeconomic status in the vulnerability of sub-populations to air pollution. Several studies, including one in São Paulo, Brazil18 have shown that social and physical deprivation places people at a higher risk of mortality. Therefore, it seems reasonable to explore if socioeconomically deprived populations are also more vulnerable to air pollution.
A preliminary time series study carried out in São Paulo, Brazil19 reported a significant association between daily respiratory mortality in children under 5 years old and levels of oxides of nitrogen. In a more recent study,20 the same investigators found an association between levels of PM10and mortality in the elderly. The present study of a larger dataset extends the investigation of the effects of air pollution in São Paulo. Daily mortality for all age groups is explored, but with emphasis on children under 5 years old and the elderly. We documented effects on cause specific as well as all cause mortality and sought to identify the most vulnerable population sub-groups defined in terms of age and socioeconomic status that may be more sensitive to short-term health effects of air pollution.
Methods
The study covered a period of three years (1991 to 1993) and was carried out in São Paulo, the most urbanised, industrialised and affluent city in Brazil with a population of about 9.5 million inhabitants according to the 1991 national census. It encompassed all but one administrative district of the city, which was excluded because it has a low population density and is the furthest from an air quality monitoring station. The main source of air pollution in São Paulo is motor vehicle emissions.21
Data on mortality were provided by PRO-AIM, the city's mortality information system, which is based on information contained on death certificates. The great majority of deaths in São Paulo are assigned by medically qualified personnel and checking procedures are routinely carried out by PRO-AIM to ensure high quality of the data. Daily counts of deaths for different causes and age groups were extracted from this dataset. Only deaths of city residents, selected by their residential address, were included in this analysis.
Data from the 1991 census on five socioeconomic variables were used by a previous study to generate a composite index of socioeconomic status for each of the 58 administrative districts of São Paulo. Details of the procedures used to obtain such an index are described elsewhere.18 In summary, for each socioeconomic variable a value was assigned from zero (for the district with the worst conditions) to one (for the one with best conditions). The composite index was the mean of these five values for each district. The 58 administrative districts of São Paulo were then classified into quartiles of this composite socioeconomic index. This showed that 43.8% of the population of São Paulo live in the quartile with the worst socioeconomic conditions (stratum 1) while 9.2% live in the best quartile (stratum 4).18 This classification was used in this study to characterise the socioeconomic conditions of each subject based on their district of residence.
Daily levels of SO2 measured by colorimetry, PM10 measured by a β gauge aerosol method, CO measured by non-dispersive infra-red, O3, and NO2 both measured by chemoluminescence were available from CETESB, the environmental agency in São Paulo.
Daily means (24 hour averages) were provided for PM10 (12 sites) and SO2 (13 sites) while a maximum eight hour moving average was available for CO (four sites). The maximum hourly mean observed during the 24 hour period was provided for O3(five sites) and NO2 (four sites). For each pollutant, as inter-site correlations were high, daily citywide levels were calculated by averaging all available data across all monitoring stations. The attainments of the network of monitoring stations and the data handling capabilities of CETESB have been considered to be of high quality.22
Data on meteorological variables were provided by the University of São Paulo and included daily measurements of temperature, humidity (mean, maximum and minimum level), atmospheric pressure, rainfall, wind speed and wind direction.
Poisson regression models were used to investigate the association between air pollution and mortality. Adjustments for confounding factors were first performed allowing for longer term patterns in the data—that is, time trend—then for seasonal and cyclical variations, then for short-term systematic effects (calendar effects) and finally short-term unsystematic effects (meteorological variables). The analyses followed some standard procedures developed by previous studies.23 24
To model the temperature effect, initially, cross correlation functions were produced to characterise at which delay the effect of temperature was greatest on each health outcome. After identifying the best lags, the residuals of the outcomes were then plotted against the measures of daily temperature at the chosen lags to help determine the shape of the exposure-response relation. This procedure helped the choice of transformations in the temperature variables that would provide the best model fit. Functions with different shapes including linear, quadratic, two piece linear, three piece linear and non-linear shapes were then constructed.
For each different outcome the model was fitted in a stepwise forward strategy. Thus, terms to adjust for potential confounders were included first in order to obtain a baseline or “core” model. The contribution of air pollution variables to the prediction of daily mortality was only examined after establishing these core models. It was decided a priori to investigate the effect of each pollutant on the same day and lagged by one and two days as these were the lags commonly investigated in previous studies.19 20
Spectral analysis and periodograms, plots of residuals and of predicted values were used at each step to check the adequacy of the modelling and also to update the initial selection of variables used in the control for confounding. Partial autocorrelation functions of the residuals were also examined to assess the presence of any remaining autocorrelation in the data. All the statistical procedures were implemented using SAS.25 A modified version of a SAS Macro developed by J Schwartz was used to fit auto-regressive log-linear regression models with Poisson errors allowing for overdispersion.
Results
key points
-
Air pollution is associated with mortality in the elderly in São Paulo, Brazil.
-
Effects were greater for respiratory and cardiovascular deaths than for mortality attributable to all non-violent causes.
-
The magnitude of effects was generally smaller than observed in previous studies in North America and Europe.
-
The effect of air pollution on mortality increases with age. No significant effects were observed for under 65 years old age groups.
As observed in table 1 levels of air pollution in São Paulo were relatively high during the period of this study with most pollutants exceeding recommended guideline levels21either for annual mean or daily level. Overall there were 151 756 deaths for all non-violent causes in the city of São Paulo of which 49% occurred in the elderly. In addition, cardiovascular diseases were responsible for nearly half of the deaths in the elderly. Children under 5 years old accounted for 10% of the total daily deaths in São Paulo. Cause of death was available for all deaths although 1.2% were classified as “ill-defined conditions”.
Descriptive statistics for air pollution, meteorological variables, and mortality data in São Paulo, Brazil, 1991–1993
After filtering the temporal and meteorological patterns from the data, the residuals were plotted against the time period to examine if there were signs of temporal and seasonal patterns still unadjusted for. As shown in the example of figure 1 the core model was successful in controlling for all these patterns.

Time series plot of the residuals of all causes mortality in the elderly from the core model.
Poisson regression models were used to estimate the coefficients of the air pollution variables for various mortality outcomes and age groups. Relative risks (RR) of death were calculated in relation to a change from the 10th to the 90th centile in levels of each air pollutant. All the analyses were performed for levels of pollutants on the same day and lagged one and two days. Because of the near collinearity among air pollution variables only single pollutant models are shown here. The results from multi-pollutant models were difficult to interpret. The main results are presented in table2.
Adjusted relative risk (95% CI) for mortality in all ages, in the elderly, and for children for an increase in pollution levels from the 10th to the 90th percentile. (separate analysis for each pollutant)
Single pollutant models showed that all causes all ages mortality generally exhibited much smaller associations with air pollutants than mortality for the specific causes and age groups presented in table 2. For example, an increase in levels of PM10 from the 10th to the 90th centile was associated with a 0.7% increase in the total number of daily deaths (or 1.1% increase if we consider a 100 μg/m3 increase in PM10). Moreover, none of the associations for all ages combined were statistically significant at the 5% level. On the other hand, mortality in the elderly was significantly associated with exposure to some air pollutants. For all cause mortality there were statistically significant associations with PM10, SO2 and O3. For PM10 the effect was largest with measures of pollution on the same day. For SO2 and O3, a one day and two day lagged effect respectively gave the largest coefficient. An increase from the 10th to the 90th centile in the levels of PM10 or SO2 was associated with a 3.3% increase in daily mortality in the elderly. A slightly lower effect was observed for O3 (2.3%). The increase of 3.3% for PM10 and SO2 is equivalent to effects of 5% and 17% for a 100 μg/m3 of PM10 and SO2 respectively.
Cardiovascular deaths were significantly associated with PM10 and SO2 along with CO rather than O3. The coefficients were consistently larger in the same lag period observed for all cause mortality. Deaths attributable to respiratory diseases also exhibited positive associations with all the major air pollutants but were only statistically significant for PM10. For this pollutant the relative risk was 1.06 and was slightly larger when levels of PM10 were lagged by one day.
For respiratory mortality in children under 5 years old positive associations were noted for SO2, CO and O3 and the point estimates for these pollutants were higher than the ones found in the elderly. Increases in daily numbers of deaths for a 10th to 90th centile increase in these pollutants were approximately 9%, 9% and 6% respectively. When selecting a more specific cause of mortality in children such as pneumonia infections it was observed that some relative risk estimates were even higher. However, none of the associations found for mortality in children reached statistical significance at the 5% level.
To explore further the role of age in modifying the pollution-mortality association, additional analyses were performed. To accomplish such analyses, 11 different age groups for all cause mortality were created in a way to have approximately the same number of people in each group. Neonatal deaths, which are strongly related to perinatal causes, were excluded from this analysis.
A complete model building procedure was then performed for each separate age group to adjust for temporal and meteorological factors. We decided to perform the model building separately because patterns of seasonality might be different for each age group and these differences could have been missed if the model building were conducted only on the aggregated dataset. Then, the 11 different age groups were aggregated into a single dataset with a classification variable “age” denoting each specific age group. A model including all control variables, which had been selected in the separate age group analyses, was constructed and the interaction term of PM10 with age was tested. The significance of the interaction between age group and pollution was assessed by a log-likelihood ratio test. The result of this analysis is plotted in figure 2.
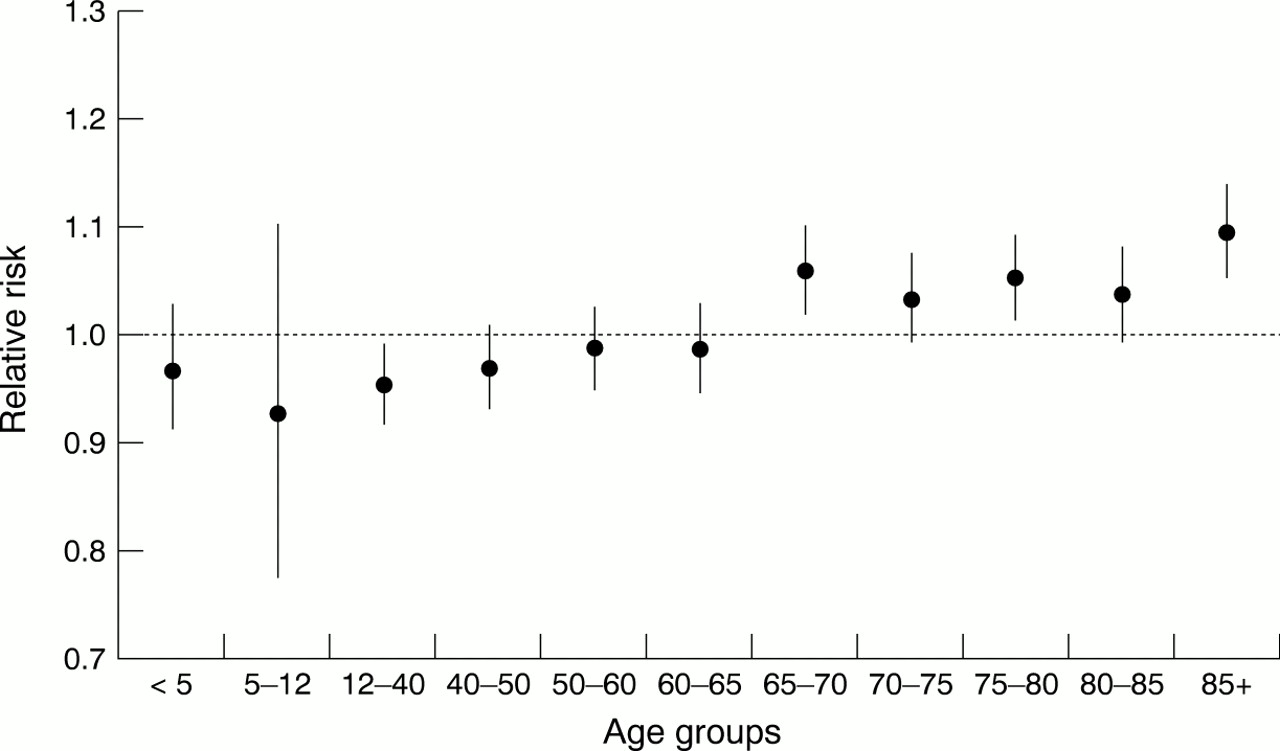
Relative risks (95% CI) for all cause mortality for an increase from the 10th to the 90th centile in levels of PM10 according to age group.
It was found that the effect of PM10 on mortality for all non-accidental causes varies according to age (significance of the interaction, p<0.001). The excess is only evident in the over 65 age groups. Some RR are different from the results of analyses conducted separately by age group, largely as a consequence of the effect of adjustment for meteorological, trend and cyclical covariates, the parameters for which do not vary as in the separate analyses. Thus the younger groups with the smallest numbers per stratum are most affected and for one stratum (age 12–40) the RR is rather low (0.95, 95% CI 0.92, 0.99).
A similar approach was used to investigate if there are any differences in the effect of air pollution exposure according to the socioeconomic status of the subjects. As none of the associations for mortality in children reached statistical significance we decided to perform this analysis only for deaths attributable to all non-violent causes in the elderly. Each death was assigned to one of the four socioeconomic strata based on classifying the residential address. Model building procedures were again used to identify the control variables for each group. The final core model included control variables for seasonality and temporal trends, which had been selected for each group of death counts. A classification variable taking values from 1 to 4 was used to indicate the socioeconomic status of the area of residence before death for each person.
It could be seen that there were limited differences in the risk of death for all causes in the elderly according to the socioeconomic conditions of the place of residence (fig 3). In other words it seems that there is only a slight increase in risk for people who lived in wealthier areas compared with more deprived ones. These differences were not large enough to provide a statistically significant effect modification by socioeconomic status (p>0.5).

Relative risks (95% CI) for all cause mortality in the elderly for an increase from the 10th to the 90th centile in levels of PM10 according to a socioeconomic classification. Strata 1 are the poorer people while strata 4 are the richer ones.
Discussion
This study used time series analysis to examine the short-term association between exposure to air pollution and mortality in the city of São Paulo. The robustness of the models used was examined in a sensitivity analysis (results not shown) and it was observed that for outcomes with large numbers of daily occurrences the choice of statistical models did not have any major impact on the results obtained. On the other hand, alternative ways of seasonal correction, for example, using indicator variables for months or seasons, would have produced much larger effects and there were clear signs of under-adjustment when residuals were examined in a spectral analysis. The small size of the over-dispersion parameters and of auto-correlation remaining in the residuals after the filtering procedures shows that the models were well adjusted.26 27In addition, re-analysis of the data using the now widely available generalised additive models produced very similar results.
A potential source of confounding, which was not investigated in this study, is that of influenza epidemics. Most studies, especially in Europe and North America have included data on deaths from influenza as a way to control for this factor. However, at the time of this study there were no reports of influenza epidemics in São Paulo and mortality counts for influenza did not exhibit an epidemic pattern.
This study found weak evidence that levels of air pollutants are associated with mortality in children under 5 years of age in São Paulo. It contrasts with a recent study conducted in Mexico City28 where infant mortality was associated with PM2.5, NO2 and O3 (although not as consistently for the gases as for the fine particles). It contrasts also with an earlier study conducted in São Paulo19where a significant association was reported between respiratory mortality in children and levels of oxides of nitrogen. However, the studies in São Paulo are not directly comparable. Reasons for the contrasting results may include the differences in methods such as Saldiva et al using only one year of data, different seasonality control and four day moving averages for pollution and mortality, as compared with the three years of data and complex filtering of cyclical patterns in the present study.
Few studies have focused on mortality in children in relation to outdoor air pollution in a time series approach. This is probably because the numbers involved are usually not enough for such an analysis. Large cities can provide larger numbers of daily deaths in children. But this might not be the case for cities of developed countries where health standards are high. Even in the case of São Paulo the mean number of daily deaths for respiratory diseases in children (2.2) is unlikely to provide statistical power to detect the effects of air pollution even if they exist.
However, it could well be that an effect of air pollution on children's mortality in São Paulo is absent. Examining the effect of air pollution on all cause mortality according to age, it was observed that the effect was only statistically significant for people over 65 years of age. It seems that the age group more vulnerable to the effects of air pollution is the elderly, not children. In fact, a few other studies have found some evidence that the effect of PM10 on mortality differs in different age groups with higher effect estimates for the over 65 years old group.8 12 13 29 This finding has important implications for estimation of the health impact of exposure to air pollution.
There are however a number of time series studies of air pollution levels and respiratory morbidity in children30-34reporting significant and positive effects. Thus, it seems probable that levels of air pollution may have an effect on children's health, especially respiratory health. However, we might hypothesise that because of usual exposure to high levels of pollution since early life might have made children of São Paulo more “resistant” to death during acute episodes.
There was also some indication of a modification of the effect of PM10 on all cause mortality in the elderly by socioeconomic status. It was observed that people living in wealthier areas had a slightly larger RR of death compared with those living in more deprived ones. This could be interpreted in the context of competing causes. Poorer people are subject to higher risks of death because of several conditions including infectious diseases and violence. The wealthier could appear more vulnerable to the effects of air pollution as they are more “protected” from other important causes of death. Another consideration is that the lower relative risk may be the consequence of fitting a multiplicative model: if the pollution related excess mortality is additive to background rates, then for sub-populations with higher mortality rates, the proportional increase would be lower. This phenomenon may be relevant for explaining the generally lower coefficients reported for developing countries where mortality rates are higher, compared with the United States and Europe.
However, the differences in risk according to socioeconomic conditions were not large enough to provide a statistically significant effect modification. Each death was assigned to one of the four socioeconomic strata based on their district of residence. Such an ecological approach does not take into account the fact that districts are large and socially quite heterogeneous. Therefore, the index used might not have discriminated appropriately the socioeconomic conditions of each area. This precludes a more detailed assessment of the role of socioeconomic conditions in the risk of health effects attributable to exposure to air pollution.
This study found some evidence that current ambient levels of air pollution in the city of São Paulo are associated with mortality for people over 65 years of age for all non-accidental causes, for cardiovascular diseases and for respiratory diseases. These findings are in agreement with a series of reports published in the past few years based on time series analysis of routinely collected data.2-11 However, the size of the effects found in many of these studies is higher than was observed in São Paulo.
Different meta-analyses carried out indicated that the increase in daily mortality for all causes for a 100 μg/m3increase in PM10 for example, varied between these studies ranging from 5% to 10%35-38 while in this study it was 1%. For respiratory deaths in the elderly in São Paulo a 100 μg/m3 increase in levels of PM10 was associated with a 17% increase in daily deaths while some studies reported effects of 30–40% increase associated with the same change in PM10.10 37
Effects on cardiovascular diseases in the elderly in this study (6% and 24% increase in mortality for a 100 μg/m3 increase in daily levels of PM10 and SO2, respectively) were similar to what has been found in other studies for PM10 (between 5–20% for a 100 μg/m3increase),6 8-10 12 13 37 and higher for SO2 (around 10–14% for 100 μg/m3).9 39
Some recent studies also conducted in cities of developing countries (Santiago, Chile and Mexico City)7 40 also found effects somewhat lower than most of the USA results. Differences in temperature and humidity, which might influence the composition of the pollution mix and therefore, its effect on human health, might play a part in the differences observed between cities in developed and developing countries. Moreover, other such dissimilarities should also be considered for example populations in developing countries, especially the elderly and other vulnerable groups, experience other important competing causes of mortality that are together more important than air pollution.
The possible difference in effects of air pollution on mortality on populations of developed and developing countries deserves further examination in future studies. Nevertheless, even if it is lower, an effect of air pollution, especially of PM10 and SO2 on mortality was observed in the city of São Paulo. It seems that in particular the elderly are at higher risk of mortality attributable to exposure to air pollution. Such complexity in the relation between air pollution and mortality should be taken into account in health risk assessment based on time series studies.
Acknowledgments
We thank Mr Stephen Bremner for his helpfull comments on an earlier draft of the paper.
References
Footnotes
-
Funding: during all stages of this study NG was under the sponsorship of the Brazilian Research Council (CNPq).
-
Conflicts of interest: none.