Article Text

Abstract
Background A life course approach has been suggested as the most appropriate to establish the total impact of socioeconomic status (SES) on adult health outcomes; however, such an approach has been poorly used within Mediterranean populations. We aimed to examine the SES trajectories from childhood to adulthood associated with mortality risk in a large general population-based cohort and to test potential pathways (eg, inflammation) underlying such associations.
Methods Longitudinal analyses on 22 194 subjects recruited in the Moli-sani Study, Italy (2005–2010). Low and high SES in childhood, educational attainment (low/high) and SES during adulthood (measured by a score including material resources and dichotomised as low/high) were used to define overall trajectories.
Results Over 8.3 years of follow-up, 1155 deaths occurred. In the group with poor childhood SES, an upward trajectory in both educational and material circumstances was associated with lower risk of all-cause death (HR=0.64; 95% CI 0.47 to 0.87), as opposed to subjects who remained stably low (low education and adulthood SES). Subjects with high childhood SES, but not educational achievement, were at increased risk of total and cardiovascular disease (CVD) death, although reporting higher material SES in adult life, as compared with the stably high SES group (HR=1.44; 1.02 to 2.02 and HR=1.90; 1.10 to 3.28, respectively). Inflammatory markers marginally accounted for such associations.
Conclusion For individuals with low SES in early life, an educational and material upward trajectory over the life course was associated with lower mortality risk. In the high SES childhood group, lack of a higher educational attainment appeared to be unfavourably associated with survival.
- socioeconomic status
- inflammation
- life course
- socioeconomic trajectories
- cumulative socioeconomic disadvantage
- mortality
Statistics from Altmetric.com
- socioeconomic status
- inflammation
- life course
- socioeconomic trajectories
- cumulative socioeconomic disadvantage
- mortality
Introduction
Socioeconomic disparities in adult health outcomes and mortality have been extensively documented in several epidemiological settings1–4 and have been usually addressed by one or more indicators of socioeconomic status (SES) measured at one time-point over life course.
A life course perspective is recognised as the most appropriate approach for fully elucidating the contribution of socioeconomic factors to health and mortality risk,5 6 in light of the fact that socioeconomic inequalities in health in adulthood appear to have their origins in early life and may result from differential exposure to SES advantages/disadvantages experienced across the life course.7–9
Despite general agreement on the usefulness of adopting a life course approach in order to capture the complexity of individuals’ exposure to socioeconomic advantages and disadvantages from early to later life,10 11 few studies so far examined SES trajectories over life course towards mortality risk within Mediterranean settings, with the majority of knowledge coming instead from UK,12 13 USA14 or Northern-central European countries.9 15–19
Actually, the impact of SES in shaping mortality risk in Mediterranean countries has not been fully explored to date and Southern European Countries have the smallest inequalities in mortality, as compared with Northern, Western or Eastern European regions.20
Another open issue in SES studies relates to the pathways underlying socioeconomic disparities in health, which are not completely elucidated, although some recent evidence suggests a major role of behavioural factors and inflammatory reactions at least towards cardio-cerebrovascular (cardiovascular disease [CVD]) mortality risk12 or incidence of type-2 diabetes.21
The existing hypotheses on the influence of life course SES on chronic disease/mortality risk can be grouped into different broad conceptual models such as accumulation of risk, critical period, status inconsistency and social mobility which, however, are difficult to disentangle.9
This study investigated the impact of life course SES on long-term mortality risk in a general adult Mediterranean population by measuring SES at three time-points across the life course, according to a social trajectory design, and by quantifying the cumulative socioeconomic disadvantage (CSD) over life course.
Finally, this study examined the contribution of behavioural factors, traditional and novel CVD risk markers as possibly mediating the relationship between life course SES and health outcomes.
Methods
Study population
Data are from the Moli-sani Study, an ongoing, prospective cohort study on 24 325 men and women (aged ≥35 years) randomly recruited from the general population of the Molise region in southern Italy from March 2005 to April 201022 (online supplementary methods).
Supplemental material
For the purpose of this study, we omitted individuals with missing information on exposure factors (childhood SES; education; housing; occupational class; number of cohabitants; number of rooms; 5.1%) and on main variables of interest, including outcomes (0.3%) and subjects lost to follow-up (0.1%). A total of 22 194 individuals were finally included in the analyses.
As compared with the omitted group (n=2131), participants included in the present analyses were younger (55±12 vs 62±13; p<0.0001) and had higher educational level (postsecondary education 12.8% versus 7.8%; p<0.0001). The two groups shared a similar prevalence of men (48% vs 49%; p=0.32, in the analysed and excluded group, respectively), major chronic diseases at baseline (CVD=5.1% vs 9.1%; cancer=3.2% vs 3.5%, age and sex-adjusted p>0.05, for included and excluded individuals, respectively).
Indicators of SES in childhood
Socioeconomic information was self-reported and collected by a structured questionnaire administered by trained personnel. Childhood SES at 8 years of age was collected by questions on: (1) housing tenure (rented, 1 dwelling ownership, >1 dwelling ownership); (2) access to hot water, (3) number of rooms available in the house and (4) number of persons living in the household; the ratio between the latter two indicators was calculated to assess overcrowding in childhood (defined as ratio<0.6, which is the median value of the population).
Each individual SES factor was coded as 0–1 to generate a score ranging from 0 to 3. Low/high childhood SES was defined as being below (score<2) or above (score≥2) the median of the population, respectively.
Education
Education was based on the highest qualification attained and was categorised as up to lower secondary (≤8 years of study), upper secondary school (>8≤13) and postsecondary (>13). Low educated were those subjects reporting up to lower secondary school, while those with upper secondary school or higher were considered as having a higher education.
Material SES score in adulthood
Occupational social class was based on the Registrar General’s occupation based classification scheme and ranked as previously described within the Moli-sani population.23 Occupational class was categorised as professional/managerial, skilled non-manual, skilled manual, partly skilled/unskilled and unemployed/unclassified subjects.
Adult SES was measured on a six-point scale rating the following SES indicators: (1) housing tenure was considered as rented (0 point), 1 dwelling ownership (1 point) and >1 dwelling ownership (2 points); (2) professional/managerial (3 points), skilled non-manual (2 points), skilled manual (1 point), partly skilled, unskilled, and unclassified subjects (0 point); (3) overcrowding was obtained from the ratio between the number of rooms available in the house and number of persons living in the household; overcrowding was defined when the ratio was <1 (0 point).
Low/high adult SES was defined as being below (score≤3) or above (score>3) the median of the population, respectively.
Social mobility and SES trajectories
We used the dichotomised low/high SES indicators at three time-points (SES at childhood, educational level and adult material SES) to identify 2×2×2=8-level life course trajectories.
In order to assess the impact of social mobility on mortality risk, SES trajectories over life course were separately calculated for low and high SES in childhood groups, with four possible trajectories for each group.
Within subjects with low childhood SES, the ‘stably low’ group was the one with neither educational nor adult SES (material) advancements over life course and was the reference group; the remaining three trajectories were constructed on the basis of (1) educational but not material achievement; (2) material but not educational achievement; (3) both educational and material achievements in adult life.
For high SES in childhood individuals, the reference category was the ‘stably high’ group, that is the group with both educational and material upward trajectory over life course. The possible trajectories were (1) educational but not material downward trajectory; (2) material but not educational downward trajectory and (3) educational and material downward trajectory.
Cumulative socioeconomic disadvantage score
The CSD score was computed by using three childhood SES factors (all coded 0–1), 3-level educational attainment (coded 0-1-2) and three adulthood SES indicators (housing and occupational class were coded 0-1-2 and overcrowding was coded 0–1). The final score ranged from 0 to 10 with the highest values indicating the greatest CSD experienced over life course. The score was further categorised into six levels ranging from poor (0–3) to very high (8–10).
Statistical analyses
Baseline characteristics of the study population are presented as percentages or means with SD for continuous variables (SD). Risk estimates for all-cause and cause-specific deaths were expressed as HR with 95% CI and calculated by Cox regression models with time-on-study on the time scale and competing risk of dying for other causes.
The multivariable Model 1 was adjusted for age (ordered quintiles), sex and marital status (married/cohabiting, divorced/separated, single or widowed) and served as the reference for the mediation analysis to estimate the contribution of each set of potential mediators, which were alternately included into Model 1.
Five main pathways were tested as possibly mediating the association between SES trajectories and the CSD over life course and mortality.
The ‘health conditions’ pathway included history of CVD, cancer, therapy for diabetes, lipid-lowering drugs, medication for hypertension and psychological assessment.
The ‘health-related behaviours’ pathway included leisure-time physical activity, adherence to Mediterranean diet (MD), energy intake, smoking status and abdominal obesity; the ‘traditional’ pathway comprised classical CVD risk factors (without behaviours) as blood lipids (total cholesterol, high density lipoprotein (HDL)-cholesterol, triglycerides), blood glucose, systolic and diastolic blood pressure; the ‘inflammatory’ pathway consisted of C-reactive protein (CRP) and white blood cell (WBC) count; the ‘novel biomarkers’ pathway includes NTproBNP, hsTnI, Cystatin C, Creatinine, Insulin, C-peptide, Vitamin D, ApoB-100, ApoA and Lp(a).
For the mediation analysis, we used the %MEDIATE macro in SAS software24 calculating the point and interval estimates of the per cent of exposure effect (PTE) explained by one or more intermediate variables, with 95% CI and p values. Traditional, inflammatory and novel biomarkers were entered into mediation analysis as ordered quintiles.
Potential dose-response relationship between the CSD (ranging 0–10) and all-cause mortality risk was tested via a restricted cubic spline regression. The used RCS_Reg SAS macro25 created a restrictive cubic spline function of the CSD with three knots, located at the 5th, 50th and 95th percentile, and displays the dose-response association (with its 95% CI) between the cubic spline CSD and all-cause mortality, tested via a multivariable Cox model.
Subgroup analyses were undertaken by age groups: we discriminated between individuals aged ≥65 years at baseline in 2005–2010, thus born before 1940–1945, and subjects aged 35–64 years, thus born after 1941–1946. Appropriate multiplicative terms for testing interaction were included in the multivariable models to test for a role of age at baseline in modulating the association between SES (either as trajectories or as CSD) and all-cause mortality risk.
Dummy variables for missing values were created.
The data analysis was generated using SAS/STAT software, V.9.4 of the SAS System for Windows 2009. SAS Institute and SAS are registered trademarks of SAS Institute, Cary, North Carolina, USA.
Results
Subjects with poor SES in childhood were older, had lower SES in adulthood and higher prevalence of major chronic diseases and unfavourable health conditions (table 1). Characteristics of subjects grouped according to SES trajectories or CSD categories are reported in online supplementary tables 1–3.
Baseline characteristics of the study population by SES in childhood
Over a median follow-up of 8.3 years (IQR: 7.3–9.3 years), a total of 1155 all-cause, deaths were ascertained (414 CVD, 453 cancer and 288 other cause deaths).
Poor adult SES was associated with increased risk of total and cause-specific death, with the exception of cancer mortality, while low SES in early life increased risk for total and other cause mortality (online supplementary table 4).
Life course trajectories in the whole Moli-sani Study cohort
The ‘stably low’ group (low childhood SES and low education and low adult SES) was the most representative of our population (26.8%), while the least was the group with high childhood SES and low education and high adult SES (4.1%).
As compared with the ‘stably high’ group over life course (high childhood SES and higher educational level and higher adulthood SES) those remaining steadily low, experienced 56% (95% CI 1.26 to 1.92) and 58% (1.10 to 2.27) increased risk of all-cause and CVD death and overdoubled their risk of dying from other causes (table 2).
Association of 8-level life course trajectories with all-cause and cause-specific mortality in the whole study sample (n=22 194)
In most of the cases, failure to achieve a higher educational attainment over life course was associated with higher death risk, even in the presence of material achievements in adulthood (table 2).
The group with low childhood SES reporting achievements in both education and material circumstances in adulthood appeared to have the same risk of total mortality as those ‘stably high’ (HR=1.03; 0.79 to 1.33; table 2), with similar survival estimates (table 2). Lack of higher educational attainments for those with high childhood and high adult SES was associated with 87% increased CVD mortality risk (table 2).
Socioeconomic trajectories among low childhood SES group
As compared with those remaining ‘stably low’, combined educational and material achievements over life course were associated with 41% to 36% reduced risk of mortality (total death: HR=0.64; 0.47 to 0.87; CVD: HR=0.59; 0.34 to 1.02; cancer: HR=0.69; 0.43 to 1.11; mortality from other causes: HR=0.64; 0.36 to 1.15; table 3; Model 1).
Socioeconomic trajectories in subjects with low SES in childhood and associated risk of all-cause and cause-specific mortality
The inflammatory pathway explained 9.7% of the total mortality risk reduction associated with the educational and material upward trajectory (table 3) and appeared to have a leading role, although modest, also towards all other cause-specific mortality. Novel biomarkers of CVD risk were likely to be on the pathway of educational and material upward mobility with CVD and other cause mortality risks (table 3).
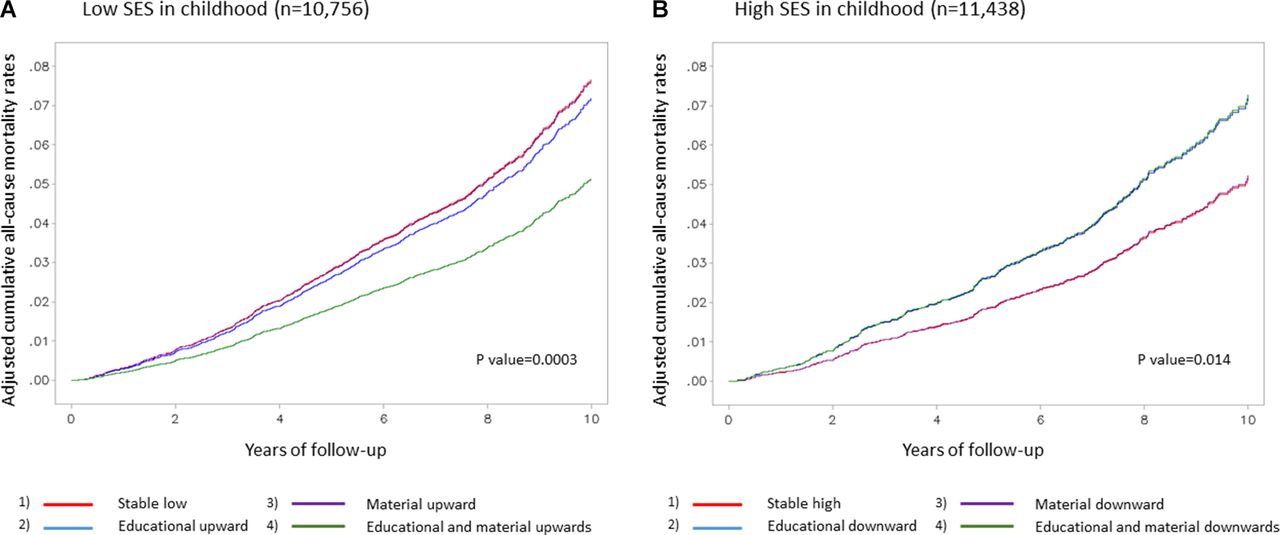
Mortality rates are well-separated during follow-up, with the group of individuals with an educational and material trajectory having clearly lower mortality (figure 1A).
Cumulative all-cause mortality rates according to socioeconomic trajectories in (A) poor SES in childhood and (B) high SES in childhood subgroups. The mortality rates are obtained from a multivariable model adjusted for age (ordered quintiles), sex and marital status. SES, socioeconomic status.
Socioeconomic trajectories among individuals with high SES in childhood
Subjects with high childhood SES experienced increased risk of total (44%) and CVD (90%) death, respectively, and a weaker association was found with cancer death (29%) in the absence of higher educational attainment despite keeping high SES in adulthood (table 4, Model 1), compared with the group maintaining both high education and high SES in adulthood (‘stably high’ over life course). Lack of material advancements over life course did not apparently modify the risk of death, with the exception of cancer death risk, that was slightly higher, and other cause mortality risk that was lowered (table 4, Model 1).
Socioeconomic trajectories in subjects with high SES in childhood and associated risk of all-cause and cause-specific mortality
An educational and material downward mobility was associated with increased risk for total and cause-specific risk of death (table 4, Model 1).
Baseline health conditions explained from 13.2% to 16.4% of the association between the educational and material downward trajectory with total, CVD and other cause mortality (table 4).
Inflammatory biomarkers accounted for 10.9% and 13.9% of the educational downward trajectory with all-cause and CVD mortality, respectively and for 11.5% of the educational and material downward trajectory (table 4).
Cumulative mortality rates were well-separated over time with groups failing to achieve higher education reporting lower survival (figure 1B).
Cumulative socioeconomic disadvantage (CSD)
Greater cumulative exposure to SES adversity over the life course (highest vs lowest category of the CSD), increased the risk of total, CVD and other cause death (table 5). A modest part of this association was explained by inflammatory biomarkers (6.7%, 6.1% and 3.3% for all-cause, CVD and other cause mortality risks, respectively), while baseline health conditions accounted for 15% of the association between CSD with CVD mortality risk (table 5).
Association of cumulative socioeconomic disadvantage over life-course and risk of all-cause and cause-specific mortality in the Moli-sani study cohort (n=22 194)
Finally, a linear positive dose-response relationship between CSD and all-cause mortality risk was observed (p value for overall association <0.0001; p value for non-linear association=0.26; online supplementary figure 1).
Subgroup analyses
Subgroup analyses revealed an effect modification by age in the association of SES trajectories and CSD towards all-cause mortality risk. Subjects with high SES in childhood, aged <65 years at baseline, had a greater risk of death associated with an educational and material downward trajectory as compared with the elderly, for whom actually no association was observed (p for interaction=0.0033; online supplementary table 5). No effect modification by age was found in individuals with low SES in childhood (online supplementary table 6).
Highest CSD was associated with 35% increased risk of total death for those aged ≥65 years at baseline; the magnitude of the association was greater for the youngest counterparts who doubled their death risk even at an average degree of CSD (HR=1.98; 1.48 to 2.66; p for interaction=0.0021; online supplementary table 7).
Discussion
In a large general population-based cohort of Italian adults, living in a Mediterranean region, socioeconomic trajectories across the life course were associated with higher risk of all-cause and cause-specific mortality, such that subjects with a stable low socioeconomic trajectory or cumulatively exposed to unfavourable socioeconomic circumstances from childhood to adulthood reported the greatest risk.
As compared with subjects remaining ‘stably high’ over time, individuals with ‘stably low’ SES experienced 56% higher risk of total mortality and over doubled their risk of dying from non-CVD-non cancer causes.
On an 8-level trajectory perspective, lack of educational advancement was markedly associated with increased risk of total mortality, either in groups with poor SES in childhood or among subjects with high SES in early life, and, in some cases, also in presence of high material SES in adulthood. These findings suggest a predominant role of educational attainment over material resources in determining the risk of premature mortality.
Similar results were observed for CVD mortality; subjects with higher SES in childhood who failed to get a higher educational attainment were at 87% increased risk of death from CVD causes, although reporting higher material SES in adult life, as compared with the ‘stably high’ SES group.
Overall, in the present population, poor SES in childhood was inversely associated with survival, although the effect size was apparently lower than that reported by previous studies.26 27
Low childhood SES was unlikely to predict CVD mortality per se, in line with other studies suggesting no independent influence of childhood social position on cardiovascular mortality,28 and similar conclusions were reached by a systematic review providing moderate support for the role of low early-life SES and CVD mortality.29
However, our results indicate that the effect of low childhood SES on CVD mortality disappears when there is upward educational and material SES experience, but low childhood SES still may have an effect when combined with low educational or material SES in adulthood.
To further estimate the contribution of SES in early life to adult mortality risk within a life course framework, we divided the population by SES in childhood and for each subgroup, we drew four main possible trajectories acting across life course.
As compared with those remaining ‘stably low’, individuals with poor childhood SES had lower mortality risk if they experienced both high education and material SES in adulthood. A similar trend was observed for cause-specific death risk. Such data suggest a powerful role of social mobility that, although regarding only a small proportion of our study participants, seems to counterbalance the excess of risk associated with low childhood SES.
The role of social mobility is even clearer when looking at the survival estimates: indeed, individuals with poor SES in childhood who reported an upward trajectory in both educational and material circumstances over life course exhibited a similar mortality rate as the ‘stably high’ group.
For those with favourable SES conditions in childhood, lack of educational, rather than material achievements, was associated with increased total, CVD and cancer mortality risk, as compared with the ‘stably high’ group. Previous studies have largely discussed the contribution of the sets of skills and knowledge to shape later adult health likely by healthier choices, as adopting high-quality diets or physical exercising23 or even through a better capacity to obtain, process and understand basic health information and services needed to make appropriate health decisions.30 However, in our sample behavioural factors did not actually mediate the association of SES trajectories with mortality risk, and we were not able to assess the potential role of other education-related skills, such as health literacy.
A number of differences exist between our study and previous investigations using a life course framework.
First, the greatest proportion of studies rely on father’s occupation/social class12 14 16 as the unique measure of SES in childhood, and few have used a wider assessment of SES in early life;13 15 in our study, childhood SES was established by a more comprehensive measurement of material circumstances experienced in juvenile years, which includes housing, presence of hot water and overcrowding. We acknowledge, however, that in our assessment only material circumstances were evaluated, with lack of knowledge on cultural factors to which participants might have been exposed during childhood.
Second, other differences pertain to assessment of SES during adulthood as determined by an index including three different indicators of material circumstances in adult life; conversely, most studies rely on one adult SES factor only, usually occupation.13
Third, poor attention has been paid to date to distinguish the individual contribution of material and educational circumstances in shaping the relationship between SES trajectories over time and health outcomes.
In the English Longitudinal Study of Ageing,12 SES trajectories across the life course were obtained by using either paternal or participant own occupational class/position without any inclusion of the educational domain. The latter, although often related to material circumstances, still indicates a different aspect of the individual’s own SES.31
In addition, as compared with the study by Stringhini et al,12 our study on SES trajectories included a larger sample size not limited to older subjects, a more extensive assessment of SES during childhood and adulthood, and, above all, the trajectories were drawn with the clear intention to discriminate education from material adult SES.
As yet, in the Oslo Mortality Study, no attention was paid to a possible different role of education in the social mobility across time.26
In our study, we also tested the hypothesis of accumulation of risk throughout the life course and found that subjects exposed to SES disadvantages were at greater risk of all-cause and other cause mortality, as compared with those experiencing a lower degree of social disadvantage.
These findings suggest that beyond the importance of SES trajectories over time (discussed above), the accumulation of SES disadvantages (irrespective of type and time points) represents a clear risk factor for mortality, in line with previous investigations.14 29 32 33
Of interest, our results indicated a graded-by-age association between CSD and mortality, with mortality risk being highest among individuals aged <65 years at baseline, those who experienced the greatest number of exposures to adverse socioeconomic circumstances across the life course after 1949–1954. This is in agreement with findings from the Alameda study showing that relative health inequalities tended to be largest among the youngest group and weakest among the oldest group.14 Reasons for such age-gradient could rely on more resilient older individuals for whom socioeconomic factors may discriminate less well,14 in accordance with previous studies on socioeconomic inequalities among the elderly.34 35
The mechanisms through which socioeconomic disparities in health ‘get under the skin’ are only partially known. Many studies have stressed the role of health-related behaviours, which are strongly socioeconomically patterned, and more recently it has been suggested that the association between life course SES and adult chronic diseases and mortality may be explained, at least in part, by chronic inflammation.12 21
We examined the contribution of several sets of mediators that could be on the pathway(s) between SES over the life course and mortality risk. Noticeably, for the first time, a set of novel biomarkers of CVD risk was considered as possibly mediating the association. These markers of more recent development have been shown to improve CVD risk prediction36 beyond the traditional risk factors (ie, high blood pressure, lipids, smoking and so on); yet, their association with SES has been poorly explored and no previous evidence has ever considered them as possibly explaining socioeconomic disparities in health outcomes.
First, we found a socioeconomic gradient for the majority of these novel biomarkers, especially for NTproBNP and serum vitamin D levels, being less desirable in subjects in the lower SES trajectories. Second, although socioeconomically shaped, this set of biomarkers only marginally accounts for socioeconomic disparities in adult CVD mortality.
Rather, inflammatory markers seem to be involved with CVD mortality and with other causes of death although accounting for a modest proportion.
Our findings appear to be in contrast with those provided by Stringhini and colleagues,12 who showed that a substantial proportion of the SES gradient in total and CVD mortality was explained either by behavioural (43% and 24% for total and CVD death, respectively) or inflammatory markers (24% and 16% for total and CVD death, respectively).
Although we considered similar healthy behaviours and inflammatory markers, a meaningful comparison between the two studies is difficult to be made, since the English cohort comprised only older individuals; in addition, some behavioural factors in our population (eg, leisure-time physical activity, adherence to the Mediterranean diet) appear to be less socioeconomically patterned as compared with the English cohort and this may likely explain the differential role of lifestyles in mediating the association of SES with death risk.
Strengths and limitations
The present investigation has several strengths represented by its longitudinal design, the large sample size, the vast and complete information on SES indicators and the number of covariates used to rule out confounding.
It is one of the few studies adopting a life course perspective in examining the association between SES and mortality risk in a general adult population; to the best of our knowledge, it is the first investigation ever performed in a Mediterranean population. Finally, this is one of the few studies investigating the independent contribution of education and material resources in adult life to shape the relationship with mortality risk.
However, our findings should be interpreted in light of the following limitations:
Our data were gathered from an adult cohort from a small Southern Italian region, which might limit the generalisability of the findings, although our cohort is representative of the whole Italian population;22 yet, owing to a potential selection bias of our population sample, extrapolation of results to other epidemiological settings should be made with caution.
The observational nature of our study cannot fully rule out residual confounding or confounding by unmeasured factors (eg, psychosocial factors, sleep quality, quality of life).
Socioeconomic data were based on self-reported information and therefore could have been susceptible to error and bias.
Limited measures of SES at childhood which do not include information on parent’s educational status or social class.
Adults were asked to recall their SES during childhood or adolescence and these recollections may be compromised by poor recall and measurement error.37 However, circumstantial inquiries were made through simple survey questions, which may have lowered the risk of recall bias.
Health selection bias, wherein less healthy individuals in early life (at higher risk of mortality in adulthood) tend to have downward social mobility or difficulty to have an upward mobility, may confound at least in part the observed association of SES trajectories with mortality. In the present study, we were not able to account for this potential bias due to lack of data on health status in early life.
Potential problems associated with the use of a summary index of CSD obtained by mixing indicators of different dimensions of inequality (eg, childhood SES, educational achievements, adult material conditions, occupational career).
Last, subjects’ information was collected at baseline only; thus, changes possibly occurred during the follow-up could not be considered.
Conclusion
Our study provides further incentive and support to the notion that the association of SES with mortality should be addressed within a life course framework and that data on socioeconomic circumstances at only one stage of life are inadequate for fully elucidating the contribution of socioeconomic factors to health and mortality risk.
We also found that socioeconomic circumstances in early-life, both poor and favourable, are not sufficient to establish the total impact of SES on adult health; rather they should be considered in conjunction with SES data measured at different time points in life.
From a public health perspective, two main considerations should be taken: first, exposure to SES disadvantages in childhood is not an ‘unappealable conviction’ since social mobility (educational and material upward trajectory) possibly acting across life course may counterbalance the potential negative burden associated with low early-life SES; second, high SES in childhood is likely to poorly affect adult mortality if no additional achievements across life course occur. In particular, an educational upward trajectory seems to play a major role in shaping mortality risk for those with higher SES in early years.
In light of this, we conclude that poor circumstances experienced in the early life are likely to be overcome by the achievements of higher levels of education and material resources. More efforts should be made to ensure an equal access to education both for less-advantaged and well-off groups; for both of them, upper educational attainments seem to largely contribute to adult health outcomes. Our conclusions also underscore a major role of socioeconomic inequalities in young individuals, thus suggesting that exposure to SES disadvantages across life course likely represents an impelling issue for the new generation of individuals.
Finally, our study provides robust support to the theory of risk accumulation by showing that if factors acting at different life stages are combined, large differences in mortality risk will be observed.
What is already known on this subject
Socioeconomic disparities in adult mortality have been extensively documented by use of one or more indicators of socioeconomic status (SES) measured at one time-point over life course.
Scanty evidence from a life course perspective in Mediterranean populations.
Lack of knowledge on mechanisms that could be on the pathway between SES over life course and health outcomes.
What this study adds
Socioeconomic status (SES) in early-life per se is not sufficient to establish the impact of SES on adult health.
Social mobility may counterbalance the potential negative burden associated with low early-life SES.
Inflammation partially accounts for the association between SES over life course and mortality risk.
Acknowledgments
The Moli-sani research group thanks the Associazione Cuore-Sano Onlus (Campobasso, Italy) for its cultural and financial support.
References
Footnotes
Collaborators Steering Committee: Licia Iacoviello*°(Chairperson), Giovanni de Gaetano* and Maria Benedetta Donati*.
Scientific secretariat: Licia Iacoviello*° (Coordinator), Marialaura Bonaccio*, Americo Bonanni*, Chiara Cerletti*, Simona Costanzo*, Amalia De Curtis*, Giovanni de Gaetano*,Augusto Di Castelnuovo§, Maria Benedetta Donati*, Francesco Gianfagna*°,Mariarosaria Persichillo*, Teresa Di Prospero* (Secretary).
Safety and Ethical Committee: Jos Vermylen (Catholic Univesity, Leuven, Belgio)(Chairperson), Ignacio De Paula Carrasco (Accademia Pontificia ProVita, Roma, Italy), Simona Giampaoli (Istituto Superiore di Sanità, Roma,Italy), Antonio Spagnuolo (Catholic University, Roma, Italy).
External Event adjudicating Committee: Deodato Assanelli (Brescia, Italy), Vincenzo Centritto (Campobasso, Italy).
Baseline and Follow-up data management: Simona Costanzo*(Coordinator), Marco Olivieri (Università del Molise, Campobasso, Italy).
Informatics: Marco Olivieri (Università del Molise, Campobasso, Italy).
Data Analysis: Augusto Di Castelnuovo§ (Coordinator), Marialaura Bonaccio*, Simona Costanzo*, Alessandro Gialluisi*, Francesco Gianfagna*°, Emilia Ruggiero*.
Biobank and biomedical analyses: Amalia De Curtis* (Coordinator), Sara Magnacca*.
Genetic analyses: Benedetta Izzi*(Coordinator), Francesco Gianfagna*°, Annalisa Marotta*, Fabrizia Noro*.
Communication and Press Office:Americo Bonanni* (Coordinator), Francesca De Lucia (Associazione Cuore Sano,Campobasso, Italy).
Recruitment staff: Mariarosaria Persichillo* (Coordinator), Francesca Bracone*, Francesca De Lucia (Associazione Cuore Sano, Campobasso, Italy), Salvatore Dudiez*, Livia Rago*.
Follow-up Event adjudication: Livia Rago* (Coordinator), Simona Costanzo*, Amalia De Curtis*, Licia Iacoviello*°, Teresa Panzera*, Mariarosaria Persichillo*.
Regional Health Institutions:Direzione Generale per la Salute - Regione Molise; Azienda Sanitaria Regionale del Molise (ASReM, Italy); Molise Dati Spa (Campobasso, Italy); Offices ofvital statistics of the Molise region.
Hospitals: Presidi OspedalieriASReM: Ospedale A. Cardarelli – Campobasso, Ospedale F. Veneziale – Isernia,Ospedale San Timoteo - Termoli (CB), Ospedale Ss. Rosario - Venafro (IS),Ospedale Vietri – Larino (CB), Ospedale San Francesco Caracciolo - Agnone (IS);Casa di Cura Villa Maria - Campobasso; Fondazione di Ricerca e Cura GiovanniPaolo II - Campobasso; IRCCS Neuromed - Pozzilli (IS).
* Department of Epidemiology and Prevention, IRCCS Neuromed, Pozzilli, Italy
°Department of Medicine and Surgery, University of Insubria, Varese, Italy
§ Mediterranea, Cardiocentro,Napoli, Italy
Baseline Recruitment staff is available at
http://www.moli-sani.org/index.php?option=com_content&task=view&id=21128&Itemid=118
Contributors MB, LI and ADiC contributed to the conception and design of the work, and interpretation of data. SC, ADeC and MP managed data collection of the Moli-sani Study. MB and ADiC analysed the data. MB wrote the manuscript. CC, MBD, GdG and LI originally inspired the research and critically reviewed the manuscript.
Funding The enrolment phase of the Moli-sani Study was supported by research grants from Pfizer Foundation (Rome, Italy), the Italian Ministry of University and Research (MIUR, Rome, Italy)–Programma Triennale di Ricerca, Decreto no. 1588 and Instrumentation Laboratory, Milan, Italy. Funders had no role in study design, collection, analysis and interpretation of data; in the writing of the manuscript and in the decision to submit the article for publication. Marialaura Bonaccio was supported by a Fondazione Umberto Veronesi Fellowship. Simona Costanzo was the recipient of a Fondazione Umberto Veronesi Travel Grant. All authors were and are independent from funders. The present analyses were partially supported by the Italian Ministry of Health 2013 (Young investigator grant to MB, number: GR-2013-02356060), the Italian Association for Cancer Research (A.I.R.C.) with grant AIRC "5x1000" to LI, Ref. n. 12237 and by BiomarCaRE (Biomarkers for Cardiovascular Risk Assessment in Europe): European Commission Seventh Framework Programme FP7/2007-2013 (HEALTH-F2-2011-278913).
Competing interests None declared.
Patient consent for publication Not required.
Provenance and peer review Not commissioned; externally peer reviewed.