Article Text

Abstract
Background Socioeconomic deprivation is a key determinant for health. In England, the Index of Multiple Deprivation (IMD) is a widely used composite measure of deprivation. However, little is known about its spatial clustering or persistence across time.
Methods Data for overall IMD and its health domain were analysed for 2004–2015 at a low geographical area (average of 1500 people). Levels and temporal changes were spatially visualised for the whole of England and its 10 administrative regions. Spatial clustering was quantified using Moran’s I, correlations over time were quantified using Pearson’s r.
Results Between 2004 and 2015 we observed a strong persistence for both overall (r=0.94) and health-related deprivation (r=0.92). At the regional level, small changes were observed over time, but with areas slowly regressing towards the mean. However, for the North East, North West and Yorkshire, where health-related deprivation was the highest, the decreasing trend in health-related deprivation reversed and we noticed increases in 2015. Results did not support our hypothesis of increasing spatial clustering over time. However, marked regional variability was observed in both aggregate deprivation outcomes. The lowest autocorrelation was seen in the North East and changed very little over time, while the South East had the highest autocorrelation at all time points.
Conclusions Overall and health-related deprivation patterns persisted in England, with large and unchanging health inequalities between the North and the South. The spatial aspect of deprivation can inform the targeting of health and social care interventions, particularly in areas with high levels of deprivation clustering.
- deprivation
- clusters
- spatial analysis
- epidemiology
- health inequalities
This is an Open Access article distributed in accordance with the terms of the Creative Commons Attribution (CC BY 4.0) license, which permits others to distribute, remix, adapt and build upon this work, for commercial use, provided the original work is properly cited. See: http://creativecommons.org/licenses/by/4.0/
Statistics from Altmetric.com
Introduction
The impact on health of socioeconomic deprivation—for example, lower levels of income, wealth and education—is well established. At the area level, greater deprivation is associated with worse clinical outcomes,1 2 higher comorbidity levels3 4 and lower levels of healthcare access and utilisation.5 6 Higher individual-level socioeconomic deprivation has been linked to poorer health for secondary school students in New Zealand,7 higher oral health-related hospitalisation rates in Australia,8 poorer self-reported health in Germany and the USA,9 10 worse perinatal outcomes in France11 and higher all-cause and cause-specific mortality in England and Wales.12
Socioeconomic deprivation is often found to be a more powerful determinant of health outcomes than medical care.13 In US studies, only 10%–15% of preventable mortality has been estimated to be attributed to medical care.14 In England, performance of primary care practices on a range of quality of care indicators was not found to be associated with all-cause or cause-specific mortality,15 whereas local area deprivation was the strongest measured predictor.16 This highlights the importance of socioeconomic deprivation, and the need for accurate and valid measurement to inform policies to address its health impacts.
A major challenge is developing measures that reliably quantify deprivation. Despite international interest, most countries have been slow to create comprehensive deprivation indices; for example, composite indices have only recently been proposed in Canada,17 18 and the USA has yet to develop its own alternative.19 20 In England, the first widely used composite measure of material deprivation, the Townsend Index, was created in the 1980s, incorporating four indicator variables derived from decennial census data (unemployment, non-car ownership, non-home ownership and household crowding).21 A similar measure, the Carstairs Index, was compiled for Scotland,22 and New Zealand developed its own census-based aggregate measure of deprivation.23
In England, a more comprehensive measure, the Index of Multiple Deprivation (IMD), was developed in the 2000s incorporating routine administrative data covering a wider range of indicators (a total of 37 in 2004).24 Iterations of the index have been reported for 2004,25 2007,26 201027 and 2015.28 The current measure quantifies relative deprivation across seven domains, known collectively as the English Indices of Deprivation (income, employment, education and skills, health and disability, crime, barriers to housing and services, and living environment), using an area-based model at a low geography (average of 1500 people) although it was originally developed for a higher level.29 The overall IMD is calculated as a weighted mean across the seven domains, with income and employment deprivation given the largest weight (22.5% each), followed by health and education deprivation (13.5% each), and with the other three domains given equal weights (9.3%). English epidemiological studies routinely incorporate the index or individual component domains.
Despite the clinical importance of the English Indices of Deprivation, some aspects remain under-researched. The first is the spatial nature of deprivation, that is, how clustered it is. The second is the longitudinal trends of clustering and regional deprivation (although the IMD is standardised in each time point and thus does not allow for investigating absolute change,30–32 it is possible to assess relative changes over time). And the third is the persistence of deprivation over time. All three are important to help guide the organisation of healthcare services and to target social and health interventions. In this study, we longitudinally and spatially describe health-related (ie, the health and disability domains) and overall deprivation in England (the IMD). We hypothesised that between 2004 and 2015, and especially after the 2008 financial crisis, spatial autocorrelation for deprivation would increase, indicating increasing spatial clustering of both poverty and wealth. We also quantify the longitudinal and spatial properties of deprivation within each of 10 administrative English regions and make comparisons across them. Finally, we quantify the persistence of deprivation over the study period.
Methods
English Indices of Deprivation
Details about the subdomains included in each domain are provided in table 1. For each domain, the subdomains are normalised on ranking and then standardised, before factor analysis is used to inform on the weighting of each subdomain. Therefore, the subdomain weighting varies over time while the domain weighting does not. The health deprivation domain aggregates information on years of potential life lost, illness and disability, acute morbidity, and mood and anxiety disorders. Their respective weights in 2015 were 0.244, 0.287, 0.254 and 0.216. The years these indicators cover also vary due to data availability and other reasons. For 2015, for example, years of potential life lost were based on 2008–2012 calendar year data, illness and disability on 2013 calendar year data, acute morbidity on 2011/2012–2012/2013 financial year data and mood and anxiety disorders on 2012–2013 calendar year data.
Index of multiple deprivation domains, 2015*
Given the normalisation and standardisation of the subdomains, the aggregate measures, that is, overall IMD and each of the seven domains, are relative and cannot account for longitudinal improvement or deterioration at the country level. However, longitudinal analyses can still inform on distributional changes in the aggregate measures over time. Deprivation scores are calculated and assigned to very low UK geographical units. Although small changes to the indices have been implemented over time, comparability has been maintained since the methods used are the same and no major changes have been considered necessary.28 Separate deprivation measures exist for other UK countries, with varying degrees of similarity to the English IMD.
Lower super output areas
The low geographical units to which the indices of deprivation are assigned are called lower super output areas (LSOA) and they are designed to contain around 1500 inhabitants, on average. To roughly comply with this size-based definition, they can change following a decennial census. Thus, following the 2011 census, English LSOAs were reorganised into 32 844 units (from 32 482 after the 2001 census) to better reflect population changes, mainly increases.33 Nevertheless only 2.5% of English LSOAs merged, split or underwent a more complicated change.34 Census-adjusted population estimates over time and for each English LSOA were obtained from the Office of National Statistics.35 Using the 2015 population estimates, we observed that mean LSOA size was 1654 inhabitants (median: 1595; 1st centile 1102; 99th centile 2926). Since pre-2011 deprivation indices were only reported using 2001 LSOAs we created a weighted means algorithm to assign them to 2011 LSOAs and allow a seamless comparison over time. Spatial coordinates for the 2011 LSOAs were obtained from the Office of National Statistics (ONS) open geography portal.36 We used digital vector boundaries generalised to 20 m and clipped to the coastline to reduce size and improve visualisation. Finally, LSOAs were organised into 10 regions to allow for comparisons within England, based on the 2006 restructuring of Strategic Health Authorities: North East, North West, Yorkshire and the Humber, East Midlands, West Midlands, East of England, London, South East Coast, South Central and South West.37
Analyses
Deprivation outcomes of interest were overall and health-related IMD, in 2004, 2007, 2010 and 2015. We also analysed the fourth health-related IMD domains separately: years of potential life lost, illness and disability, acute morbidity, and mood and anxiety disorders. Outcomes and their temporal changes were visualised using spatial maps for all of England and each of the 10 regions.
Spatial autocorrelation, or correlation in a signal among nearby locations in space, was assessed and quantified using Moran’s I.38 This measure accounts for the multidimensional and multidirectional nature of spatial autocorrelation, and can identify the presence or not of deprivation clusters. A higher value than the one expected under a random spatial pattern would indicate that deprived areas are clustered together and hence a deprived LSOA is more likely to have deprived LSOAs as bordering or close neighbours (and similarly for affluent LSOAs), with a value of 1 indicating perfect spatial correlation. We compared the values for Moran’s I in the four time points to assess whether existing spatial autocorrelation for deprivation in 2004 has changed over time. An increasing value for Moran’s I would indicate an increase in deprivation-related spatial segregation. The measure was calculated for the whole of England and each of the 10 regions, to allow for within-England comparisons.
Pairwise correlations across the four time points were computed (Pearson’s r) to quantify the persistency of area deprivation. Pairwise correlations between overall and health-related IMD and across health-related IMD subdomains were computed, to assess whether the two main outcomes and the subdomains are different enough to justify reporting on all. To visualise and compare temporal changes in the average deprivation levels between the 10 English regions, we plotted population weighted box plots for each of the two main outcomes and the health subdomains. Analyses were executed with Stata V.14.1 and R V.3.3.1. Due to the size of the data set, effectively the whole of England, statistical significance is irrelevant; any comparison would be statistically significant and thus we focus on effect sizes wherever possible.
Results
Both overall deprivation and health-related deprivation were strongly correlated at all time points, indicating small changes over time. Pearson’s r remained above 0.94 for overall deprivation (2004 vs 2007: r=0.98; 2004 vs 2010: r=0.97; 2004 vs 2015: r=0.94) and 0.92 for health-related deprivation (2004 vs 2007: r=0.97; 2004 vs 2010: r=0.93; 2004 vs 2015: r=0.92). Correlation between overall and health-related IMD was strong, as anticipated, but the strength somewhat deteriorated over time from r=0.88 in 2004 to r=0.84 in 2015. As expected, subdomains of the health-specific deprivation were strongly correlated with overall deprivation, with the lowest values observed for mood and anxiety disorders versus acute morbidity (r=0.57 in 2004 and r=0.63 in 2015) and the highest for years of potential life lost versus the comparative illness and disability ratio (in r=0.79 2004 and 2015).
Spatial maps were plotted for the whole of England and each region, for all years and each deprivation outcome (overall IMD and health-related IMD and its four subdomains). We present overall deprivation for 2015 and the whole of England in the main paper (figure 1), and for health-related deprivation in online supplementary appendix 1 figure A1. Longitudinal spatial maps for all other regions and the whole of England are provided in online supplementary appendices 2a–2f, while a longitudinal spatial map for London which allows for visual comparisons over time is presented in online supplementary appendix 1 figure A2.
Supplementary file 1
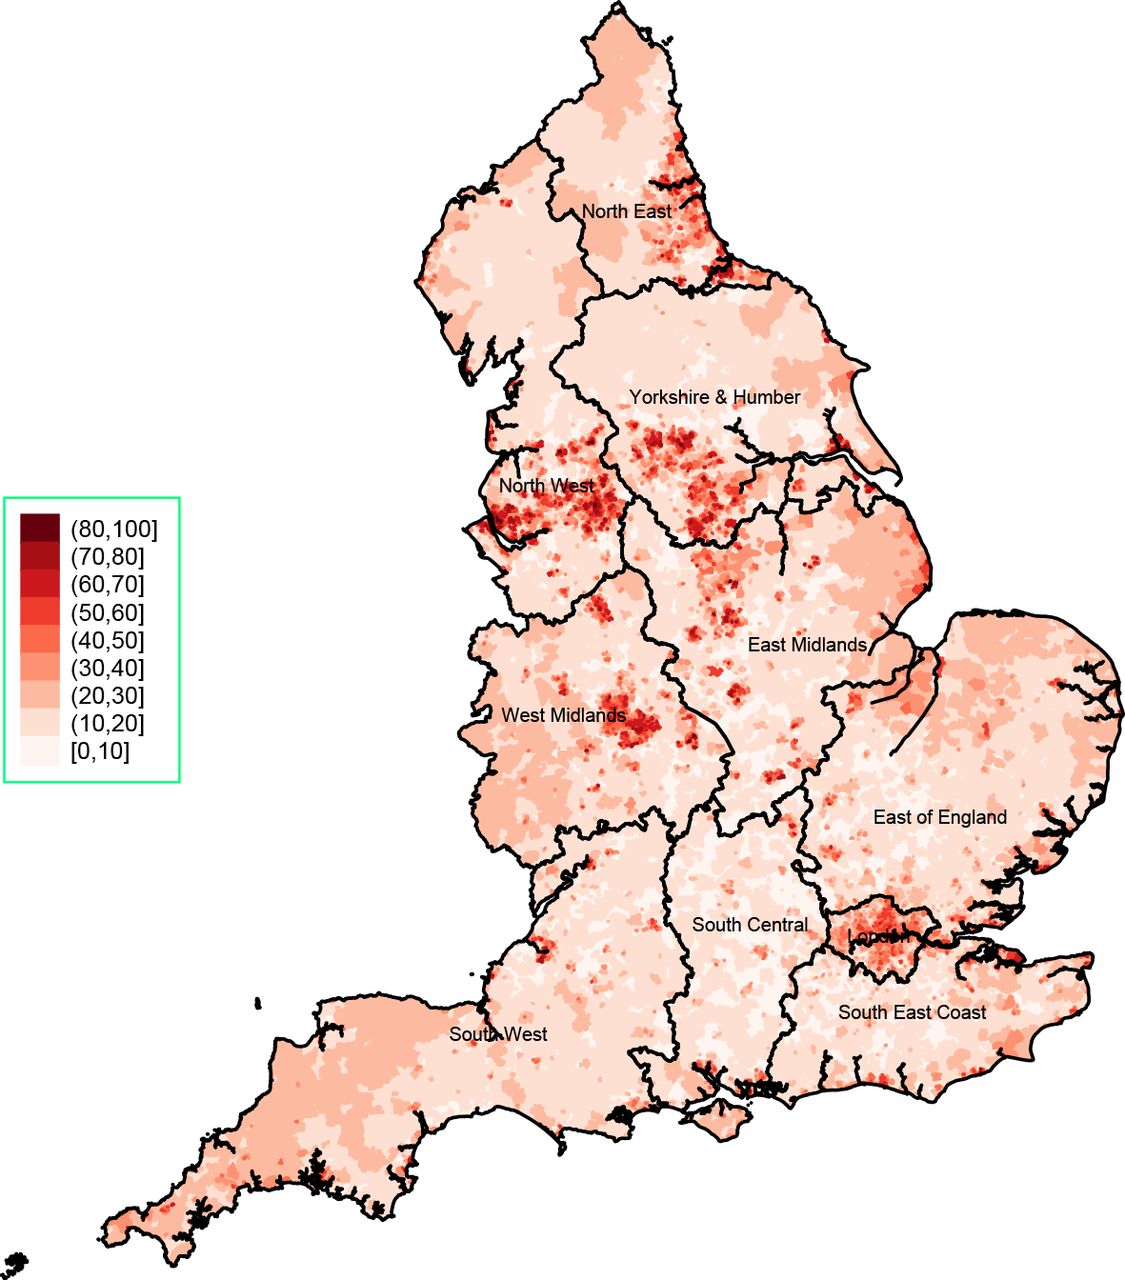
Overall deprivation for England, 2015.
Temporal changes of deprivation for English regions are presented in figure 2. Although changes over time are small, areas appear to be very slowly converging towards the English average for both overall and health-related deprivation. However, for the three northern regions where health-related deprivation was the highest (North East, North West, and Yorkshire and the Humber) the decreasing trend between 2004 and 2010 seems to have been reversed and we observed increases in 2015. The findings are similar across all four health subdomains (online supplementary appendix 1 figures A3 and A4).
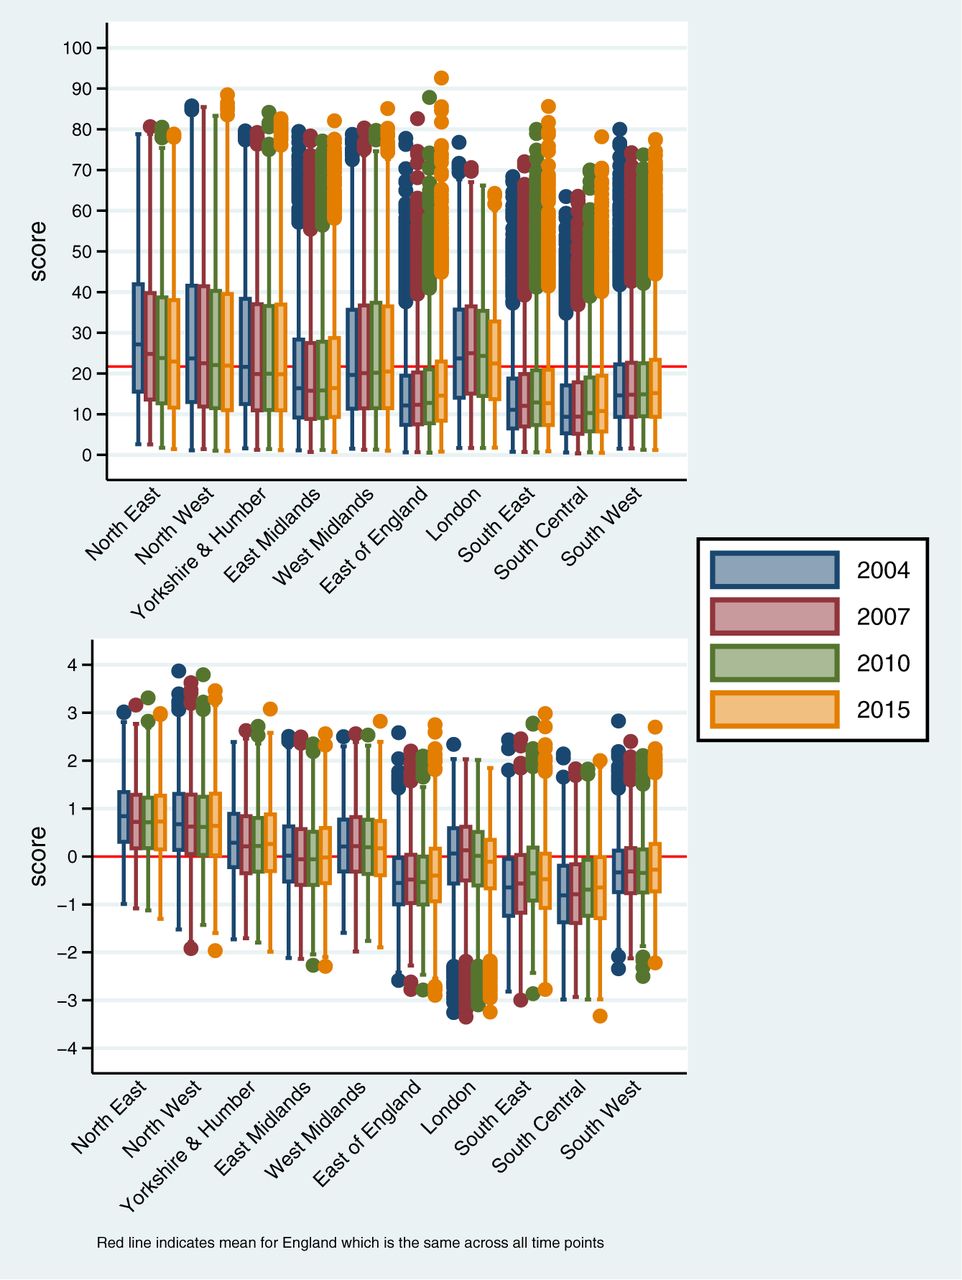
Overall (top) and health-related (bottom) deprivation for English regions, over time. Red line indicates mean for Eangland which is the same across all time points.
Spatial autocorrelation results did not support our original hypothesis of increasing spatial clustering over time (figure 3). Across the whole of England and for overall deprivation, Moran’s I was 0.0972 in 2004 (95% CI 0.0970 to 0.0974) but by 2015 it had linearly dropped to 0.0686 (95% CI 0.0683 to 0.0688), indicating a reduction is spatial autocorrelation and clustering. However, the picture was different for health deprivation where spatial autocorrelation was higher at a level of 0.1725 in 2004 (95% CI 0.1723 to 0.1728), dropped to 0.1490 in 2007 (95% CI 0.1488 to 0.1493) and remained relatively stable thereafter (0.1450 in 2010, 95% CI 0.1448 to 0.1453; 0.1505 in 2015, 95% CI 0.1503 to 0.1508). In addition, the levels and trends of spatial autocorrelation were not consistent across the health deprivation subdomains. For years of potential life lost, autocorrelation was relatively stable between 2004 and 2010, but moderately increased in 2015. Spatial autocorrelation was higher for the comparative illness and disability ratio, but it deteriorated over time, and in 2015 it was lower than was observed for years of potential life lost. Acute morbidity autocorrelation remained stable over time, although a small increase was seen for 2015. Finally, autocorrelation for mood and anxiety disorders has changed little over time and was the highest observed in 2015. Overall, regarding the health IMD subdomains, spatial clustering appears to be increasing for years of potential life lost and acute morbidity (figure 3).

Spatial autocorrelation with Moran’s I for deprivation domains and subdomains, for the whole of England over time. IMD, Index of Multiple Deprivation.
Marked regional variability was observed in the two aggregate deprivation outcomes, both for 2004 spatial autocorrelation levels and for their changes over time (figure 4). The lowest autocorrelation was seen in the North East and it has changed very little over time, while the South East had the highest autocorrelation at all time points although it reduced over time. For the East of England and the South Central coast, autocorrelation for overall deprivation and especially health-related deprivation increased in 2015, in contrast to the trends for the rest of the country. Regional variation in autocorrelation was also observed for the health deprivation subdomains (online supplementary appendix 1 figures A5 and A6). The smallest regional variation was seen for years of potential life lost, with the South East reporting the highest levels and the North East reporting the lowest. Changes over time were small for this subdomain, but trends also varied by region. For the comparative illness and disability ratio, regional variability was also modest and the general decreasing trend was seen in all regions, while the South East and South West had consistently the highest level and the North East the lowest. For the other two subdomains, acute morbidity and mood and anxiety disorders, regional changes in autocorrelation over time are more unstable, with the East of England and the South Central demonstrating high levels of autocorrelation.

Spatial autocorrelation with Moran’s I for overall (top) and health-related (bottom) deprivation by region, over time.
Discussion
From 2004 to 2015, overall and health-related deprivation strongly persisted at the LSOA level. Regional changes over time were modest for overall deprivation, with regional levels converging towards the English average. However, the picture was different for health-related deprivation (and within each of its four subdomains: years of potential life lost, illness and disability, acute morbidity, and mood and anxiety disorders), with significant national heterogeneity observed and levels consistently higher in the North East and North West, and regional differences persisting over time. Our findings do not provide evidence of increasing clustering for overall deprivation, with autocorrelation for overall deprivation declining over time for the whole of England and each of its 10 regions, with some exceptions in 2015. Despite this overall decreasing trend, regional variation in overall deprivation autocorrelation was observed, with deprivation in the South coast appearing much more clustered than the North, particularly the North East.
For health-related deprivation, levels of autocorrelation were consistently higher than what was observed for overall deprivation, especially for the South coast. However, clustering levels of health-related deprivation for the whole of England remained broadly the same since 2007, with some regional variation of, primarily decreasing, trends. Different autocorrelation trends were observed for the subdomains, with clustering increases for years of potential life lost and acute morbidity.
Strengths and limitations of the study
This large longitudinal study used data for the whole of England (53 million people in 2011), to investigate spatial and longitudinal patterns of overall and health-related deprivation. To our knowledge, it is the first study of its kind to provide an insight into the temporal persistence of deprivation and its clustering.
However, some limitations exist. First, there have been some minor changes in the underlying indicators of deprivation over time, which might have influenced our estimates. However, the trends we observe persist between 2007 and 2010 when there were no changes to the measures, while the health deprivation domain has remained unchanged across the whole time period. Second, the IMD and each of its domains are normalised and standardised at each time point, hence the measure cannot account for longitudinal improvement or deterioration at the country level,39 only for relative regional changes. Third, there are varying levels of lag in the underlying indicators included in each IMD version (eg, data from 2012 to 2013 used for the 2015 IMD), but there is no data overlap across them. Fourth, it is possible that analyses at the LSOA level are masking the relative deprivation trends in smaller and extremely deprived communities.40 Finally, there was a boundary change following the 2011 census which may have affected our findings,41 but only 2.5% of LSOAs were affected while we developed an algorithm to make reasonable population weighted-based estimates for these localities, depending on whether they merged, split or another change occurred.
Findings
Overcoming material and health deprivation is a global challenge. Neighbourhood connectivity has been shown to be important, both in terms of the housing market and the labour market.42 However, a lack of connectivity does not fully explain deprivation, which poses a diverse challenge, a fact that needs to be taken into account by policy interventions. The very high persistence of neighbourhood deprivation over the 11-year study period (2004–2015), relative to the rest of England, was expected but is nevertheless of concern and highlights the need for more social interventions to tackle inequality and social mobility in England.
The social inequality gap for the North of England, and how it compares to the South, is well known,43 although our results for overall deprivation indicate it has been slowly closing. In the context of a universal healthcare provider, the National Health Service, persistent deprivation plays an important role in premature mortality in England,44 45 but it does not fully explain the persistently higher levels of all-cause mortality in the North,46 which has recently increased at an alarming rate for those aged 25–44.47 Although health selective migration is likely to be a factor,48 and it is likely to influence inequalities by age,49 we found that levels of health-related deprivation were consistently higher in the North, in premature mortality and illness and disability, acute morbidity (hospital admissions), and mood and anxiety disorders.
Despite the longitudinal persistence of overall deprivation, the spatial clustering of neighbourhood deprivation appears to have slowly decreased over time, although large regional variation was observed both in levels of clustering and their changes. For most regions, this reducing trend plateaued after 2010, possibly as a consequence of the 2008 financial crisis, with London and the South East the notable exceptions. This pattern may be related to gentrification projects, which have aimed to regenerate deprived inner city neighbourhoods.50 Gentrification is a controversial and still debated practice, accused of displacement, segregation and social polarisation,51 while too often the regeneration agenda is not inclusive.52
High levels of spatial clustering for health-related deprivation would have implications for the planning of health services and interventions, since they would imply a non-uniform distribution of need across a region with hot spots of high levels of morbidity. To address such spatial health inequality, services may need to be redesigned to take this factor into account.53 For example, general practices may be incentivised to relocate within such hot spots, and targeted interventions may need to be prioritised in these areas. Similarly, infrastructure and regeneration spending needs to be inclusive and weighted towards the health-deprivation hot spots, rather than uniform. For the South of England, we observed modest levels of clustering, which even increased for the South Central region.
The regional clustering of health-related deprivation (and its levels) will be affected by external economic migration, which varies greatly across regions.54 On average, external migrants are likely to be more materially deprived than English-born residents but with better health, at least initially.55 The age structure of the population will also play an important role, and the population in the North of England is older.47
Conclusions
Socioeconomic deprivation is a key determinant of health. In order to improve population health, policymakers need to invest in healthcare, and—and perhaps more importantly—to address material and educational inequalities. The time lag between effective policy intervention and reductions in inequality highlights the need for urgent action. We found that from 2004 to 2015, overall and health-related deprivation patterns persisted in England at a low geographical level. In terms of relative deprivation comparisons, regional levels of overall deprivation appear to be slowly converging to the mean over time. However, regional variation of health-related deprivation changed little, highlighting large and unchanging health inequalities between the North and the South of England. Although this variation can be partially explained by population differences, more needs to be done to address the issue.
Over time, the clustering of overall deprivation, and to a smaller extent of health-related deprivation, decreased, with the regional trends demonstrating high heterogeneity. This decrease and the underlying causes need to be better understood. The spatial aspect of deprivation is often overlooked, but it can provide vital information for the effective organisation of health services and targeting of health or social interventions. This is particularly important for areas such as the South coast of England, where there are high levels of clustering.
What is already known on this subject
Socioeconomic deprivation is a key determinant of health.
However, very little is known about the spatial clustering of English deprivation or its persistence across time.
The Index of Multiple Deprivation (IMD) is a comprehensive aggregate measure incorporating seven domains of deprivation.
The IMD can provide insight on relative changes in deprivation over time at the regional level.
What this study adds
Between 2004 and 2015, overall and health-related deprivation in England strongly persisted at a low geographical area level.
For the North of England, where health-related deprivation was the highest, the decreasing trend in health-related deprivation was reversed by 2015.
Spatial clustering for both overall and health-related deprivation appears to have decreased over time, with some exceptions in 2015.
Spatial aspects of deprivation can inform more effective organisation of health services and the targeting of health or social interventions, particularly in areas where there are high levels of deprivation clustering.
Supplementary file 2
Supplementary file 3
Supplementary file 4
Supplementary file 5
Supplementary file 6
Supplementary file 7
Acknowledgments
We thank the Office of National Statistics for the wealth of information they have collected and systematically organised, which made this study possible.
References
Footnotes
Contributors EK designed the study, extracted the data from all sources, performed the analyses and drafted the manuscript. MAM, HvM, AMR, DMA, IEB and TD critically edited the manuscript. EK is the guarantor of this work and, as such, had full access to all the data in the study and takes responsibility for the integrity of the data and the accuracy of the data analysis.
Funding MRC Health eResearch Centre Grant (MR/K006665/1) supported the time and facilities of EK and IEB.
Competing interests None declared.
Provenance and peer review Not commissioned; externally peer reviewed.
Data sharing statement The data used in this study are freely available and the authors are willing to share in an organised and cleaned final data set.