Article Text

Abstract
Background Mortality rates are higher in Scotland relative to England and Wales, even after accounting for deprivation. This ‘excess’ mortality is partly due to higher mortality from alcohol-related and drug-related deaths, violence and suicide (particularly in young adults). This study investigated whether cohort effects from exposure to neoliberal politics from the 1980s might explain the recent trends in suicide in Scotland.
Methods We analysed suicide deaths data from 1974 to 2013 by sex and deprivation using shaded contour plots and intrinsic estimator regression modelling to identify and quantify relative age, period and cohort effects.
Results Suicide was most common in young adults (aged around 25–40 years) living in deprived areas, with a younger peak in men. The peak age for suicide fell around 1990, especially for men for whom it dropped quickly from around 50 to 30 years. There was evidence of an increased risk of suicide for the cohort born between 1960 and 1980, especially among men living in the most deprived areas (of around 30%). The cohort at highest risk occurred earlier in the most deprived areas, 1965–1969 compared with 1970–1974.
Conclusions The risk of suicide increased in Scotland for those born between 1960 and 1980, especially for men living in the most deprived areas, which resulted in a rise in age-standardised rates for suicide among young adults during the 1990s. This is consistent with the hypothesis that exposure to neoliberal politics created a delayed negative health impact.
- SUICIDE
- Health inequalities
- DEMOGRAPHY
- MORTALITY
- SOCIAL EPIDEMIOLOGY
This is an Open Access article distributed in accordance with the Creative Commons Attribution Non Commercial (CC BY-NC 4.0) license, which permits others to distribute, remix, adapt, build upon this work non-commercially, and license their derivative works on different terms, provided the original work is properly cited and the use is non-commercial. See: http://creativecommons.org/licenses/by-nc/4.0/
Statistics from Altmetric.com
Introduction
Scotland has higher mortality rates than the rest of Britain, higher mortality rates than all other Western European countries and wider health inequalities than the rest of Western Europe.1 ,2 Scotland's mortality outcomes have not always, however, compared so badly.1 It is only from around 1950 onwards that the rate of improvement in mortality started to lag behind other populations. The rate of improvement faltered again during the 1980s with some areas experiencing an increase in mortality rates.3
Around two-thirds of the higher mortality in comparison to the rest of Britain could be explained by higher deprivation in 1981, but less than half of the increasing difference was explained by deprivation by 2001.4 This ‘excess’ mortality (ie, after accounting for deprivation), the lagging mortality compared with the rest of Europe and the greater health inequalities are due to higher mortality from alcohol-related and drug-related deaths, violence and suicide (particularly in young adults) and higher mortality from heart disease, stroke and cancer throughout adulthood.5 Suicide rates in Scotland for men and women are now ranked above those for many other European countries,6–8 although the rate for women has declined since 1980 and that for men is now also in decline9 (as are mortality rates due to alcohol10 and violence11). The reasons for these mortality phenomena remain unclear, although many hypotheses are under consideration.5 ,12
It is possible that period or cohort effects (age effects would have been adjusted for in the age-standardised analyses) may be partially responsible for the trends in these outcomes. It has been specifically hypothesised (in the academic literature,5 ,12 ,13 mainstream press and autobiographical accounts14–16) that there may have been a large section of the Scottish population which was disproportionately impacted by the introduction of neoliberalism. In the UK context, this is associated with the election of the Conservative government in 1979, which dramatically changed social and economic policy during the 1980s. This new approach favoured monetarist economic policies which favoured lower taxation and the growth of the financial services industry (particularly in south-east England), but resulted in increased unemployment, further deindustrialisation and a large increase in income and regional inequality.13 ,17 It is therefore possible that this political change may have impacted on health in the same way as in other countries,18 and particularly on the working class living in the deindustrialising regions.19 ,20
If this exposure was to be partially responsible for the mortality phenomena in Scotland, it would be expected that the cohort of individuals most directly exposed (ie, working class, working age adults during the period 1979–1990) would be the most profoundly affected. There are clear differences in suicide rates by deprivation.8 ,21 However, there is a substantial degree of ambiguity around this exposure cohort. Although more men than women were likely to have been impacted directly in terms of job losses, women would have been similarly impacted by the loss of household income and the associated trauma of the changing political context. The timing of the exposure is also rather indistinct with deindustrialisation occurring earlier22 and the change in political approach being sustained thereafter (although it is clear that the 1980s did represent a marked turning point in political outlook).13 ,17 There is also the potential for delayed impacts.
This paper expands the existing epidemiology on suicide in Scotland,6–9 ,23 by exploring age, period and cohort (APC) effects using novel visualisation techniques and applying the intrinsic estimator (IE), a recent development in APC modelling that aims to obtain unbiased estimates of the individual components (A, P and C). A particular focus is whether there is evidence of negative impacts from the political changes in the 1980s, especially for those living in the most deprived areas of Scotland, which might explain the recent trends in suicide in Scotland.
Methods
Data sources
We obtained data on the number of deaths due to probable suicide (deaths from intentional self-harm or by events of undetermined intent) by sex, single year of age at death and year of registration of death for Scotland from 1974 to 2013 (the age was unknown for one male death, so this was excluded from the analyses), and mid-year population estimates for Scotland by sex and single year of age, from age 0 to 90 years and over, from 1974 to 2013, from the National Records of Scotland (NRS).
The convention in Scotland followed by NRS is to produce statistics of suicides by combining the numbers of deaths from intentional self-harm and deaths caused by events of undetermined intent because it is thought that most of the latter are likely to be suicides, see http://www.nrscotland.gov.uk/statistics-and-data/statistics/statistics-by-theme/vital-events/deaths/suicides/the-definition-of-the-statistics. This is the UK standard approach; see the Office for National Statistics Quality and Methodology Information Paper http://www.ons.gov.uk/peoplepopulationandcommunity/birthsdeathsandmarriages/deaths/qmis/suicideratesintheukqmi. Suicides 1974–1978 were coded by International Classification of Diseases (ICD) 8 E950-E959 and E980-E989, 1979–1999 by ICD9 E950-E959 and E980-E989, and from 2000 onward by ICD10 X60-84, Y87.0, Y10-34 and Y87.2. Suicide coding altered in 2011 with a change to how ‘drug abuse’ deaths from ‘acute intoxication’ are classified; ‘drug abuse’ deaths from ‘acute intoxication’ with undetermined intent that would previously have been counted under ‘mental and behavioural disorders’ became counted as ‘poisoning’, increasing the suicide numbers. Analyses used the pre-2011 coding for all years of data with suicides post-2010 identified according to direction by NRS, see http://www.nrscotland.gov.uk/statistics-and-data/statistics/statistics-by-theme/vital-events/deaths/suicides/main-points and http://www.nrscotland.gov.uk/files/statistics/vital-events/changes-to-coding-of-causes-of-death-between-2010-2011.pdf
Analyses by deprivation were based on Carstairs deprivation categories.24 For suicide data, Carstairs decile look-up files were obtained from the Information and Statistics Division Scotland (ISD) website and matched in on appropriate postcode sectors (average population size in Scotland of ∼5600 in 2011). Data were then assigned to an appropriate Carstairs decile; cases with no associated Carstairs were removed from analyses by deprivation. Population data by Carstairs deciles, from age 0 to 85 years and over, were obtained from ISD with Carstairs deciles matched in for each census on postcode sectors and then interpolated between the censuses to obtain the populations for the in-between years. In analyses, data for the two most deprived Carstairs deciles were grouped to create the most deprived quintile and the remaining deciles to create the less deprived four-fifth of the population.
Suicide cases are rare in those aged under 15 years or over 90 years so, unless stated otherwise, analyses were restricted to those aged 15–89 years, or aged 15–84 years for deprivation analysis (the upper age limit was dictated by the age structure of the available population data). Data manipulation was performed using IBM SPSS Statistics V.19 and Microsoft Excel 2010.
Descriptive analysis
Presentations of trends in death rates for all ages from 1974 to 2013 by sex were age-standardised to the 2013 version of the European Standard Population. For age effects analysis, data from 1974 to 1993 and data from 1994 to 2013 were separately combined for presentation of crude death rates by 5-year age groups (from 0–4 to 85+ years) for age at death by sex.
To examine APC effects, suicide rates were plotted using data grouped by age at death (5-year age groups), year of death (5-year periods) and birth cohort (those born over 10-year periods from 1895 to 1994).
Shaded contour plots
Shaded contour plots (SCPs) were produced in R25 (SCPs are levelplots (heatmaps) with labelled contour lines added, which link positions on the levelplot that have the same value. The same information is therefore presented in two ways in a figure; in this paper, lines and colours show population age groups with the same suicide rates over time). Separate plots were produced for men and women, and then separately for the most deprived fifth and the less deprived four-fifths of the population, created using rates for single age and year of death or for single age and birth year (for more details, see online supplementary appendix 1). In SCPs of year of death on the horizontal axis and age on the vertical axis, period effects appear as vertical patterns, age effects as horizontal patterns and cohort effects as diagonal ‘disruptions’ running along diagonal lines from the bottom left to top right, with a gradient of 1 year of age per calendar year. In SCPs of birth year, rather than year of death on the horizontal axis cohort effects instead run vertically. SCPs of birth year rather than year of death were therefore used to make cohort effects easier to identify visually.
Supplementary appendix
IE models
For APC regression modelling, suicide and population data were grouped into 5-year age groups (ages 15–89 years for the overall population and 15–84 years for the deprivation analyses) and 5-year time periods (from 1974 to 2013) stratified by sex and Carstairs deprivation. The IE command (apc_ie) in Stata V.13 (Stata Corp LP, College Station, Texas, USA) was used.26 As the count data were found to be overdispersed, negative binomial maximum likelihood models were used. Models were fitted separately for each sex and deprivation specific strata. The year for the cohorts was calculated as a function of the 5-year age and period groups, as being equal to mean period minus mean age. Standard negative binomial regression models were also run to ensure that age, period or cohort alone or any combination of two factors did not fit the data better than a full APC model.
Results
Age-sex-standardised trends over time
Age-standardised suicide rates (see online supplementary figure S1) for men increased from the 1970s to around 2000 before subsequently declining, but decreased among women in the early 1980s before stabilising. Rates for men have been consistently higher than those for women and the gap has widened.
Supplementary figures
The age-standardised suicide rates were higher for those living in the most deprived areas over the time period (see online supplementary figure S2), with the decline among women only evident for the less deprived group.
Shaded contour plots
Suicide rates differ markedly over the life course (see online supplementary figures S3 and S4) and the age profiles have changed over the period and differ by sex. The peak rate for women has been older than that for men, indeed the peak age declined rapidly for men around 1990 as rates increased for young men and decreased for men aged over 50 years. Subsequently, between 1990 and 2000, the peak age of suicide began to increase for men, suggesting a cohort effect for those born between 1960 and 1980 (figure 1); the most affected cohort being 1965–1974 where suicides peaked at about 45–50/100 000 for 26 year olds (around the 1972 cohort) and also 10 years later at 45/100 000 for 35 year olds, having increased from around 25/100 000 and 35/100 000, respectively, in the 1960 birth cohort.

Smoothed shaded contour plot of age-year specific crude suicide rates per 100 000 population in Scotland for each single age from 15 to 49 years of age and each birth year from 1940 to 1998 stratified by sex. The colour and contour labels indicate the number of suicides per 100 000 for each single age and year. Thick dashed guidelines indicate birth cohorts 1960 (left most line), 1970 and 1980 (right most line) and thinner ones mid-decadal birth cohorts 1965 and 1975.
Changes for women have been less noticeable than among men (although the number of suicides are smaller), with the maximum rate declining and moving to younger ages, from 40–70 to 25–50 years by the 1990s, as the rates for older ages continued to fall. There is suggestion of a weak cohort effect for those born between 1960 and 1980.
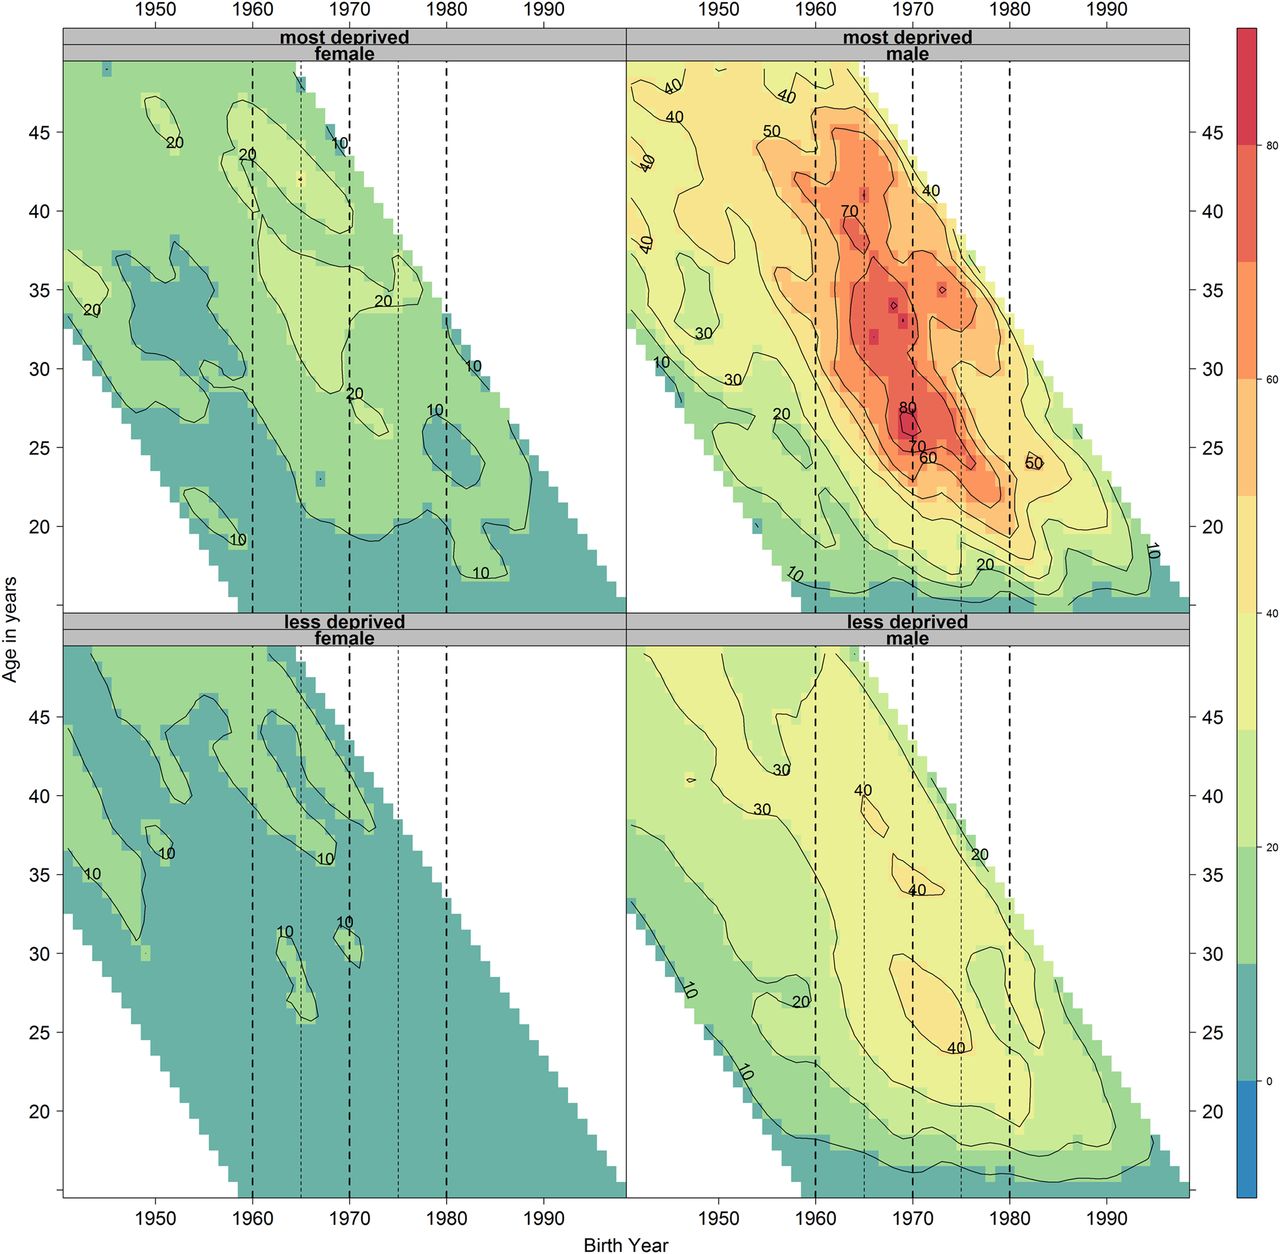
There are differences in age profiles for men and women by Carstairs deprivation and over time (see online supplementary figures S5 and S6). Age differences are again more noticeable for men, especially for those aged 20–60 years. The rise in rates for younger ages in the 1990s and the movement of this maximum rate to older ages with time, noted above, is very evident in the deprived group displaying a cohort effect for those born between 1960 and 1980 (figure 2), indicating that the cohort effect is substantially driven by men in the most deprived areas. It can similarly be proposed that the changes in women rates are also driven more by those in the deprived group. The timing of the peak of the cohort effect on suicide rates also differs by deprivation; the effect occurs to a greater extent in those born between 1965 and 1969 in the most deprived group (peak suicide rate of around 80/100 000, occurring in 26 year olds) and 5 years later in those born between 1970 and 1974 in the less deprived group (peak suicide rate of around 40/100 000, occurring in 26 year olds).

Smoothed shaded contour plot of age-year specific crude suicide rates per 100 000 population in Scotland for each single age from 15 to 49 years, and each birth year from 1940 to 1998 stratified by sex and deprivation (most deprived fifth and less deprived four-fifths). Thick dashed guidelines indicate birth cohorts 1960 (left most line), 1970 and 1980 (right most line) and thinner ones mid-decadal birth cohorts 1965 and 1975.
Birth cohort analysis
Analysis of suicide rates for birth cohorts as they age (see online supplementary figure S7) reflect the differences in age-specific suicide profiles for birth cohorts and also how these differ between the sexes. The peak age for suicide for both sexes has decreased from around middle age with successive cohorts. The rise in suicide at younger ages is marked for men, with maximum rates among young adults in the recent cohorts noticeably higher than those of older adults in older cohorts. In contrast, each subsequent birth cohort among women has a lower maximum suicide rate across the life course.
Figure 3 shows the major contribution of men in recent cohorts in the most deprived quintile to the substantial rise in suicide rates for younger men aged 20–24 years overall. Also apparent are the higher rates in women in recent cohorts in the most deprived quintile for ages 30–44 years.
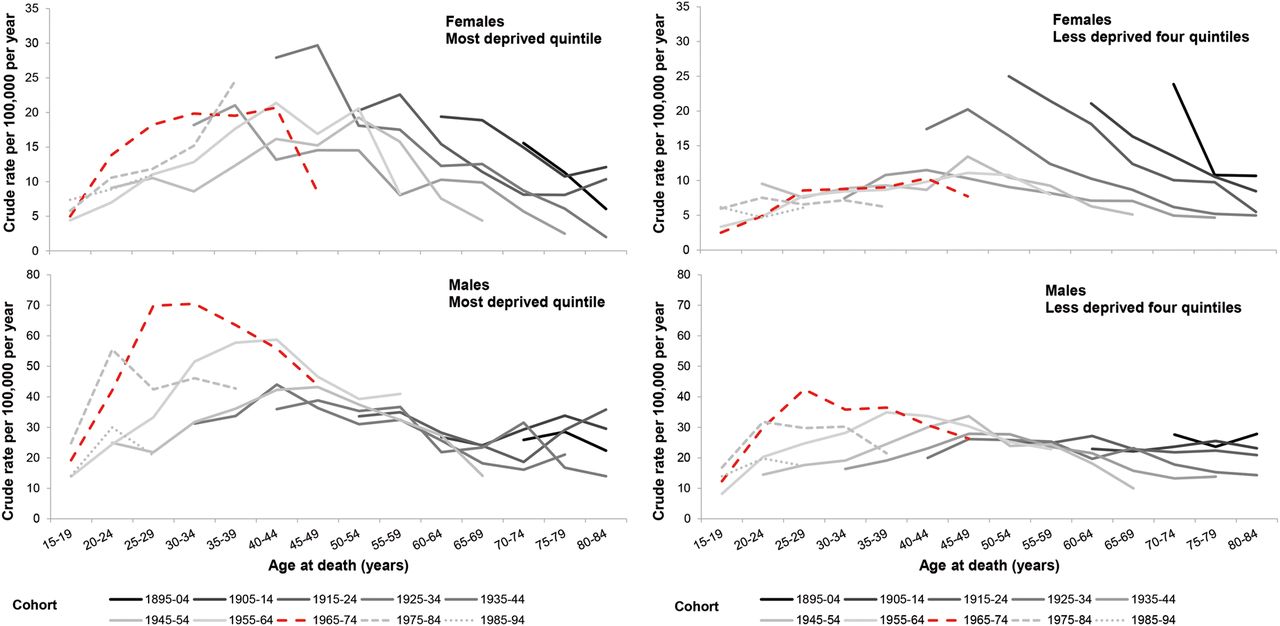
Crude suicide rate per 100 000 population per year in Scotland by age (5-year age groups, for ages 15–84 years), birth cohort (10-year cohorts 1895–1994), sex and deprivation. The 1965–1974 cohort identified from shaded contour plots as that most affected by a cohort effect is identified in red and large dashes.
IE analysis
Regression analysis confirmed that no single-factor or two-factor combination of age, period or cohort provided a better fit than the full APC model (see online supplementary appendix 2).
Supplementary appendix
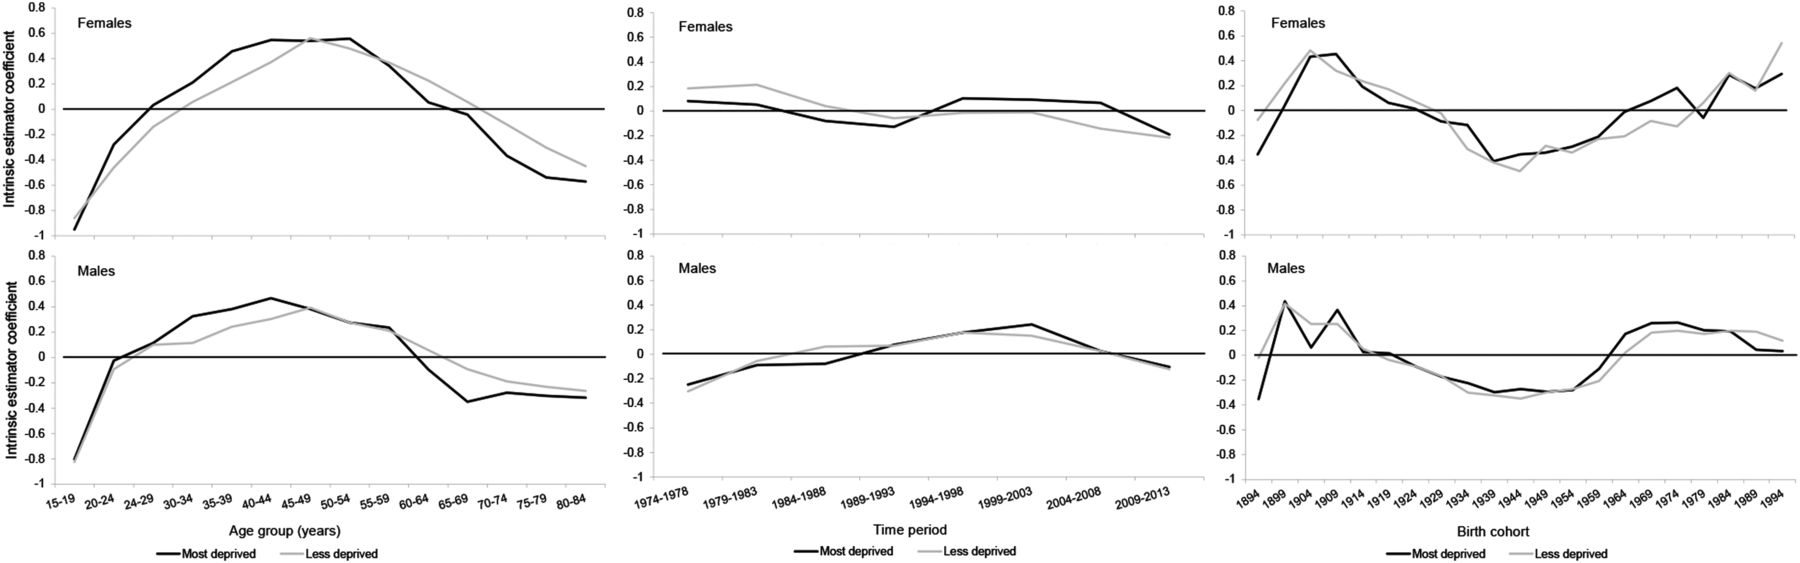
The IE coefficients (see online supplementary appendix 2 for an explanation of how to interpret IE coefficients) suggest (figure 4) (see online supplementary appendix 3 for the IE coefficient data with 95% CIs) that there is a strong age effect for both sexes, with a peak in middle age (younger among men and larger for women); a small period effect, again different for men and women, decreasing for women, but increasing for men to a peak in 1999–2003 before decreasing; and a U-shaped birth cohort effect for both sexes, with a low around the 1944 cohort. A larger cohort effect is observed for men than women in the successive birth cohorts 1959–1974 (see online supplementary figure S8A).

Intrinsic estimator coefficients for age, period and birth cohort effects for suicide in Scotland stratified by sex.
Supplementary appendix
Inclusion of deprivation (figure 5) (see online supplementary appendix 3 for the IE coefficient data with 95% CIs) showed overall similarities in the effect on the most deprived fifth and the rest of the population, although differences in the timing, and to a lesser extent magnitude, do exist. The age effect for instance, especially for women, tends to occur 5 years earlier for those in the most deprived population and the cohort effect since the 1960s (see online supplementary figure S8B) increased earlier in the most deprived population.
Intrinsic estimator coefficients for age, period and birth cohort effects for suicide in Scotland stratified by sex and deprivation.
Discussion
Main results
Between 1974 and 2013, the suicide rate in Scotland was consistently higher for men than women, with a decrease in the 1980s for women before stabilisation and an increase for men until around 2000 before subsequently declining. Since 1990, the peak age for suicide became noticeably lower for men due to a rise in rate among younger adults and a decline in older adults. This reflects a cohort effect for men (and possibly, to a lesser extent, women) starting around 1990 for those born between 1960 and 1980. The cohort effect is more prominent for those living in the most deprived quintile for both sexes, where it also starts earlier in the 1960s, indicating that the change in suicide rate by age in recent years is largely driven by those in more deprived areas. The IE analyses supported the descriptive findings. This finding is consistent with a cohort effect for young adults (and especially men living in deprived areas) entering the changing, and increasingly neoliberal, labour market during the 1980s as this group have a higher risk of suicide for the following 30 years than the cohorts born before and after.
Strengths and weaknesses of the analysis
Deaths from suicide can be difficult to record and count accurately as it relies on being able to ascertain the intent of the individual who has died. As a result, we have used the UK standard approach to count both deaths which have been judged to have been due to intentional self-harm and deaths with an undetermined intent (available from ICD 8 after 1968). The changes to the definitions of suicide over time are testament to the difficulties in recording these deaths accurately.27–30 Data are restricted to post-1974 when NRS introduced individual computer records containing sufficient details for our analyses.
The data we used provided us with the year that the death was registered rather than the year in which the death occurred (chosen to match the reporting convention of NRS). Suicide is at greater risk of delayed registration than many other causes of death in Scotland because of the requirement for a Procurator Fiscal report to be prepared. However, in Scotland, only a few percentage of suicides are registered after the calendar year in which the death occurred, so the potential for this to interfere with the conclusions is minor.31 As our analyses have sought to break down the crude mortality rates by age over time, the number of deaths in each group is small, and there is therefore a substantial degree of random variation which makes it more difficult to be clear what the APC effects are.
There are well-rehearsed difficulties in disentangling APC effects. Modelling APC effects simultaneously is problematic due to the three terms being mathematically dependent on one another, the ‘identification problem’. There is much debate about whether this is possible,32–35 and several solutions have been proposed, all of which have limitations.36 ,37 The most common solutions involve imposing a constraint on the model such as assuming that the age effects in the first two age groups are equal. This is problematic as the parameter estimates are sensitive to the constraints chosen and often the constraints are difficult to justify empirically.38 The IE is a newer approach to the statistical estimation of APC accounting models and is a special form of the principal components regression estimator, which assumes that the sum of the coefficients in the vector are zero, thus avoiding the need to select a (usually arbitrary) constraint. While it too has limitations,26 our findings align with those from the descriptive analyses, especially clear in the SCPs, so adding weight to the emerging thesis on the timing and possible reasons behind the trends in suicide in Scotland. The results do not directly test causal mechanisms but shed new light on the temporal trends and therefore represent an inductive exploration, rather than a deductive test, of the hypothesis.
Comparison with other studies
The trends in suicide over time and differences between men and women and between age groups have been previously described for Scotland.7 ,8 ,23 The substantially higher rates of suicide among those living in deprived circumstances is also well recognised,21 ,30 and the greater increase and polarisation of suicide among young adults in the most deprived parts of Scotland occurring between 1980–1982 and 1999–2001 has also been noted, although not identified as a cohort effect.39
Of those dying from suicide in Scotland, men are currently most likely to use a means of hanging/strangulation/suffocation and women self-poisoning as their chosen mode.30 Suicides by hanging have increased since the 1960s and markedly since 1990, mostly driven by men, and overtook those due to poisoning around the early 2000s, the rates for which has fallen since 1993.9 It is this change in method preference that is suggested as a possible cause for the increase in male suicide rates in the 1990s.23 Indeed, this has contributed to the divergence in suicide rates for men between Scotland and England and Wales.7 Trends in suicides due to hanging/strangulation/suffocation as a proportion of all suicides, however, do not indicate that this means of suicide is specific to the cohort effect identified and there is increasing gender parity in the use of that method over time (the gender analysis involved the creation of ratios from ratios based on small numbers; see online supplementary figures S9 and S10).
A substantial proportion of suicides, particularly those due to self-poisoning (the second most common mode among men), are likely to be influenced by alcohol,40 and it is notable that alcohol sales and a range of alcohol-related harms have started to decline in recent years.10 Scotland has also seen the introduction of restrictions in the availability of paracetamol (a common drug used for self-poisoning) through UK legislation,41 a trend away from the prescription of tricyclic antidepressants (another common drug used for self-poisoning) and the introduction of suicide barriers on sites known as suicide hotspots,42 all of which would be expected to exert downward pressure on suicide mortality rates.43 It could therefore be that the recent decline in suicide rates for men, and some of the earlier decline in women, can be attributed to good public health policy (and in particular the national suicide strategy44 and success in related areas of policy (alcohol).
Implications and conclusions
Although only a small percentage of deaths in Scotland each year are due to suicide (1.43% in 2013), suicides disproportionately affect young adults (thereby impacting substantially on life expectancy) and are likely to have profound negative impacts on children and other family members left behind.45 Suicides also represent an important contribution to the health inequalities and ‘excess’ mortality in Scotland.5
A motivation for this study was to investigate whether or not there is evidence of a cohort effect for those most likely to have been exposed to the negative consequences of deindustrialisation and neoliberalism during the 1980s. We have identified a cohort effect for suicide which appears for young men (and to a lesser extent for women) in the early 1990s that would seem consistent with this exposure and to have a lasting negative effect through to middle age. Exposure appears to have started earlier for those in the most deprived areas, this would be consistent with deleterious exposure to neoliberal change occurring primarily when young adults became job seekers; an earlier event for those in more deprived areas who tend to leave education and enter the changed labour market at an earlier age.46 Additionally, having undertaken less formal education, it is likely that they also tended to face worse labour market conditions than those from less deprived areas, consistent with their higher suicide rates, with the job market being more adversely affected for those doing ‘less skilled’ work, the sector of the labour market they would primarily enter.47 Further work is required to examine the other causes of death that are responsible for the higher mortality, excess mortality and health inequalities in Scotland for such cohort effects.
What is already known on this subject
Suicide is one of the causes of death partly responsible for ‘excess mortality’ in Scotland (ie, after accounting for deprivation).
Suicide, violence, alcohol-related and drug-related deaths, all increased in Scotland during the 1980s and 1990s (particularly for young adults), although some are now in decline.
It has been hypothesised that exposure to neoliberalism from the 1980s may be part of the explanation for the mortality phenomena in Scotland.
What this study adds
A cohort effect is evident for suicide for people born between 1960 and 1980, the cohort 1965–1974 being most affected.
This cohort effect was largely driven by men and those living in the most deprived areas, where the cohort at highest risk occurred earlier than for the rest of the population, 1965–1969 compared with 1970–1974.
The recent rise and subsequent fall in suicide in Scotland can be explained by a cohort effect that is consistent with exposure to neoliberal politics during the 1980s, which was experienced earlier and more profoundly by people living in more deprived areas.
Acknowledgments
The authors would like to thank Julie Ramsay and Frank Dixon at National Records of Scotland (NRS) for the data set and for advising on details of Scottish suicide statistics including how to identify suicide post-2010 which fitted the old coding requirements, and also David Readhead at the NHS National Services Scotland for assistance in providing data by deprivation groupings.
References
Footnotes
Contributors GM generated the initial idea for the study. Analyses of data were led by JP with JM, JL and JB provided statistical advice for the IE analyses. JP drafted the manuscript. All authors provided critical input into the redrafting of the manuscript and approved the final draft.
Funding JM is funded by the ESRC (Code: ES/K006460/1).
Provenance and peer review Not commissioned; externally peer reviewed.
Competing interests None declared.
Data sharing statement The authors have provided additional data in the appendices. The data used for this study are owned by the NRS and can be obtained by researchers from them on request.