Article Text

Abstract
Background That socioeconomic deprivation has shown a correlation with disease-specific mortality in Western societies is well documented. However, it is unclear whether these findings are also apparent in Asian societies. Accordingly, we conducted the first systematic review and meta-analysis of studies from Asia that have reported on the association between socioeconomic position and adult mortality risk.
Methods Relevant studies were identified through an electronic search of databases. Studies were included if they had published quantitative estimates of the association between socioeconomic status (SES) and mortality in a general population-based sample. The pooled multiple-adjusted relative risks for mortality in the lowest SES group relative to the highest SES group were studied. Random effects meta-analyses were computed.
Results A total of 29 cohort studies from 10 Asian countries were identified, comprising 1 370 023 individuals and 71 818 total deaths. The three markers of SES most widely used (education, income, occupation) were inversely related to mortality outcomes under consideration (all-causes, cardiovascular disease, cancer). For instance, the pooled relative risks of low education compared with high education were: 1.40 (95% CI 1.29 to 1.52) for all-cause mortality, 1.66 (1.23 to 2.25) for cardiovascular mortality and 1.16 (1.07 to 1.27) for cancer mortality. There was some evidence that the age of cohort members at study induction, the gross national product of the country from which the cohort was drawn and geographical region modified the association between SES and mortality.
Conclusions Concordant with findings from Western societies, socioeconomic disadvantage is associated with total and cause-specific mortality in Asia.
Statistics from Altmetric.com
Introduction
Socioeconomic inequalities in health are well documented; with the exception of very few outcomes, poorer health is more common in the disadvantaged.1 Reducing these differentials has become a priority for many governments, including the UK2 ,3 and USA,4 and for WHO.5 ,6 To date, most of the evidence for socioeconomic inequalities in health comes from western societies. By contrast, there is a paucity of data on the impact of socioeconomic status (SES) on adult mortality in Asia.
Using the 2010 U.S. Census Bureau definition of the Asian,7 we undertook a systematic review of observational cohorts examining the relation of SES with disease-specific mortality in Asia, including a meta-analysis of the aggregated evidence. To our knowledge, this is the first study of this kind using purely Asian data.
Methods
We conducted a systematic review of the literature following the Meta-Analysis Of Observational Studies in Epidemiology guidelines8 and the Preferred Reporting Items for Systematic reviews and Meta-Analysis statement.9 The primary focus of this systematic review was the association between socioeconomic factors and adult mortality in Asian populations.
Definition of Asian
‘Asian’ refers to a person having origins in any of the original peoples of the Far East, South-East Asia or the Indian subcontinent.7
Search strategy
We used a four-stage approach for identifying pertinent publications. First, we performed an electronic search of a wide range of databases from January 1966 to 31 May 2013: Pubmed, Embase, CINAHL, Social Science Research Network and the Cochrane library. The following search terms were used: (social class [MeSH] or socioeconomic factors [MeSH] or education [MeSH] or income [MeSH] or occupation [MeSH]) and mortality [MeSH] and cohort [all field] and Asia [all field], and by country. There was no language restriction. To ascertain relevance, we read the titles and abstracts of all of the articles identified. The full texts of the articles selected were read to determine if they met our criteria for inclusion. Second, we scrutinised the reference lists of the identified articles for further publications, including other publications from the same study. Third, we searched our own files. Finally, we contacted some experts in the field to ascertain if they could add to our list of retrieved publications.
Data extraction
Articles were considered to be relevant if they reported findings from prospective Asian cohort studies that included estimates of relative risks (RRs) (including HRs and rate ratios) for all-cause, cardiovascular disease (CVD) or cancer mortality in a general population according to different levels of SES. SES measures accepted were education, income (including economic hardship, household economic status and dimensions of the subject's dwelling) and occupation (limited to manual vs non-manual and blue vs white collar occupation). Articles were excluded if they were performed in hospital patients or based outside Asia. Articles were also excluded if they gave the RR without an associated metric of uncertainty, such as a 95% CI. In the case of multiple publications from the same or overlapping cohorts, we selected the article with the largest number of person-years of follow-up. If two studies tied in this regard we took the article with the most exhaustive level of adjustment for potential confounders.
In the event that a study only presented RRs for a mortality outcome that was not our primary interest (eg, communicable disease or injury), reported RRs from coronary heart disease and all stroke, instead of total CVD, or reported cancer mortality, as avoidable, partly avoidable and non-avoidable, separately, we selected the suboutcome based on its highest quantitative contribution to the total, composite outcome.
Statistical analysis
The primary aim was to estimate pooled multiple-adjusted (taking the maximum adjustment set) RRs for mortality in the lowest SES group relative to the highest SES group studied. We used a random effects model (ie, allowing the true value from each study to vary) with inverse variance weighting. Our analyses were subdivided by pairing SES measures and mortality as: education–all-cause mortality, education–CVD, education–cancer; income–all-cause mortality, income–CVD, income–cancer; and occupation–all-cause mortality, occupation–CVD, occupation–cancer. Where sufficient data were available to give reliable results, additional analyses were conducted within subgroups. Subgroups analysed were mean age of study population (<65 vs ≥65 years), World Development Indicators10 (high- vs middle- and low-income countries), the Gini index of income inequality11 (0.2–0.29, 0.3–0.39, ≥0.4), geographical regions (East Asia vs South Asia vs South-East Asia), years of recruitment (before 1995 vs after 1995) and urbanicity (whether the majority of the study population lived in urban or rural areas). The Gini index is a number between 0 and 1, where 0 corresponds with perfect equality (where everyone has the same income) and 1 corresponds with perfect inequality (where one person has all the income—and everyone else has zero income). A priori, we excluded studies based only in the most elderly (75 years and over) when analysing the Gini index. Furthermore, to address the cohort effect,12 meta-regression was performed for the effects of year and duration of study on the associations between education–all-cause mortality and income–all-cause mortality.
Statistical heterogeneity within studies was assessed using Cochran's Q test for heterogeneity and Higgins's I2 statistic.13 I2 is interpreted as the percentage of variability between studies due to heterogeneity, rather than chance. We undertook several additional sensitivity analyses to assess the robustness of our results and to explore potential sources of heterogeneity by (i) repeating the primary analysis after excluding studies that did not give total, composite outcomes, as described above; (ii) further excluding unadjusted and solely age–sex-adjusted estimates; (iii) further removing large cohort studies that might dominate the overall effects; (iv) analysing only studies that primarily focused on SES; and (v) comparing results from studies that split SES into only two groups and studies which used more than two groups, where we had compared the lowest with the highest groups.
We tested for publication bias by inspecting funnel plots and performing Begg and Mazumdar rank correlation tests14 for each of the outcomes. Subgroup RRs from the same study were pooled before plotting onto funnel plots. A non-parametric ‘trim and fill’ method was performed if there was any asymmetry in a funnel plot.15 These meta-analyses were carried out using Stata, V.11.
Results
Study characteristics
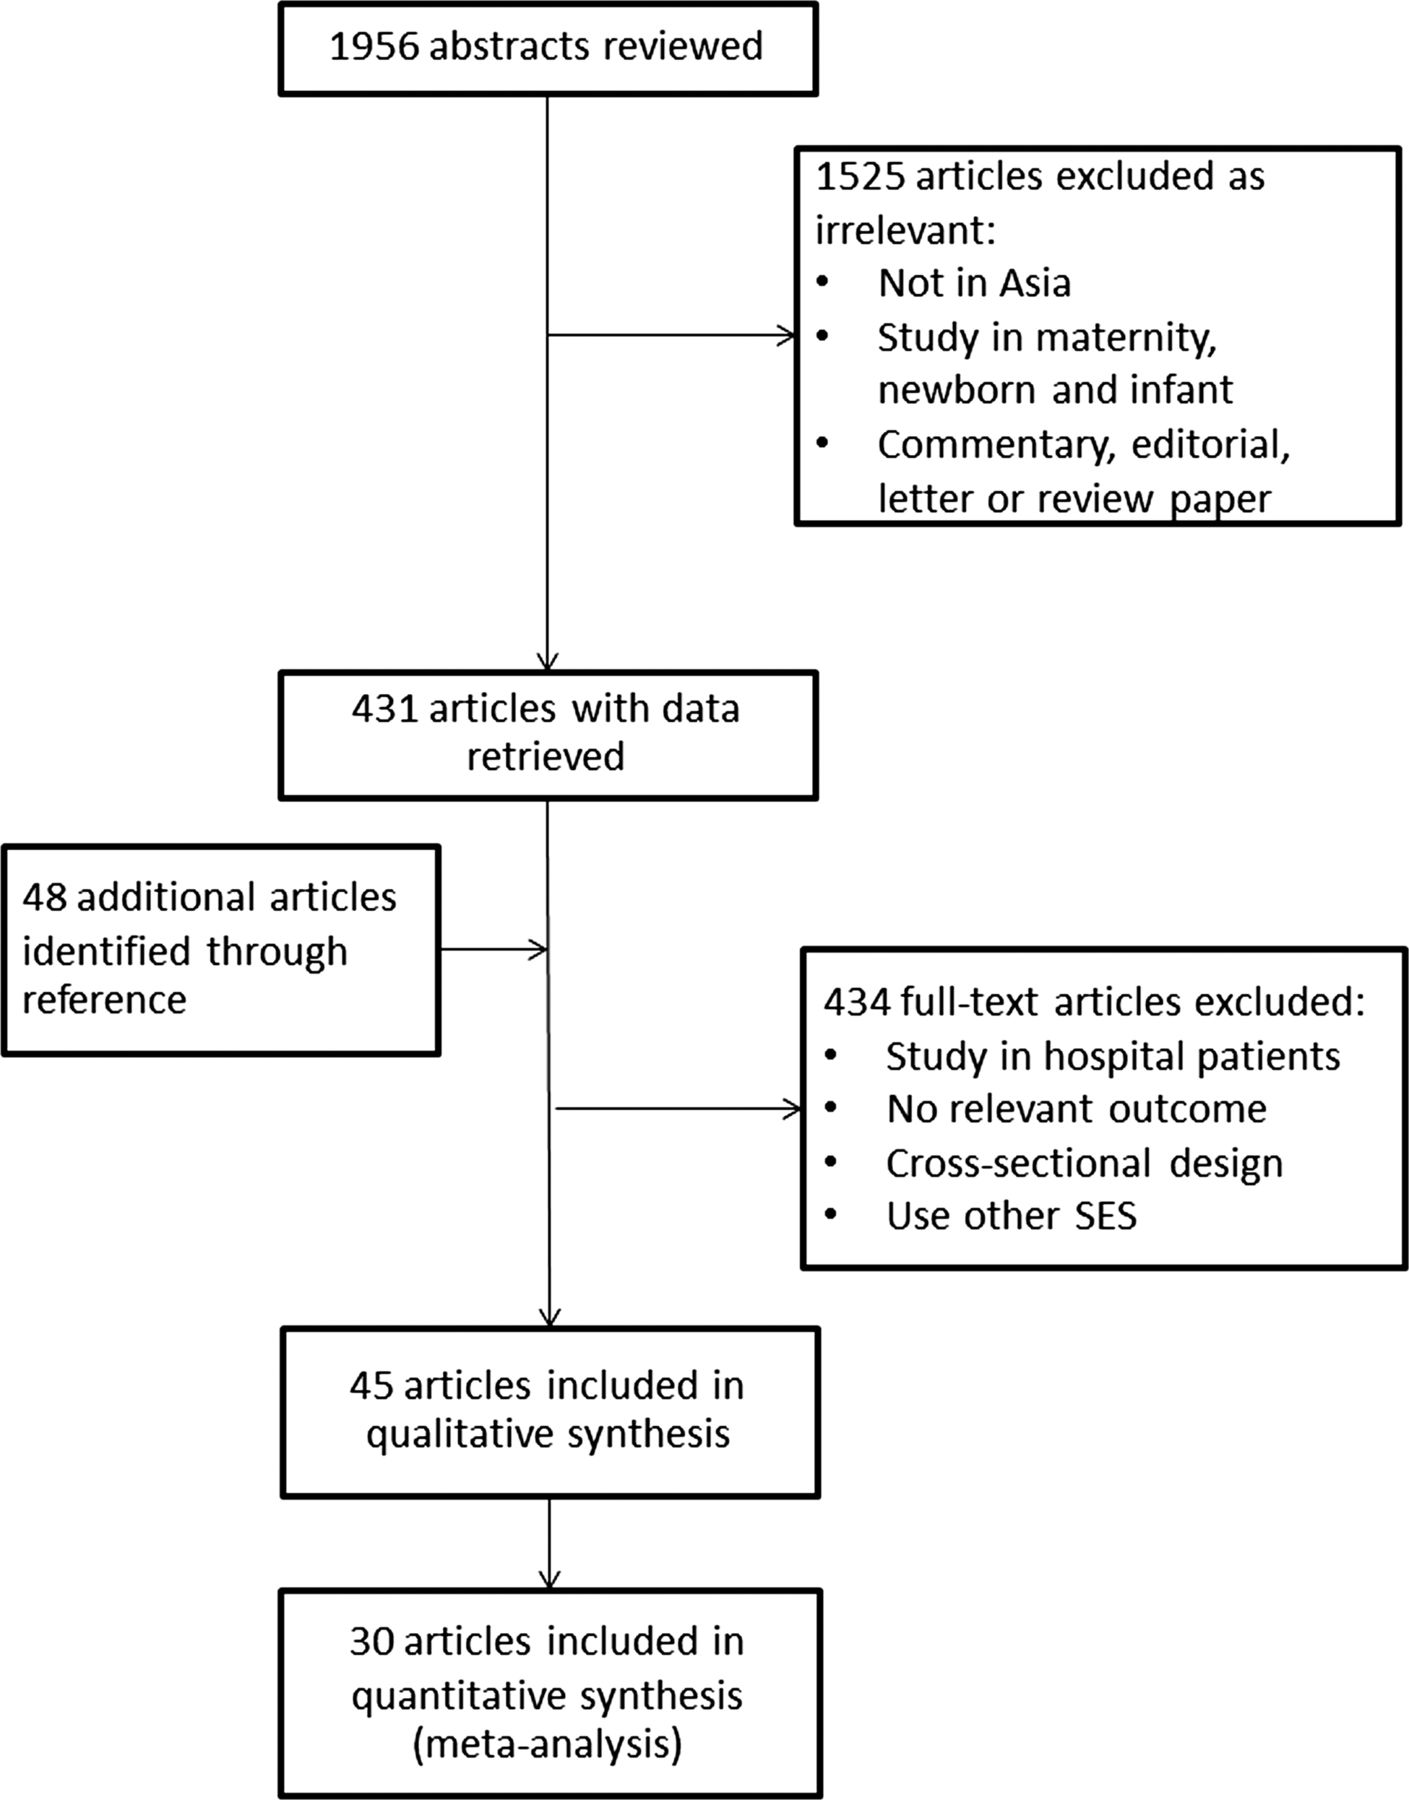
We identified 1956 article citations for screening of titles, abstracts and keywords (figure 1). From these, we retrieved 431 full articles for further consideration. We further identified 48 articles from reference lists. Overall, we identified 45 relevant publications based on 29 different cohort studies16–60 from which to extract data (see online supplementary table S1). Geographically, 20 cohorts were from East Asia, six were from South Asia and three cohorts were from South-East Asia (see online supplementary appendix 1). Demographic data of countries included in the analysis were provided in online supplementary appendix 2. Of the 45 publications, 29 aimed primarily to study the association between SES and mortality; the rest focused on other topics but still provided data on SES. Results were available from some of the 29 cohorts on more than one of the three SES measures of interest.

Selection of publications.
Three studies only provided results from a subset outcome rather than one of our three mortality outcomes of interest. These were studies from Vietnam58 (where we used their results on non-communicable diseases (NCDs) to represent total mortality when NCDs actually only accounted for 64% of all-cause mortality), Japan39 (where we used stroke to represent all CVD mortality—66% coverage) and Korea47 (where we used ‘avoidable’ cancers to represent all cancer mortality—76% coverage). Finally, data for 1 370 023 individuals were available for the primary analysis for all-cause mortality, 851 961 for CVD mortality and 884 474 for cancer mortality. There were 71 818 total deaths (5%), 10 790 CVD deaths (1.3%) and 7859 cancer death (0.9%). Mean duration of follow-up varied from 1 to 22 years.
Pooled estimates of association
Most studies demonstrated a significantly elevated risk of premature mortality in the lowest SES group relative to the highest (figure 2). The RRs for the association between low education and mortality varied from 0.99 to 4.62 across studies. Overall, those who had the lowest level of education experienced a 40% increased risk of total mortality compared with the highest level (95% CI 29% to 52%); the corresponding result for income was almost identical: 41% (24% to 61%). Being a manual or blue collar worker marginally increased risk of all-cause mortality compared with a non-manual or white collar worker, RR 1.14 (1.01 to 1.30), p value=0.04.
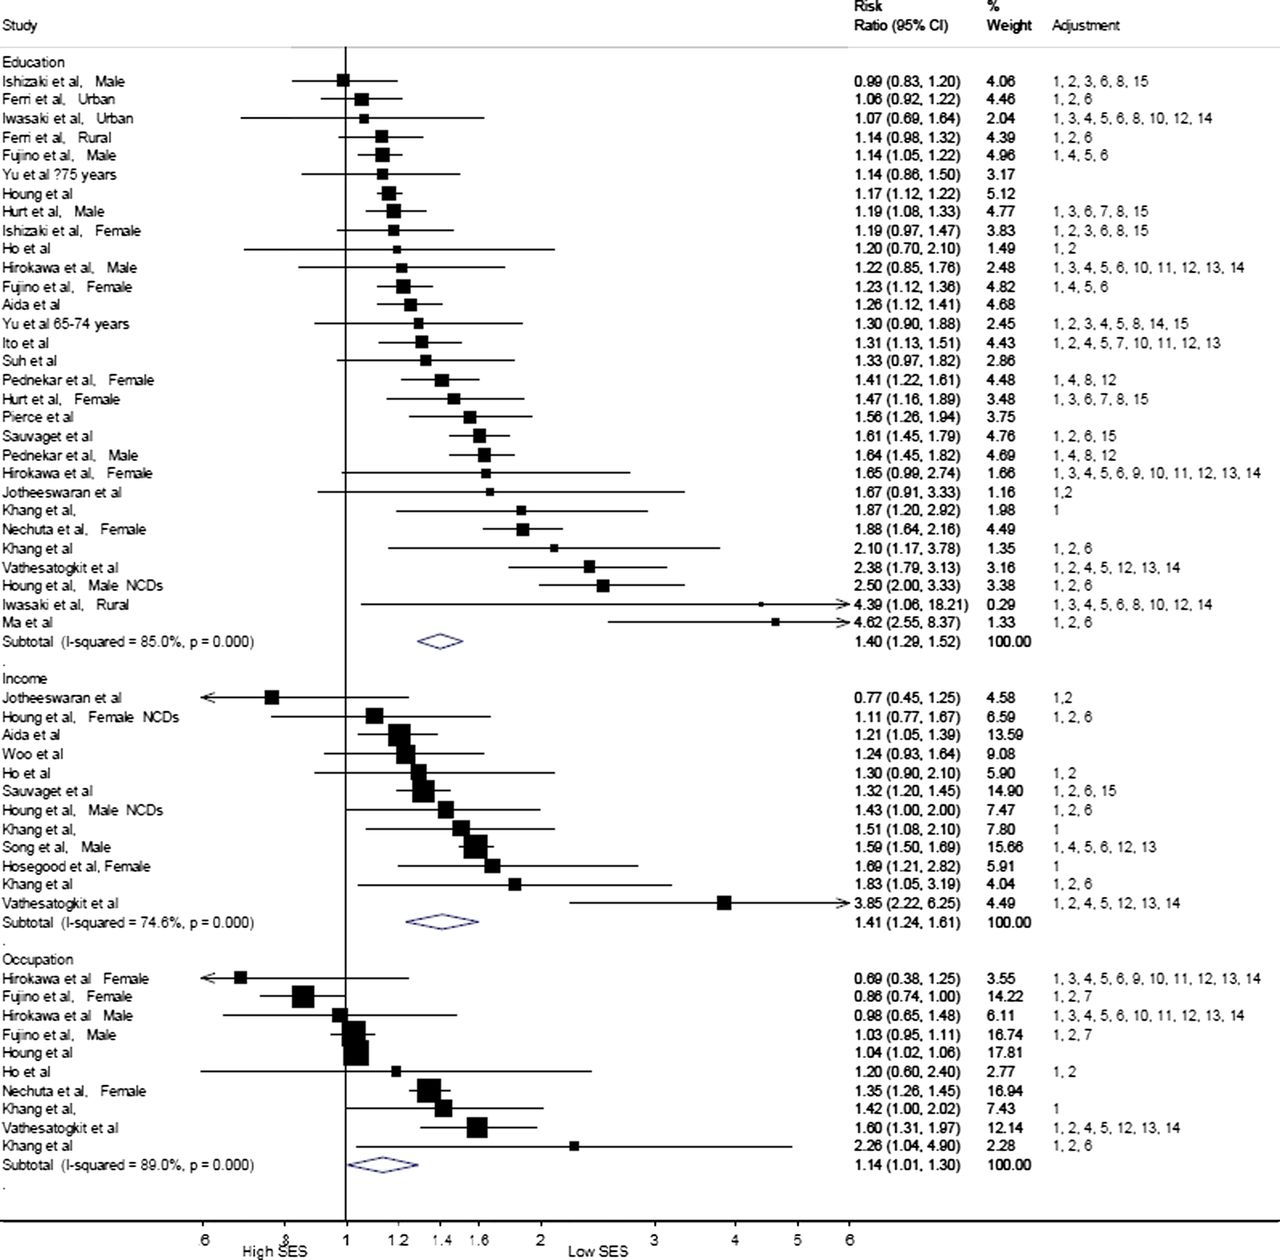
Pooled relative risks and 95% CIs for all-cause mortality in those who had lower SES with higher SES serving as the reference (stratified by SES measure). SES, socioeconomic status; NCDs, non-communicable diseases; Adjustments: 1, age; 2, sex; 3, marital status; 4, smoking; 5, alcohol; 6, SES (ethnicity/education/wealth/income/financial capability index/household economic status/household size/household assets/type of home/number of household residents/occupation/job status/job type); 7, geographic (public health centre area/area of residence); 8, social network and support (number of meeting close relatives/having reliable friends/participation in activities/going to any religious services/enjoying good fellowship with neighbours/religion/mother tongue); 9, menopausal status; 10, physical activity (exercise/frequency of sports); 11, nutritious information (vegetable tendency/western meal tendency/energy intake/fruit intake/vegetable intake); 12, body anthropometry (BMI/height); 13, screening tests (SBP/cholesterol/glucose); 14, chronic diseases (including HTN/DM/physical/mental health); 15, others (CES-D/randomisation group/hearing impairment/doctor's visit).
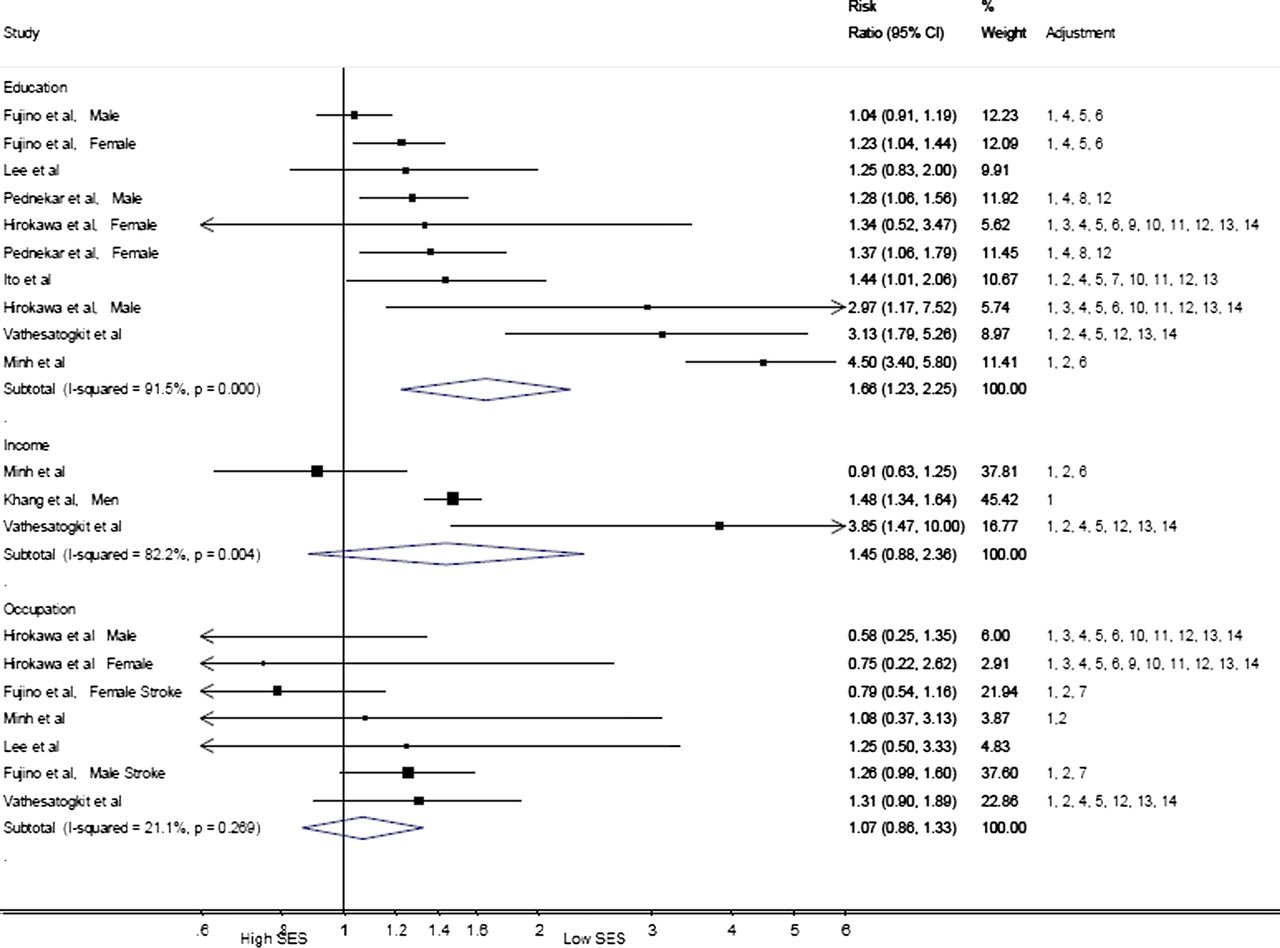
Level of education was associated with both CVD (figure 3) and cancer (figure 4) mortality. Pooled RRs comparing the extremes were 1.66 (1.23 to 2.25) and 1.16 (1.07 to 1.27) (both p value <0.001, respectively). Level of income was associated with an increased risk of cancer mortality (RR comparing the extremes 1.35 (1.08 to 1.68), p value <0.001) but not CVD mortality (RR 1.45 (0.88 to 2.36)). Occupation had no effect on either CVD or cancer mortality: the pooled RRs were 1.07 (0.86 to 1.33) and 0.99 (0.83 to 1.17), respectively. There was a high degree of heterogeneity (I2 statistics ranging from 74% to 92%) in the estimates between studies for all-cause and CVD mortality and, except when studying associations with occupation, for CVD mortality. There was no important heterogeneity when cancer mortality was the endpoint of interest.

Pooled relative risks and 95% CIs for CVD mortality in those who had lower SES with higher SES serving as the reference (stratified by SES measure). SES, socioeconomic status; NCDs, non-communicable diseases; Adjustments: 1, age; 2, sex; 3, marital status; 4, smoking; 5, alcohol; 6, SES (ethnicity/education/wealth/income/financial capability index/household economic status/household size/household assets/type of home/number of household residents/occupation/job status/job type); 7, geographic (public health centre area/area of residence); 8, social network and support (number of meeting close relatives/having reliable friends/participation in activities/going to any religious services/enjoying good fellowship with neighbours/religion/mother tongue); 9, menopausal status; 10, physical activity (exercise/frequency of sports); 11, nutritious information (vegetable tendency/western meal tendency/energy intake/fruit intake/vegetable intake); 12, body anthropometry (BMI/height); 13, screening tests (SBP/cholesterol/glucose); 14, chronic diseases (including HTN/DM/physical/mental health); 15, others (CES-D/randomisation group/hearing impairment/doctor's visit).

Pooled relative risks and 95% CIs for cancer mortality in those who had lower SES with higher SES serving as the reference (stratified by SES measure). SES, socioeconomic status; NCDs, non-communicable diseases; Adjustments: 1, age; 2, sex; 3, marital status; 4, smoking; 5, alcohol; 6, SES (ethnicity/education/wealth/income/financial capability index/household economic status/household size/household assets/type of home/number of household residents/occupation/job status/job type); 7, geographic (public health centre area/area of residence); 8, social network and support (number of meeting close relatives/having reliable friends/participation in activities/going to any religious services/enjoying good fellowship with neighbours/religion/mother tongue); 9, menopausal status; 10, physical activity (exercise/frequency of sports); 11, nutritious information (vegetable tendency/western meal tendency/energy intake/fruit intake/vegetable intake); 12, body anthropometry (BMI/height); 13, screening tests (SBP/cholesterol/glucose); 14, chronic diseases (including HTN/DM/physical/mental health); 15, others (CES-D/randomisation group/hearing impairment/doctor's visit).
Additional analyses
Six additional subgroup analyses according to study characteristics are provided in table 1. The impact of low education on mortality was modified by the mean age of the studied population. Studies in older adults gave a lower pooled estimate (RR 1.16; 1.13 to 1.20) than studies in the younger age group (RR 1.62; 1.44 to 1.81), p value for difference <0.0001. The mortality risk of having a more basic education was stronger in the middle- and low-income countries compared with high-income countries, p value <0.01. Studies in countries with a Gini index ≥0.4 found a higher pooled estimate (RR 1.76; 1.24 to 2.52) compared with studies in countries with a Gini index <0.3 (RR 1.23; 1.16 to 1.30). Comparing study regions, the effects of education on mortality were highest in South-East Asia (RR 2.72; 2.05 to 3.59), followed by South Asia (RR 1.47; 1.31 to 1.65) and East Asia (RR 1.25; 1.16 to 1.35), p value <0.001. Year of study and whether studies were based in urban or rural population did not modify the effect of education on mortality but the Gini index did (see online supplementary appendices 3 and 4). Differences by age were also apparent in studies that related income to the risk of all-cause mortality, such that an association of lower magnitude was seen in older groups (1.17; 0.96 to 1.44) in comparison with the younger (1.50; 1.30 to 1.74) (p value for difference <0.01). Study regions, urbanicity and country's income levels did not affect the association between income and mortality. However, studies conducted before 1995 showed a higher impact of income on mortality (RR 1.66; 1.28 to 2.15) than studies conducted since 1995 (RR 1.28; 1.14 to 1.44), p value <0.01. In meta-regression, neither year nor duration of study modified the relationship between education and mortality.
Pooled relative risks for education and income in relation to all-cause mortality according to study or country characteristics
Sensitivity analyses
The association of education and income with all-cause mortality remained statistically significant at conventional levels after removing those studies which only reported unadjusted and age–sex-adjusted estimates and estimates from the study58 where we used deaths due to NCDs to substitute for total mortality: RR; 95% CI 1.36; 1.24 to 1.50 for education and 1.55; 1.30 to 1.86 for income. Omission of three large studies from Korea47 and India31 ,33 had little effect on the estimates for all-cause mortality (RR; 95% CI 1.37; 1.27 to 1.49 for education and 1.42; 1.17 to 1.72 for income). Analyses restricted to studies that focused on SES also gave a broadly similar set of results: the pooled RR for education and all-cause mortality was 1.38 (1.26 to 1.50), and for income and all-cause mortality was 1.44 (1.23 to 1.68). Only the association between occupation and all-cause mortality became non-significant in this context (1.09 (0.97 to 1.23), p value 0.14). In every other instance, similar RRs and their significances were observed. Analyses of studies that used binary data for education and income gave smaller RRs for the relationship with all-cause mortality (1.20 (1.12 to 1.37) and 1.28 (1.15 to 1.43), respectively, p value <0.0001) compared with studies that compared the lowest and highest SES groups (1.59 (1.41 to 1.81) and 1.49 (1.22 to 1.81) for education and income, respectively, p value <0.0001). Overall, none of these analyses removed the heterogeneity observed previously.
Publication bias
Begg's rank correlation test indicated no evidence of publication bias among each pair of SES measure and mortality outcome (p value >0.05). However, visual inspection of funnel plots (see online supplementary appendices 5–7) showed some asymmetry among studies between education and all-cause mortality. However, the non-parametric ‘trim and fill’ method for studies examining the relationship between education and all-cause mortality gave a pooled estimate of 1.28 (1.17 to 1.41, p value <0.0001).
Discussion
Although there are reasons to anticipate that the findings of research on SES and adult mortality in high-income settings may not necessarily be generalisable to other contexts, our meta-analysis of 30 associations from 29 prospective Asian cohorts provides evidence that the impact of low SES, in terms of education and income, on mortality can also be seen across Asia. However, within this general result, there was a suggestion that the effects of SES are strongest in South-East Asia and weakest in East Asia.
Comparison with other studies
Our finding of a strong inverse relationship between education and mortality accords with cohorts drawn from Western countries.61–70 High educational attainment improves health directly, but also indirectly through work, economic conditions, social-psychological resources and health behaviour. The similarity of direction of the problem of low education found in Asian population and the Westerners should suggest these effects of education on health as universal. The magnitude of the impact of education on mortality found in our study is slightly larger than the findings from three studies conducted in western European countries 61 ,62 ,71 and two large American cohorts,63 but smaller than the effect size found in four eastern European countries.64 The size of these associations seems to vary across regions, depending on socioeconomic backgrounds. For instance, the impact of education on mortality appears to be lower in western European compared with eastern European populations, northern European compared with southern European populations and less in American whites compared with African Americans.61 ,62 ,64–69 ,71
It has been proposed that the level of economic inequality within a given population is a key determinant of magnitude of impact of SES on health.70 ,72–75 This is not surprising as a higher disparity will lead to a greater contrast between the lowest and highest groups of social status. Previous results from Europe,11 ,67 ,74 Latin America75 and the USA70 ,76 support this hypothesis. Our finding that the largest RRs for education occur within South-East Asia, and the lower RRs in South Asia and East Asia, respectively, also supports this hypothesis. This is because South-East Asian countries collectively have the highest disparity in income, as measured by the Gini index of income inequality,11 among the three subregions studied. The recent rapid modernisation in South-East Asia may be a factor in increasing social disparity. For example, Singapore's Gini index is the second largest among all developed economies11 and the substantial health disparity there has been commented upon.53 ,77
We observed a reduced effect of education on mortality in the elderly. In general, western studies show that socioeconomic gradients in mortality persist in the elderly, but smaller on a relative scale when compared with younger populations.78 Education is determined early in adulthood and may not any more accurately describe the socioeconomic position of ageing people, where unmeasured community influences turn out to be highly important, particularly in the Asian society. Poor health behaviours observed in low education79–84 could also be another explanation in that premature deaths in the young are more prevalent in low- and middle-income countries than high-income countries.85
The association between income and mortality observed in this meta-analysis shows a mixed pattern. Low income is related to all-cause and cancer mortality, but not CVD mortality. Western literature has shown a positive association between income and longevity. In Asia, the average income as measured by gross domestic product (GDP) per capita in the year 2000 is diverse, ranging from USD 347 in Bangladesh to USD 33 657 in Japan. It has been argued that it is an individual's relative, rather than absolute, income that is important for health, with a low relative income being a health hazard.86 ,87 A study in the USA found that the association between income and mortality is non-linear and the income–mortality gradient exists mainly at lower income levels.88 Similar to education, our analysis on income shows that the ranking of effects of income on mortality does not follow the country's GDP, as classified as high- or middle- to low-income countries, so much as the country's Gini index. Income is a crucial determinant factor for the affordability of treatment in fast growing Asian countries, where money is the key to access modern medicine. An example for the importance of affordability is a connection between income and mortality from chronic diseases, such as cancer and kidney disease. Similar differential effects with age were found for income as for education.
The effect size of occupation on mortality, however, is weaker than education and income, and only reaches statistical significance for all-cause mortality. Historically, occupation has been a common measure in studies of social class inequalities in Europe. Much of the comparative research on all-cause and cause-specific mortality, comparing between manual and non-manual occupations, found that mortality is lower in high status occupations.89–91 Although there have been several classifications of occupation available, our study is limited to manual versus non-manual occupation and white collar versus blue collar, because these were the measures most often provided. It is quite unclear what occupational rank should be used in non-industrialised countries, where a higher proportion of the population works in the agricultural sector or is self-employed. This, perhaps, explains the lack of association for occupation found in this review.
Strengths and limitations
One of the strengths of this study is that we use only prospective data. This provides more reliable effects of SES on mortality and avoids the weaknesses of a cross-sectional design, including the migration effect that is frequently found in an early phase of epidemiological transition. The use of random effects methodology also provides more robust results than a fixed effect model, and may be justified, post hoc, by the high degree of heterogeneity observed in this meta-analysis. The various sensitivity analyses that showed broadly similar results, also suggested that our results are robust. Nevertheless, this study has several limitations. First, comparisons between SES classes are not uniform in both the number of levels of SES and the definition of SES. Half of the studies give binary data of SES, while the others use more than two levels of SES. As expected, given that it provides a more extreme comparison, the latter gave the larger estimate of the effect of SES on mortality. Second, most of the studies have already made an adjustment for SES. This might lessen the stand-alone effect of SES; however, this proves an independent effect of SES on mortality. Third, we observe a publication bias in studies on education and all-cause mortality. However, our test for publication bias by ‘trim and fill’ method gives a similar significant association. Fourth, education, income and occupation are only three of many SES measures used in studies from Asia. A selection of an appropriate SES for a society is a fundamental part for a cause-effect study, especially in Asian countries that have different social backgrounds such as the caste system in India. However, these three measurements are the core of SES and have been used in common in several studies in Asia. Fifth, some major countries are missing from this analysis, such as Indonesia, the world's fourth most populous country, and several South-East Asian countries. We noticed from our search that there are ongoing researches in these countries but results are not available yet. Last, only six cohort studies used nationally representative samples; the rest selected samples from specific areas (towns, cities or a workforce). Our study might not represent all Asian population but this is the most aggregated evidence that we have at the present.
Mechanisms
Explanations for how socioeconomic disadvantage might lead to CVD and other chronic diseases include access to resources (eg, education and income), environmental exposures (eg, housing conditions) and, most obviously, health-related behaviours (eg, tobacco smoking, physical activity and diet) and their physiological correlates (eg, obesity and raised levels of blood pressure and high cholesterol).6 ,92 ,93 That controlling for preventable behavioural and physiological risk factors attenuates but fails to eliminate socioeconomic gradients in health, particularly CVD,94 ,95 raises the possibility that as yet unmeasured psychological factors need to be considered (such as cognition, stress or personality type).96–100
Conclusions
In conclusion, socioeconomic inequality, as measured by education and income, has a negative impact on adult mortality in Asian population. The effect sizes lay between the impacts found in western European countries and eastern European countries. A higher disparity was observed in South-East Asia where there was a surge in modernisation during 1990s. Our result should strengthen the knowledge and understanding of the effect of SES on mortality in this part of the world.
What is already known on this subject
-
Most of the evidence for socioeconomic inequalities in health comes from western societies; by contrast, there is a paucity of data on the impact of socioeconomic status on adult mortality in Asia.
What this study adds
-
Socioeconomic inequality has a negative impact on adult mortality in Asian population.
-
The ranking of effects of income and education on mortality does not follow the country's gross national product so much as the country's inequality index.
-
The classic occupational rank might have a limited role in determining health outcomes in non-industrialised, agricultural societies.
References
Supplementary materials
Supplementary Data
This web only file has been produced by the BMJ Publishing Group from an electronic file supplied by the author(s) and has not been edited for content.
Files in this Data Supplement:
- Data supplement 1 - Online supplement
- Data supplement 2 - Online table 1
Footnotes
-
Contributors PV took part in the literature search, data analyses and interpretation of data, wrote the manuscript and drafted the tables and figures. GDB did the literature search and critically revised the manuscript for important intellectual content. MW supervised PV did the statistical analyses and critically revised the manuscript, tables and figures. All authors read and approved the submitted version of the manuscript.
-
Funding Mahidol University, Bangkok, Thailand.
-
Competing interests PV receives a PhD scholarship grant from Mahidol University, Bangkok, Thailand. GDB was a Wellcome Trust Fellow during the preparation of this manuscript. MW has a research fellowship from the National Health and Medical Research Council of Australia.
-
Provenance and peer review Not commissioned; externally peer reviewed.