Article Text

Abstract
Background Studies evaluating the impact of the neighbourhood food environment on obesity have summarised the density or proximity of individual food outlets. Though informative, there is a need to consider the role of the entire food environment; however, few measures of whole system attributes have been developed. New variables measuring the food environment were derived and used to study the association with body mass index (BMI).
Methods Individual data on BMI and sociodemographic characteristics were collected from 48 482 respondents of the 2002–2006 community health survey in New York City and linked to residential zip code-level characteristics. The food environment of each zip code was described in terms of the diversity of outlets (number of types of outlets present in a zip code), the density of outlets (outlets/km2) and the proportion of outlets classified as BMI-unhealthy (eg, fast food, bodegas).
Results Results of the cross-sectional, multilevel analyses revealed an inverse association between BMI and food outlet density (−0.32 BMI units across the IQR, 95% CI −0.45 to −0.20), a positive association between BMI and the proportion of BMI-unhealthy food outlets (0.26 BMI units per IQR, 95% CI 0.09 to 0.43) and no association with outlet diversity. The association between BMI and the proportion of BMI-unhealthy food outlets was stronger in lower (<median for % poverty) poverty zip codes than in high-poverty zip codes.
Conclusions These results support a more nuanced assessment of the impact of the food environment and its association with obesity.
Statistics from Altmetric.com
Introduction
Despite some evidence to suggest a slight decline in obesity prevalence among certain age groups, obesity continues to be a serious public-health concern.1 ,2 Until now, many prevention efforts have focused on increasing physical activity and improving access to healthy food.3–7 The latter attempt remains a challenge as researchers and policymakers emphasise the need to understand how the neighbourhood food environment influences a person's access to and consumption of healthy food.
Most efforts to evaluate the neighbourhood food environment and its association with obesity have summarised the density or proximity of individual types of stores, such as supermarkets, convenience stores, grocery stores and fast food restaurants. Evidence suggests an inverse association of obesity and the presence of supermarkets.8–11 In contrast, a positive association of obesity with convenience stores or smaller grocery stores was observed.8 ,9 ,12–14 There is less evidence of an association between proximity to fast food establishments and the risk of obesity and type of diet.12 ,14–18
The inconsistency of findings in the association between access to retail food establishments and obesity may result from methodological differences between studies, particularly from differences in food environment measures. Restricting analyses to a single type of food outlet prevents assessment of the broader food environment and all the available choices to residents. An individual's decision to frequent a supermarket or convenience store may be determined not only by personal choice but by the availability (density) and diversity of all food stores in the neighbourhood. Rundle et al19 conducted initial work in this area by categorising food establishments into healthy, unhealthy and intermediate with respect to body mass index (BMI) and observed an inverse association between BMI and the density of BMI-healthy outlets. They did not consider the potential diversity of healthy (or unhealthy) food stores that consumers face when making decisions to purchase food in their neighbourhood. Recently, studies conducted in Australia used a similar healthy and unhealthy food store classification scheme to predict fruit and vegetable and fast food purchasing and observed evidence suggesting that a greater proportion of health food options in a neighbourhood influences healthy and unhealthy food purchasing.20 ,21 Given the evidence that choice influences consumer behaviour, studying both the diversity and density of options will inform research on the food environment's influence on obesity.22 ,23
The purpose of this study was to evaluate the association between individuals’ BMI and the food environments of their neighbourhoods. We used previously developed food environment measures that reflect the expected health benefits of food outlets (BMI-healthy, BMI-unhealthy and BMI-intermediate) and developed new measures to reflect the density of retail outlets and the diversity of available retail food outlets. As previous work found that neighbourhood poverty modifies the association between built environment characteristics and obesity risk, the analyses were stratified by neighbourhood poverty status.24
Methods
Data
The data for these analyses come from the New York City (NYC) Community Health Survey (CHS), a random-digit dial telephone survey conducted annually by the NYC Department of Health and Mental Hygiene (DOHMH).25 This cross-sectional survey samples non-institutionalised adults aged 18 years and older to monitor a range of health topics. For this analysis, self-reported zip codes among CHS participants from five consecutive years of data (2002–2006) were linked with geospatial data describing the sociodemographic and built environment features of the zip codes. Self-reported height and weight were recorded each year of the survey and converted to BMI. A description of the sampling design used for CHS has been reported elsewhere.26
Outcome
The outcome of interest is BMI, which is a measure commonly used by CDC to classify adult weight. BMI was calculated by weight in pounds divided by height in inches squared multiplied by a factor of 703 (to convert pound/in2 to kg/m2). With few guidelines established that provide specific criteria for valid, biologically plausible BMI values, a two-step process, based on a previous analysis of anthropometric data by the DOHMH using observed plausible ranges of gender-specific height and weight and BMI from the 1999 to 2006 National Health and Nutrition Examination Survey, was used to eliminate implausible values from analysis.27 ,28 The ranges used were as follows: male height: 51.3–80.5 inches, male weight: 85.6–480.9 pounds; female height: 51.8–73.5 inches, female weight: 74.1–570.9 pounds. First, prior to BMI calculation, heights and weights were compared with the predetermined ranges; participants with values outside the ranges were eliminated from the analysis. Next, participants with a calculated BMI outside the valid range were eliminated from the analysis (men: 14.9–65.0; women: 13.4–76.1).
Food environment
As in previous work, the zip code-level food environment measures were derived using the Dun and Bradstreet commercial vendor list for 2005.19 ,29 ,30 These data include detailed information on business name, geocoded location and standard industrial classifications (SIC). Food outlets were categorised into 15 different types of retail food business primarily through the identification of SIC codes and annual sales data for grocery stores: supermarkets, fruit and vegetable markets, natural food stores, local fast food restaurants, national fast food restaurants, pizza restaurants, convenience stores, bodegas, bakeries, candy and nut stores, meat markets, non-fast food restaurants, grocery stores, fish markets and specialty food stores as described previously.19 These 15 types of outlets were then classified a priori as BMI-healthy (supermarkets, fruit and vegetable markets, natural food stores), BMI-unhealthy (local and national fast food restaurants, pizza restaurants, convenience stores, bodegas, bakeries, candy and nut stores, meat markets) and BMI-intermediate (non-fast food restaurants, grocery stores, fish markets and specialty food stores) based on available evidence linking their association to energy intake and the quality of food sold.19 ,31 ,32
To describe the retail food ecology in each zip code, a series of additional food environment measures were also derived. The density of food outlets, measured as the number of food outlets in each zip code divided by the zip code total land area (km2), was calculated. The relative concentration of each of the three retail food outlet groups described was calculated as the proportion of retail food outlets that were BMI-healthy, BMI-unhealthy and BMI-intermediate food outlets. The diversity of the retail food environment in each zip code was also described using a scale that indicated how many of the 15 different types of food outlets were represented in the zip code by the presence of at least one outlet from that type. The hypothetical range of the diversity measure is zero, indicating that the zip code does not have at least 1 of the 15 different types of food outlets, up to 15, indicating that the zip code has at least one retail outlet from each of the 15 types described above. For example, a zip code with two bodegas and one meat market but void of the other 13 types of food outlets would score a two on the diversity scale (1 for having at least 1 bodega and 1 for having at least 1 meat market and 0 for the remaining 13 food outlets).
Built environment
Additional zip code-specific measures were derived from the 2000 US Census, including the proportion of the population whose ratio of income to poverty level is 100% below the federal poverty line, and the proportion of the population who are African American.33 These Census variables were included in the model to control for potential confounding by zip code-level sociodemographic characteristics operating above and beyond the individual-level sociodemographic characteristics.34 ,35 The walkability index was derived from data measuring multiple built environment characteristics hypothesised to promote walking including density of residential units, density of intersections, land use mix, retail floor space and density of subway stations. A more detailed account walkability including sources of data to derive the index can be found elsewhere.36
Statistical analysis
Demographic characteristics for the entire sample, stratified by median zip code poverty status, were tabulated using percentages for discrete variables except for BMI, a continuous variable, for which mean and SD were used. Pearson correlation coefficients were used to estimate the correlation among food environment variables. To predict BMI, a linear mixed effects model which included a random effect for zip code was used to account for clustering of BMI within each zip code. All models were adjusted for individual demographic characteristics: gender, age, race, ethnicity, education, income-to-poverty ratio, nativity, marital status, self-reported health and employment. The zip code variables included in the mode were the proportion of residents living in poverty, the proportion of residents that were African American and walkability. To improve comparability, all zip code variables including the food environment variables were rescaled by subtracting the median of that variable from each value and then dividing by the IQR of that variable. As a result, each β coefficient reflects the association with BMI for the difference in the 75th centile to the 25th centile of that variable's range. To assess the impact of zip code poverty status on the association between the food environment and BMI, the study sample was stratified by the median zip code poverty status. Each model accounted for the zip code level sampling weights. Coefficients and 95% CIs are presented. In describing the zip code level effects, the term neighbourhood is used as a proxy. Analyses were performed using HLM V.6.08 (Scientific Software International, Skokie, Illinois, USA) and Stata V.12 (Stata Corporation, College Station, Texas, USA) in 2011.
Results
A total of 48 482 participants completed the CHS survey from 2002 to 2006. Of these, 44 578 (92%) participants had height and weight data available to estimate BMI. Of these, less than 0.01% had an implausible height or weight as determined by the guidelines (N=269). The remaining 7.99% had missing height and weight data. After imposing criteria on the calculation of BMI, an additional 27 participants had a biologically implausible BMI, thus leaving 44 282 participants available for analysis. Table 1 presents descriptive data for the entire study population stratified by poverty status.
Demographic characteristics of the study population for the entire sample stratified by poverty status*
Of the 38 028 food outlets categorised, 4.6% were labelled BMI-healthy, 43.4% were labelled BMI-unhealthy and 52% were classified as BMI-intermediate. A nearly perfect negative linear association existed between the proportion of BMI-intermediate and BMI-unhealthy food outlets across all neighbourhoods (r=−0.97; table 2). The positive correlation between food outlet density and the proportion of BMI-intermediate food outlets indicates that neighbourhoods with greater food outlet density have a greater proportion of BMI-intermediate food outlets. In addition, there was an inverse correlation between food outlet density and the proportion of BMI-unhealthy foods (r=−0.51) (table 2 and figure 1). Examples of neighbourhoods illustrating the inverse correlation between food outlet density and the proportion of BMI-unhealthy foods can be found in the Staten Island borough (figure 1). The BMI-intermediate and BMI-healthy variables were selected a priori to be removed from further analysis as the paper sought to determine the effects of the proportion of BMI-unhealthy food outlets on BMI.
Correlations of Zip code-level food diversity measures, proportion of healthy, unhealthy and intermediate food outlets and density of food outlets

Distribution of food environment measures across New York City zip codes. (A) The distribution of the proportion of body mass index (BMI)-unhealthy food outlets across New York City zip codes. Increasing colour intensity illustrates zip codes with a higher proportion of BMI-unhealthy food outlets. BMI-unhealthy food outlets include: fast food restaurants, pizza restaurants, convenience stores, bodegas, bakeries, candy and nut stores and meat markets. (B) The distribution of food outlet density across New York City zip codes. Increasing colour intensity illustrates zip codes with greater density. The food outlet density variable was calculated by summing the stores for each zip code divided by the total land area (km2) for that zip code. Access the article online to view this figure in colour.
The independent association of BMI and each zip code characteristic was evaluated prior to inclusion in the final models. In bivariate analyses, each zip code variable was statistically significantly associated with BMI and thus included in the final models (data not shown). In multilevel analyses of the associations between BMI and the food environment measures, both food outlet density (negatively) and the proportion of BMI-unhealthy food outlets (positively) were significantly associated with BMI after controlling for individual and neighbourhood characteristics (table 3). A strong and statistically significant positive association was observed between the proportion of BMI-unhealthy food outlets and BMI for the sample living in the low-poverty neighbourhoods. A similar association was not observed in the high-poverty neighbourhoods. Increasing food outlet density was statistically significantly associated with a lower BMI independent of the neighbourhood poverty status (table 3 and figure 2).
Association between body mass index and zip code-level characteristics of the food environment† for the study sample and stratified by poverty status‡ (estimate (95% CI))

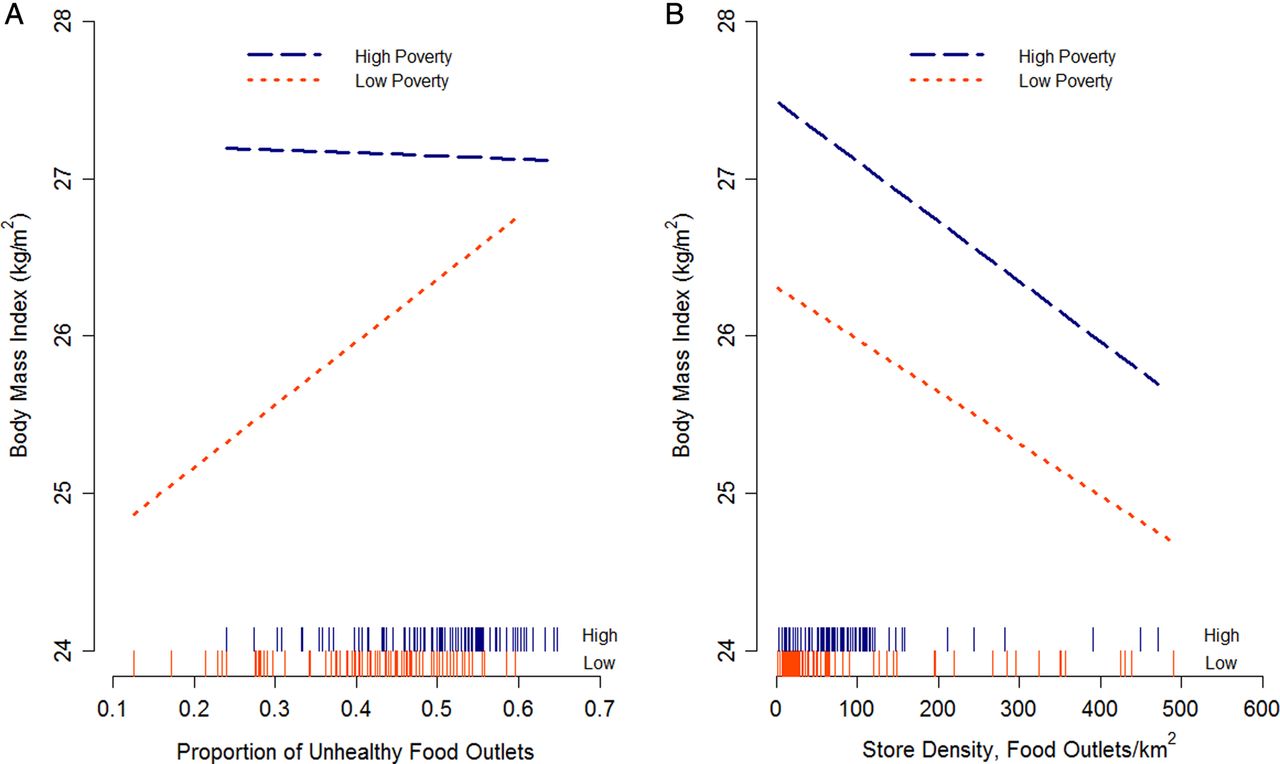
Adjusted association between body mass index and food environment measures. The model in each panel adjusted for individual characteristics and the percentage of neighbourhood residents who were African American, the percentage who were below the federal poverty line, neighbourhood walkability, the proportion of commercially zoned land use, diversity of food outlets and the density of food outlets (A) or the proportion of body mass index (BMI)-unhealthy food outlets (B). The starting and ending points of each line represents observed values of the independent variable. Each line on the x axis represents a zip code-specific value for the predictor variable (proportion of BMI-unhealthy food outlets and food outlet density). (A) Adjusted association between BMI and the proportion of BMI-unhealthy food outlets stratified by the median percentage of area residents whose income is below the federal poverty line. (B) Adjusted association between body mass index and the density of food outlets stratified by the median percentage of area residents whose income is below the federal poverty line. Access the article online to view this figure in colour.
The rug plots in figure 2 illustrate the distribution of predictor variables stratified by low and high poverty. Each line on the x axis of figure 2 represents a zip code-specific value for the predictor variable. As shown in figure 2A, fast food density is concentrated in high-poverty neighbourhoods, consistent with previous research.37
Discussion
The results from this study demonstrate the value of measuring the association of BMI with multiple measures of the food environment, specifically the importance of including all types of food stores in addition to presence and accessibility. These results indicate that the proportion of food outlets classified as BMI-unhealthy in a zip code was associated with a higher BMI in low-poverty neighbourhoods. In addition, BMI was negatively associated with the density of food outlets, a finding that was seen in both higher and lower income zip codes.
Studies of associations between unhealthy food options such as fast food establishments and either obesity risk or diet quality have provided inconclusive results despite considerable attention.3 ,10 ,14 ,17 The results presented here support a more nuanced interpretation. In this study, the proportion of retail food outlets that were classified as BMI-unhealthy in high-poverty neighbourhoods was not associated with higher BMI. However, there is a gradient within the high-poverty neighbourhoods. Increasing neighbourhood poverty within the high-poverty group results in a higher BMI, suggesting that living in very high-poverty neighbourhoods outweighs any effect of the number of BMI-unhealthy food outlets available. This is in contrast to the significant positive association observed among low-poverty neighbourhoods, which is consistent with reports illustrating positive associations of BMI and individual food outlets labelled as a fast food, convenience store or grocery store and a higher BMI value in areas with increasing availability of BMI-unhealthy outlets.8 ,9 ,16 ,32 Previous research has demonstrated similar attenuated associations observed in economically disadvantaged communities which may be partly explained by the presence of multiple problems in these neighbourhoods, residential self-selection bias and the possibility of a saturation effect of the BMI-unhealthy food outlet category.38 ,39
Independent of neighbourhood income, increasing food outlet density was associated with lower BMI. Zick et al40 reported similar findings suggesting that both high-income and low-income neighbourhoods with multiple food options had a lower risk of obesity. As an explanation for this finding, Zick et al40 proposed that the presence of multiple food options corresponds to a higher concentration of walkable destinations and that such neighbourhoods had more food options expected to be BMI-intermediate.41 Many of the food outlet types in the BMI-intermediate category consist of non-fast food restaurants such as ethnic restaurants and there is some evidence from studies of adolescents to suggest that use of non-fast food restaurants predicts increased vegetable intake.42 Furthermore, increasing competition among food establishments in high food outlet density areas may lower prices for healthy food options within all food outlet groups, which may lead to affordable prices and potentially greater consumption of healthy foods. Or consumers, when presented with a variety, might anchor decisions differently based on weighing the available options.20–23
A previous study by Black et al11 evaluated both protective and potentially harmful neighbourhood elements on obesity within NYC. The authors observed a higher risk of obesity in neighbourhoods, with fewer supermarkets and fitness facilities and with lower neighbourhood income. Interestingly, a neighbourhood amenities score consisting of an availability of supermarkets, restaurants, fast food outlets, beverage and snack stores, fitness facilities and commercial land use showed a significant negative association with obesity. Though our results did not include physical fitness as a covariate in the analysis, they support the possibility that neighbourhood investment and characteristics of the aggregated food ecology drive the risk of obesity.
Two previous analyses using the same food outlet classifications in NYC did not observe associations between BMI or obesity and access to BMI-unhealthy food outlets.19 ,31 In contrast to this report, which did not observe an independent association of BMI and BMI-healthy outlets, both studies did observe significant inverse associations between BMI or obesity and a higher density of BMI-healthy stores. The differences in findings between these prior studies and the present work might result from differences in the level of aggregation used in the analyses. One of the prior studies had access to exact address data for the study participants and measured the food environment within 0.5 miles of the residence,19 while the other used a census tract of residence.31 In contrast, the current work used the residential zip code, which is a substantially larger area. The modifiable-areal unit problem, the observation of different associations across different spatial units of aggregation, is an issue in comparing results across studies that used different spatial scales of analysis.43 ,44 These studies suggest that as the geographic unit increases, a threshold may be reached by which BMI-unhealthy food establishments have a greater influence on food choice.
This study has several limitations. First, the cross-sectional design limits our ability to make causal inferences about these relationships. Moreover, it is difficult to discern the impact of self-selection bias. Neighbourhoods with a higher food outlet density may attract individuals with a healthful lifestyle and a lower BMI. Alternatively, investment may occur in areas where businesses believe healthier individuals live. Without knowledge of the temporal changes in retail investment and the BMI patterns, it is not possible to correct this bias here. However, residential choice in NYC is constrained by economic resources and the adjustments for individual-level and zip code-level socioeconomic status represent, in part, an effort to adjust for selection. In addition, misclassification of food outlets into the BMI-healthy, BMI-unhealthy and BMI-intermediate categories could bias the results. In addition, the broad classifications given to each store type may not accurately reflect the internal heterogeneity of food options. For example, bodegas, classified as BMI-unhealthy, may provide both healthy and unhealthy options and, as a result, bias the coefficients. Similarly, supermarkets, classified as BMI-healthy, are also sources of energy-dense, nutrient poor food options and the purchase of such foods would result in misclassification of the exposure and also bias the coefficients towards the null.45 Future research should consider heterogeneity of food choices within stores in addition to classification schemes. Also, these data only consider the home neighbourhood food environment of each resident completing the CHS survey. Residents may consume meals and snacks near their workplace or travel throughout the city and these phenomena among adolescents and the local food environment around schools have been reported.46 Failure to take account of the food environment away from home introduces measurement error.
In summary, consideration of multiple food environment measures provides a new approach to evaluating the effects of the retail food environment on BMI. While this analysis focused on New York City, which has a dense and diverse network of restaurants, urban environments with comparable low-income neighbourhoods and store penetration may observe similar associations with BMI. In developing new properties, urban designers should consider including significant retail space to increase the density of healthier food options.
What is already known on this subject
-
Numerous studies have reported on the association between body mass index (BMI) or obesity and food stores such as supermarkets, convenience stores and fast food restaurants.
-
Inconsistent findings across studies may be a result of methodological differences in the food environmental measures used.
What this study adds
-
This study develops new measures to describe the food environment and tests the association with BMI among adults in an urban environment.
-
The proportion of unhealthy food stores is positively associated with BMI.
-
The increasing density of food stores lowers BMI in both high-income and low-income neighbourhoods.
-
Researchers and policymakers should be mindful of the collective food environment when trying to understand obesity risk among different populations.
References
Footnotes
-
Contributors JHS led the analysis and writing of the paper. KN, GSL, KK, JQ, CCW, MDMB and AR helped develop the analysis plan and provided comments on the draft of the manuscript. PA, DV and TGH provided comments on the manuscript. All authors revised the final version of the paper.
-
Funding This work was supported by grants from the National Institutes of Health (Grant numbers 5R01DK079885–02 and P60-MD0005-03).
-
Competing interests Andrew Rundle has received consulting fees from EHE International, a company that provides physical examinations and wellness programmes to corporations. James Stark, Kathryn Neckerman, Gina Lovasi, Kevin Konty, James Quinn, Peter Arno, Deborah Viola, Tiffany Harris, Christopher Weiss and Michael Bader do not declare any competing interests.
-
Provenance and peer review Not commissioned; externally peer reviewed.