Article Text

Abstract
Background Childhood growth affects long-term health and could contribute to health inequalities that persist throughout life.
Methods We compared growth data of 4-year-old to 6-year-old children born 1997–2002 in UK (n=15 168), Sweden (n=6749) and rural China (n=10 327). SD scores (SDS) were calculated against the WHO Growth Standard. Obesity and overweight were defined by the International Obesity Taskforce cut-offs, and stunting, underweight and thinness by height, weight or body mass index (BMI)<−2 SDS. Associations with maternal education were standardised by calculating the Slope Index of Inequality (SII).
Results Mean SDS height, weight and BMI in the UK (−0.01, 0.42, 0.62, respectively) and Sweden (0.45, 0.59, 0.45) were higher than in China (−0.98, −0.82, −0.29). Higher maternal education was consistently associated with taller offspring height SDS (SII: UK 0.25; Sweden 0.17; China 1.06). Underweight and stunting were less common in the UK (prevalence: 0.6% and 2.2%, respectively) and Sweden (0.3% and 0.6%) than in China (9.5% and 16.4%), where these outcomes were inversely associated with maternal education (SII: −25.8% and −12.7%). Obesity prevalence in the UK, Sweden and China was 4.8%, 3.7% and 0.4%, respectively. Maternal education was inversely associated with offspring obesity in the UK (SII: −3.3%) and Sweden (−2.8%), but not in China (+0.3%).
Conclusions Higher maternal education was associated with more favourable growth in young children: lower obesity and overweight in the UK and Sweden, and lower stunting and underweight in rural China. Public health strategies to optimise growth in early childhood need to acknowledge socioeconomic factors, but possibly with a different emphasis in different settings.
- GROWTH
- PUBLIC HEALTH
- INEQUALITIES
- NUTRITION
- OBESITY
Statistics from Altmetric.com
Introduction
Growth during childhood is assessed by comparing a child's body size (height, weight and body mass index, BMI) to that of optimally nourished children of the same age and sex. When the growth of a child is outside a predetermined threshold, it is suggestive of undernutrition or overnutrition. The WHO has published international growth charts based on the growth of optimally nourished, breastfed children in six countries and recommends these as the standard of optimal childhood growth.1 According to the WHO, ‘stunting’ is defined as height <−2 SD scores (SDS), ‘underweight’ as weight <−2 SDS and ‘thinness’ as BMI < −2 SDS for age and sex. Stunting and thinness indicate chronic and acute undernutrition, respectively, while underweight indicates the combination of these factors.2 Child undernutrition is associated with increased mortality and affects both physical and cognitive performance.3 The International Obesity Task Force has specified age-specific and sex-specific thresholds for defining overweight and obesity that are related to long-term adverse health outcomes such as type 2 diabetes, cardiovascular disease, certain cancers, fatty liver disease and osteoarthritis, among others.4 The rising prevalence of childhood obesity therefore presents a major public health challenge for the 21st century, increasing the burden of chronic non-communicable diseases in both developed and developing countries.5 ,6
The WHO Commission on Social Determinants of Health has called for national and global health equity surveillance systems for monitoring of policy and action to reduce health inequity and to create a more just and fair society.7 The above epidemiological evidence suggests that preventing undernutrition and overnutrition and optimising the growth of children during early life could reduce inequalities in health that result from socioeconomic disparity. We hypothesised that the effects of such socioeconomic disparities on childhood growth would differ in different settings, depending on both the prevalence of undernutrition and overnutrition in those settings, and also on the strength of socioeconomic gradients, which may vary widely even within developed settings.8 For example, within Europe, Sweden has among the lowest socioeconomic gradients in self-perceived health, a good predictor of future health, according to education levels in women, while England has among the highest gradients.9 The most commonly used markers of socioeconomic position are education, occupation and income, which are highly inter-related. Owing to the problem of co-linearity in statistical models, most studies have used a single marker of socioeconomic status. A recent review found that a single indicator of socioeconomic status was used in 31/45 studies; parental education was most commonly studied (20/45 studies) and was inversely associated with childhood adiposity in 15 of these 20 studies.10 As maternal education is likely to affect income and nutrition knowledge, we compared the associations between maternal education, as a marker of socioeconomic position with particular relevance to early childhood nutrition, and growth in contemporary 4-year-old to 6-year-old children in Sweden, the UK and rural China, as settings chosen to represent extremes of socioeconomic effects.
Methods
Study design and populations
UK: millennium cohort study
Millennium cohort study (MCS) is a nationally representative birth cohort study of 18 819 babies born 2000–2001 in the UK. MCS is unique in having intentionally oversampled from families living in areas of child poverty and areas with high ethnic minority populations and provides extensive data on social, economic and psychological factors.11 Maternal education was ascertained by means of a questionnaire. Interviews and measurements took place in the home when children were 9 months, 3 years (n=15 382) and 5 years (n=15 042) old. For this analysis, we used anthropometry data from the 3rd MCS sweep, when children were 5 years old.
Sweden: all babies in Southeast Sweden study
All Babies in South East Sweden Study (ABIS) is a representative birth cohort study of 17 055 babies born 1997–1999 in Southeast Sweden. Questionnaire data were provided at birth and at ages 1, 2.5 and 5 years. For this analysis, we used data on maternal education and child anthropometry collected at 5 years of age. Child anthropometry was not measured objectively and was reported by parents. These data have been shown to have good agreement with those recorded objectively at the Child Health Service (intraclass correlation coefficient for height: r=0.93, p<0.001, for weight r=0.98, p<0.001).12
Rural China: National Children Growth Standard Survey
National Children Growth Standard Survey (NCGSS) is a cross-sectional survey of 84 009 rural Chinese children below 5 years, from 10 provinces, conducted in 2006. Children who lived with an agricultural-registered parent in rural areas for a duration of at least two-thirds of their lives, were identified as rural children and eligible for this survey. First, 10 provinces (Jilin, Shanxi, Gansu, Xinjiang, Jiangsu, Sichuan, Jiangxi, Hunan, Guangxi and Guizhou) were selected from a total of 31 provinces in mainland China. Thereafter, four counties from each province were sampled except for Jilin province which had five counties recruited to achieve the sample size requirement for each province. This was followed by 3–6 towns/villages, selected from each county. To allow comparison of similar aged British, Swedish and Chinese children, for this analysis we used data from the 10 327 NCGSS children who were between 4 and 5 years of age (born 2001–2002). Sociodemographic data were collected by parental questionnaire and child anthropometry was collected by centrally trained staff using the same calibrated instruments.
Research ethics committee approval was obtained for all studies from the relevant ethics committees in each country and all parents gave informed consent.
Maternal education
In each study, we grouped the level of maternal education into five categories from lowest to highest. In MCS (UK), categories were based on age when mother left full-time education (below 15, 16, 17/18, 19/20 and above 20 years). In ABIS (Sweden), categories were based on the level of completed education (primary school, vocational training, academic/specialist training, undergraduate and university). In NCGSS (rural China), categories were based on the level of completed education (illiterate/semi-illiterate, elementary, middle, high school and college; see online supplementary figure S1). In each study, the proportion of children in the different categories of maternal education (lowest to highest) was calculated and the outcome (child growth status) was attributed to the midpoint of the cumulative proportion in that category. This allowed all education groups to be assigned their relative rank in the population and these values were used for the regression analyses. For example, in MCS, 10% were in the lowest category; hence, the midpoint of 0.05 was used (cumulative 10% and range 0–10%, hence midpoint of range 0+10/2). In total, 38% were in the second category, so the midpoint for the cumulative distribution was 0.29 (cumulative 48% and range 10–48%, hence midpoint of range 10+38/2). In total, 29% were in the third category and the midpoint was 0.62 (cumulative 77% and range 48–77%, hence midpoint of range 48+29/2). Only 7% were in the fourth category and the midpoint was 0.80 (cumulative 84% and range 77–84%, hence midpoint of range 77+7/2). Only 16% were in the fifth category and the midpoint was 0.92 (cumulative 100% and range 84–100%, hence midpoint of range 84+16/2). A similar process was followed for all the databases.
Child anthropometry
Height, weight and BMI were converted to SDS adjusted for age and sex based on the WHO Growth Standard.13 The SDS refers to the number of SDs whose measurement lies above (+) or below (−) the median. Hence, 2.3% of the population will be expected to lie above +2 SDS, and 2.3% to lie below −2 SDS for any measurement. We excluded implausible values for BMI, weight or height (beyond ±6 SDS).
According to the WHO criteria, stunting, underweight and thinness were classified by height, weight and BMI<−2 SDS, respectively. Obesity and overweight were defined using the International Obesity Task Force age-specific and sex-specific BMI cut–offs, which were reported for the UK 1990 reference.14
Statistical analysis
Since education was recorded and classified differently in the three countries and the percentage of participants in the different categories varied from 1% to 59%, we analysed the Slope Index of Inequality (SII) and Relative Index of Inequality (RII) as standardised measures of the association between ‘relative’ socioeconomic disparity and child growth outcomes within each setting, and to allow a fair comparison of these associations between settings. SII is the regression coefficient from linear regression models and represents the absolute difference in growth of children of mothers in the hypothetical top and bottom centiles for maternal education. RII is the SII divided by the mean (for continuous variables) or prevalence (for categorical variables) of the outcome measure. These regression-based indices take into account the whole socioeconomic distribution and remove variability in the size of socioeconomic groups as a source of variation in the magnitude of inequalities in health.15
We also performed multivariable logistic regression analyses to quantify the association between maternal education (lowest of the five categories as reference) and adverse childhood growth (obesity, overweight, underweight, stunting and thinness).
Since maternal education may be confounded by maternal age, we adjusted all regression models for mother's age at birth of the child, and in the UK, it was additionally adjusted for ethnicity.
All analyses were performed using STATA statistical software.
Results
Sample characteristics
Anthropometry data were available on 15 168 UK (MCS), 6749 Swedish (ABIS) and 10 327 rural Chinese (NCGSS) children at mean ages 5.2, 5.4 and 4.5 years, respectively (table 1). In the UK and Sweden, mean weight SDS and BMI SDS were above the WHO median (UK: 0.42 and 0.62, Sweden: 0.59 and 0.45, respectively). In Sweden, mean height SDS (0.45) was also above the WHO median. In rural China, mean height, weight and BMI SDS were below the WHO median (−0.98, −0.82 and −0.29). Of these children, data on maternal education were available on 98% (n=14 799) in MCS, 98% (n=6602) in ABIS and 99.7% (n=10 301) in NCGSS, and the children included in this analysis were representative of the entire cohort. Owing to sex differences in the prevalence of underweight and stunting among the rural Chinese sample, data are presented for boys and girls separately (see online supplementary tables S1 and S2).
Summary of measures in each study
Inequality in children's height
In all three settings, maternal education was positively associated with offspring height SDS, but the effects were largest in rural China (SII in the UK: 0.25; Sweden 0.17; rural China 1.06; table 2). The prevalence of stunting was lowest in Sweden (0.6%) and highest in China (16.4%), where it was strongly inversely associated with maternal education (SII: −25.8%; RII: −158%; table 3). In rural China, the predicted prevalence of stunting among children in the lowest rank of maternal education was 28.3% compared to only 2.5% in the top rank (figure 1). In the UK, the prevalence of stunting was low (2.2%), but it showed a strong inverse association with maternal education (SII: −2.7%; RII: −123%; lowest rank predicted prevalence 3.6% and highest rank predicted prevalence 0.9%).
Standardised inequalities in children's height, weight and BMI SDS in each setting
Standardised inequalities in growth outcomes in each setting

Inequalities in childhood stunting. Lines represent the Slope Index of Inequality, based on standardised maternal education; symbols represent the prevalence of stunting according to the WHO classification.
Inequality in children's weight
In rural China, maternal education was positively associated with offspring weight SDS (SII: 0.71, table 2). The prevalence of underweight was low in the UK (0.6%) and Sweden (0.3%), but high in rural China (9.5%), where it was strongly inversely associated with maternal education (SII: −12.7%; RII: −134%; table 3). In rural China, the predicted prevalence of underweight among children in the lowest rank of maternal education was 15.3% compared to 2.6% in the top rank (figure 2).
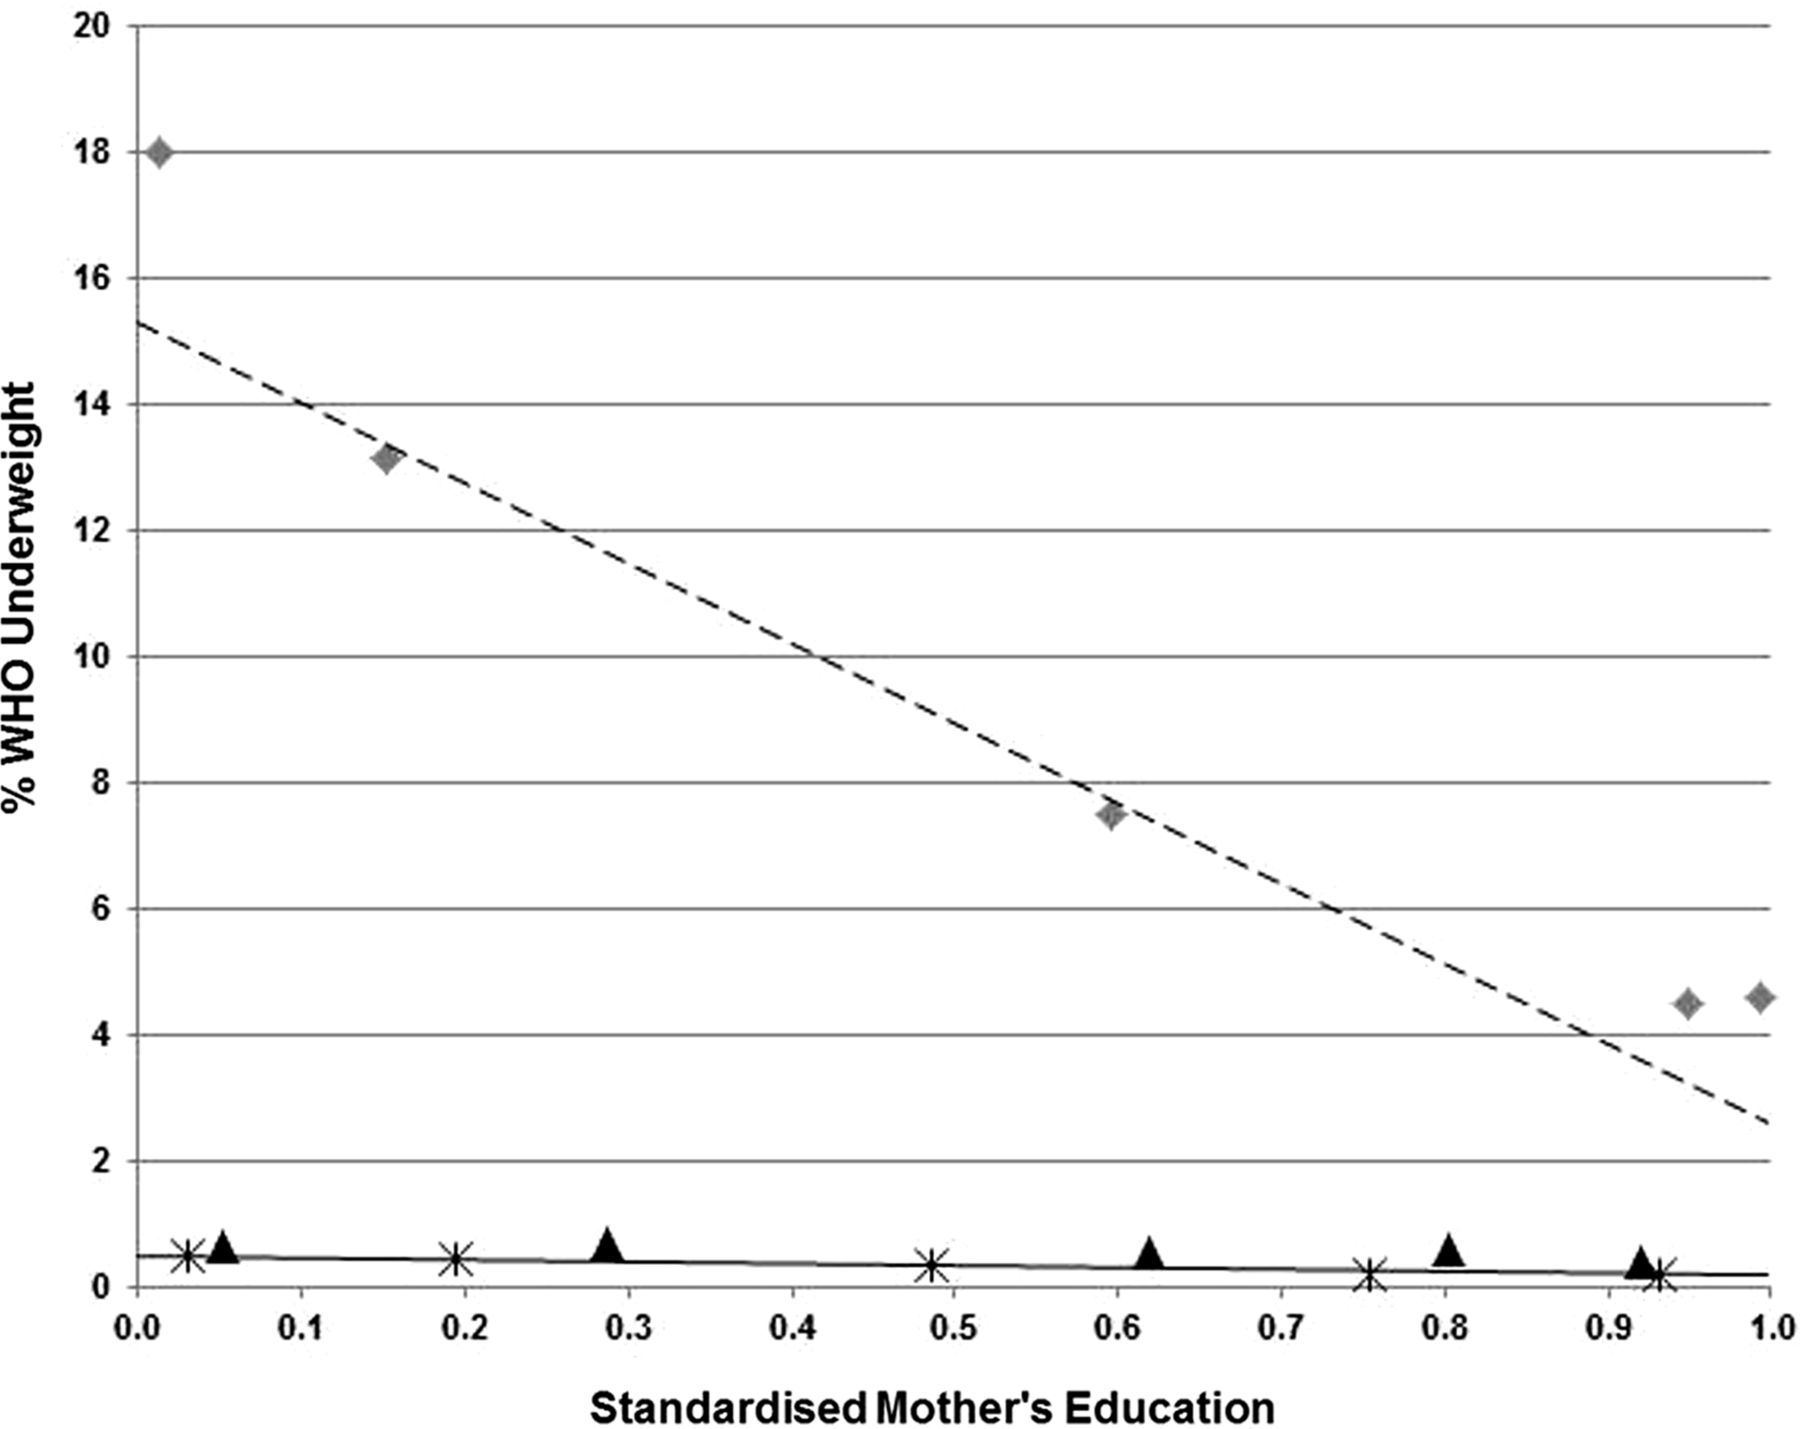
Inequalities in childhood underweight. Lines represent the Slope Index of Inequality, based on standardised maternal education; symbols represent the prevalence of underweight according to the WHO classification.
Inequality in children's BMI
In the UK and Sweden, maternal education was inversely associated with offspring BMI SDS (SII: −0.18 in both the UK and Sweden), while in rural China there was no association with BMI SDS (SII: 0.02; table 2). The prevalence of obesity was 4.8%, 3.7% and 0.4% in the UK, Sweden and rural China, respectively, and was inversely associated with maternal education in the UK and Sweden (SII: −3.3% and −2.8%; RII: −69% and −75%, respectively), whereas in rural China positive trends were seen (SII: 0.3%; RII 68%), particularly among boys (SII: 0.7%; RII: 131%; see online supplementary table S2). In the UK and Sweden, predicted obesity prevalence among children in the lowest maternal education centiles was 6.1% and 5.1%, respectively, and for children of mothers in the highest education centiles, it was only 2.8% and 2.4%, respectively (figure 3).
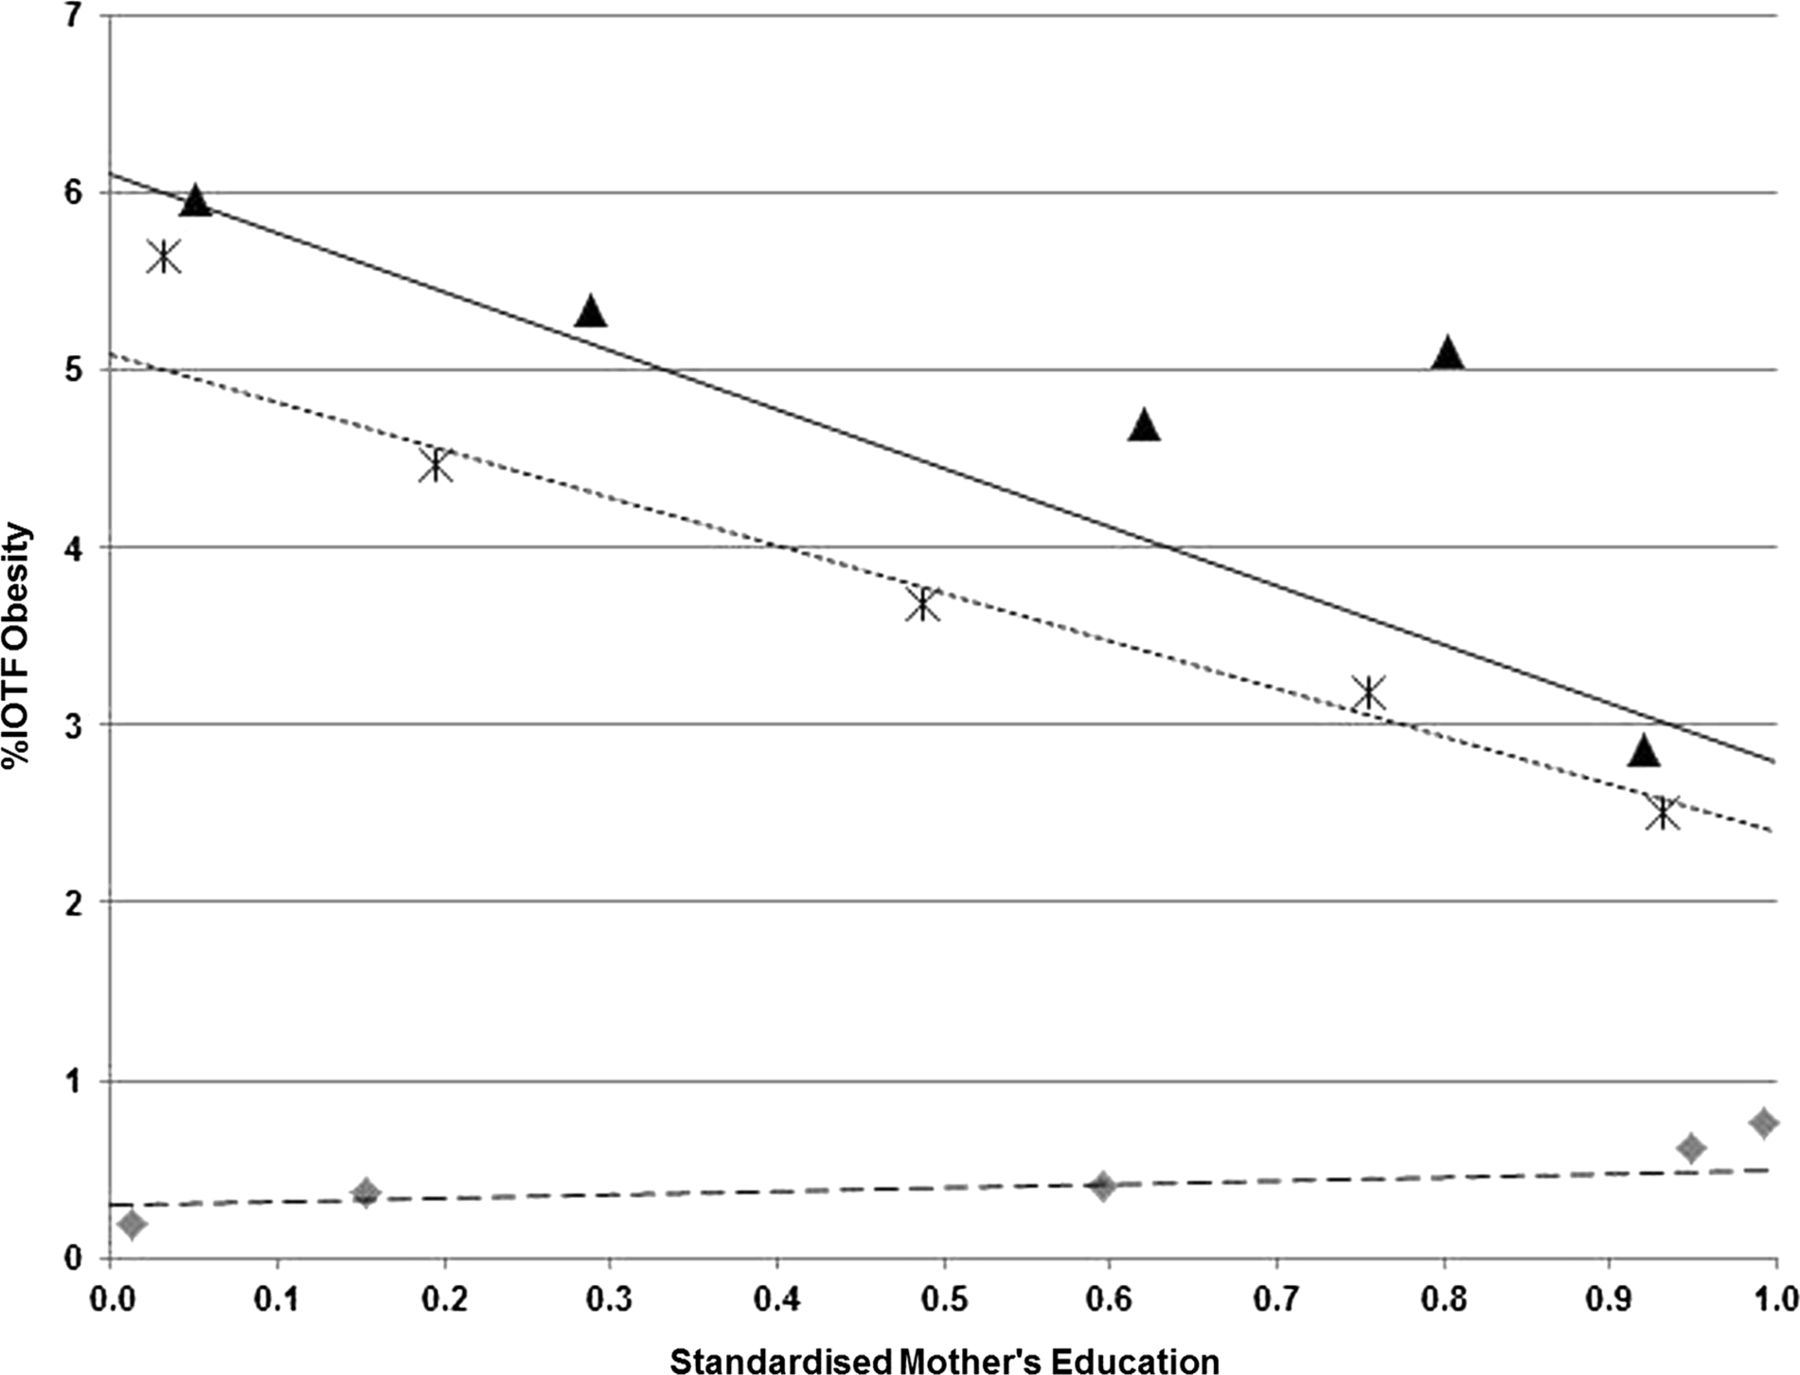
Inequalities in childhood obesity. Lines represent the Slope Index of Inequality, based on standardised maternal education; symbols represent the prevalence of obesity according to the International Obesity Task Force classification.
Similarly, overweight prevalence was 20.5%, 16.5% and 2.9% in the UK, Sweden and rural China, respectively, and was inversely associated with maternal education in the UK and Sweden (SII: −5.2% and −7.4%, respectively), but not in rural China (SII: 0.1%; figure 4).

Inequalities in childhood overweight. Lines represent the Slope Index of Inequality, based on standardised maternal education; symbols represent the prevalence of overweight according to the International Obesity Task Force classification.
Prevalence of thinness (BMI SDS<−2) was low in all three settings (0.4%, 0.6% and 2.6% in the UK, Sweden and China, respectively) and not associated with maternal education.
For ease of interpretation, table 4 shows the mean height, weight and BMI SDS and ORs for child obesity, overweight, underweight, stunting and thinness (lowest maternal education category reference) in the five categories of maternal education.
Growth of children by five categories of maternal education (lowest to highest) in each setting
Discussion
Main findings
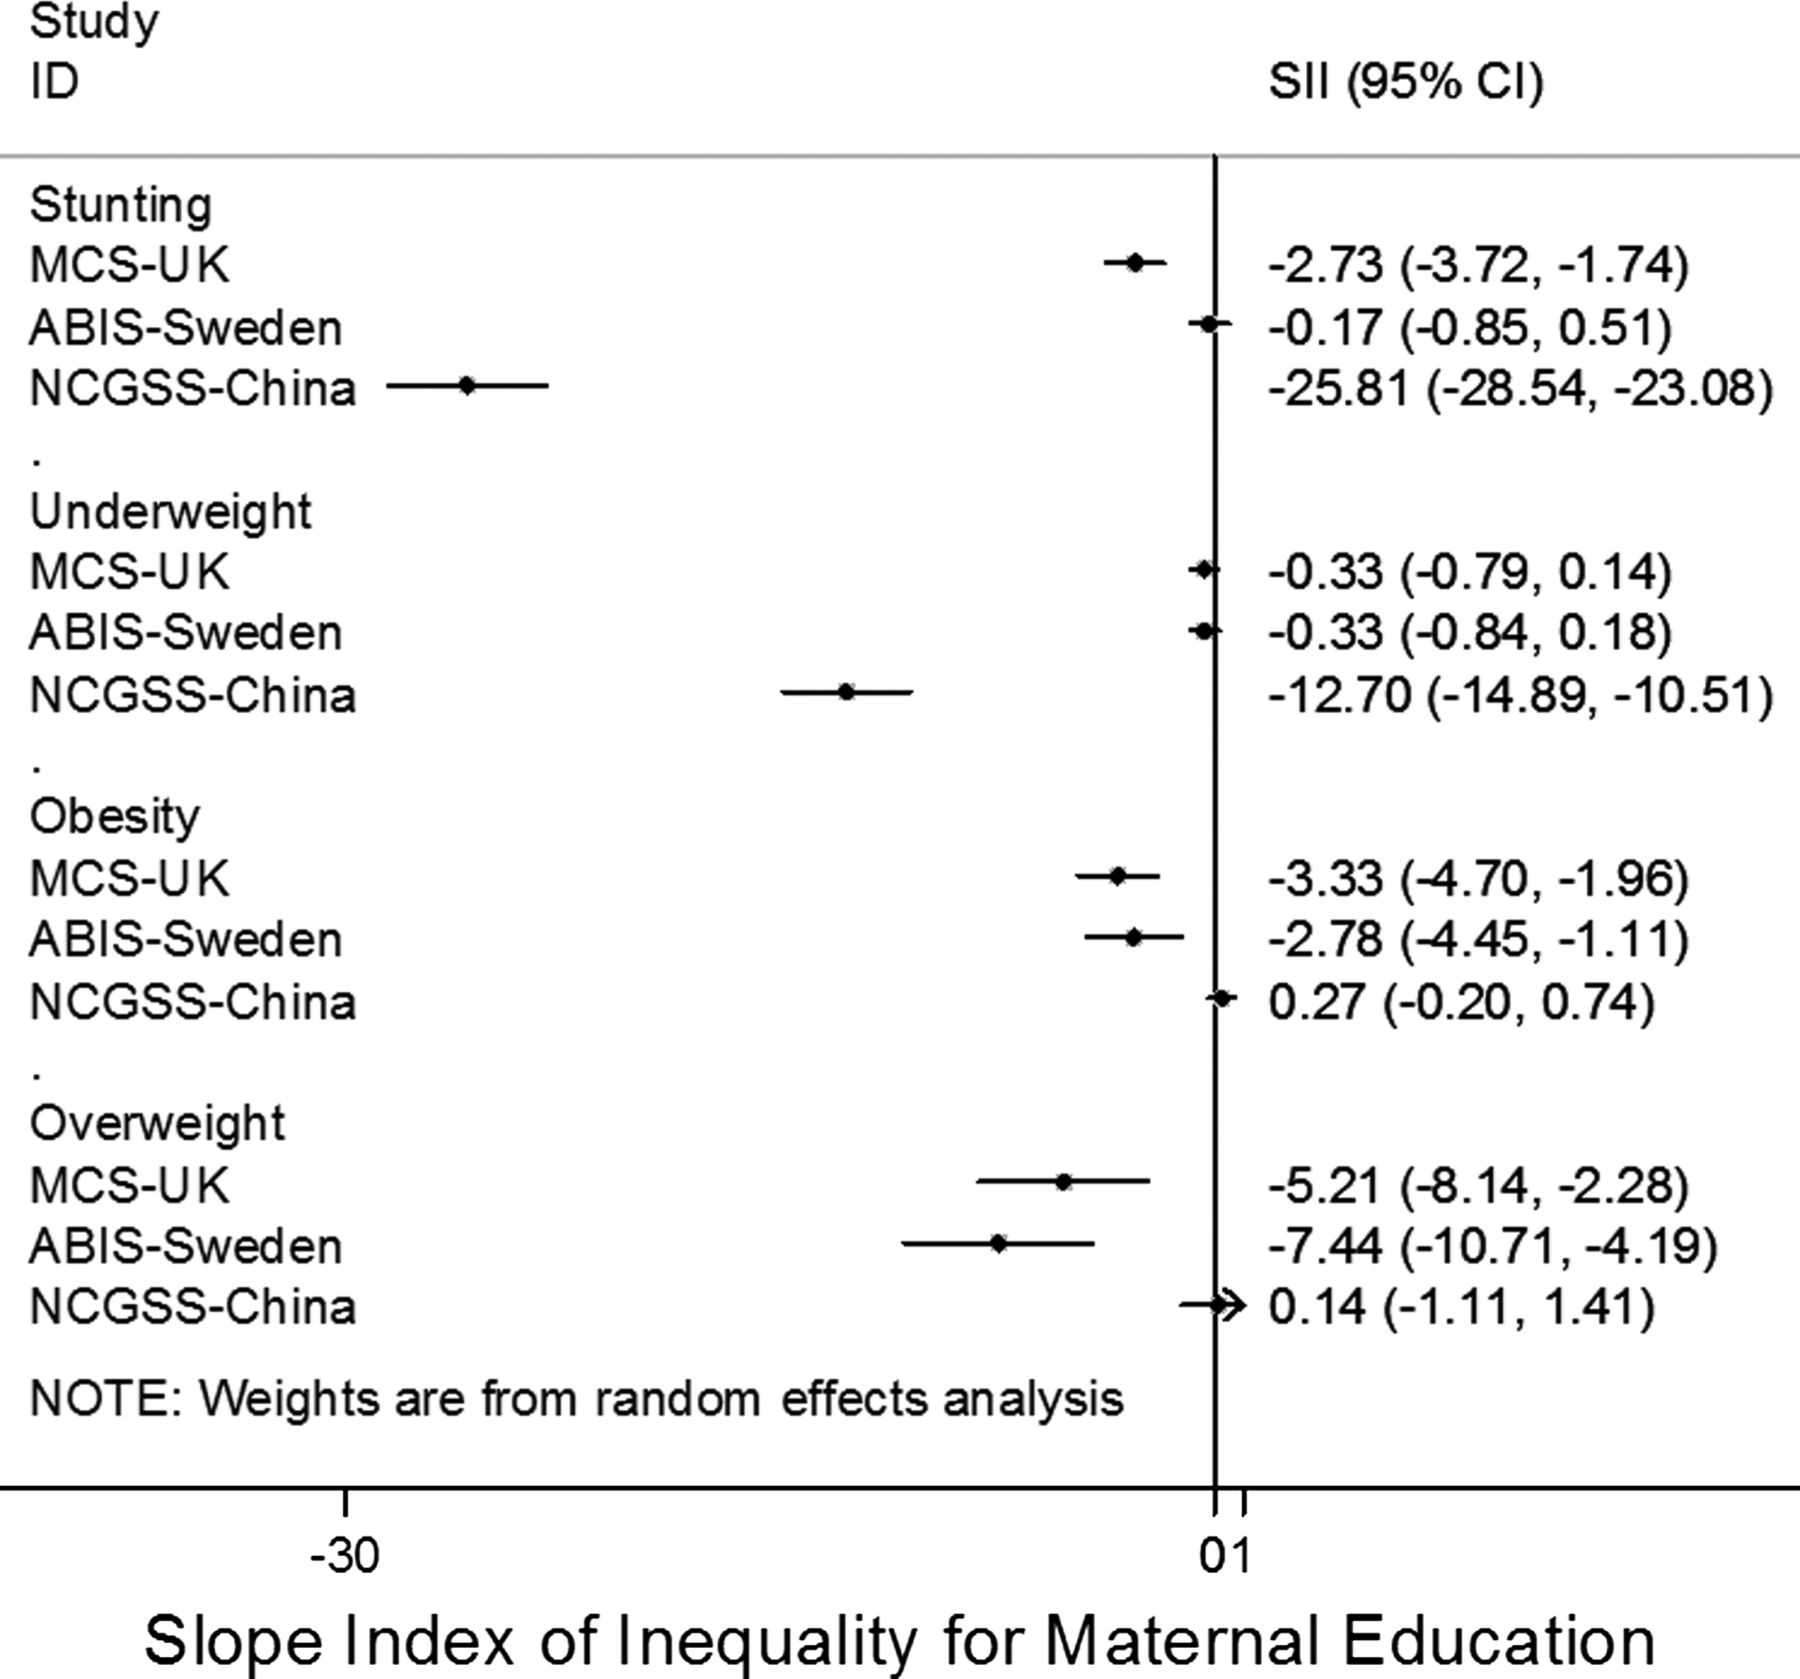
Across three contrasting socioeconomic settings, we observed that higher maternal education was associated with the child's weight, height and BMI being closer to the WHO standard for optimal growth. Childhood stunting and underweight were common in rural China and were strongly inversely associated with maternal education. Childhood obesity and overweight were common in Sweden and UK and were inversely associated with maternal education in both countries. There was no association between stunting and maternal education in Sweden, but an inverse association in the UK, consistent with other reports that these European countries exhibit different levels of health inequity.8 These differences in associations in the three settings are demonstrated by the non-overlapping 95% CIs for SII (figure 5). In rural China, the vast difference in stunting between the top and bottom ranks of maternal education indicates a very strong socioeconomic gradient on child growth in that setting. In fact, the predicted prevalence of stunting in the top rank of maternal education in rural China (2.5%) was lower than the predicted prevalence of stunting in the bottom rank of maternal education in the UK (3.6%) and similar to the overall prevalence of stunting in the UK (2.2%).

Forest plots demonstrate heterogeneity in the Slope Index of Inequality for various child growth outcomes between different settings.
Comparison with other studies
Since the publication of the WHO Growth Standard in 2006, numerous studies have compared the growth of children under 5 years of age to these standards. In general, studies in developing countries have reported a high prevalence of stunting16 and thinness/wasting,17 while studies in developed countries have reported a high prevalence of tall stature18 ,19 and obesity/overweight20 compared to the WHO Growth Standard. This has led to debate on whether the WHO Growth Standard is suitable for all countries; however, as it places the growth of healthy breastfed babies as the ‘norm’, it is recommended as the optimal growth pattern for health, and it also allows international comparisons to be made.1
We observed high prevalences of stunting and underweight in rural Chinese children. Even higher estimates were reported in a previous study by Wang et al21 among children <5 years old in 2006 from 50 counties of 13 mid-western provinces of China where the prevalence of stunting, underweight and wasting were 30.2%, 10.2% and 2.9%, respectively, and this could be due to secular changes resulting in improved nutrition. Other studies in China have also reported area-level variations in the prevalence of stunting.22 In contrast to rural China, the heights and weights of urban Chinese children have recently been reported to have reached or even surpassed the WHO Growth Standard23 ,24 with some evidence that prevalence of overweight is higher among children in higher-income families.25 In a study that tracked the temporal changes in prevalence of obesity among 7-year-old to 18-year-old children in different regions of China from 1995 to 2005, large disparities were found between regions. Although certain regions experienced a rapid increase in prevalence of childhood obesity, no increase was found in the developing rural areas.26 Hence, in countries like China undergoing a rapid economic and nutrition transition, policies to promote optimal childhood growth may have to differ between the affluent urban and poorer rural areas.
The social patterning of childhood obesity has been systematically reviewed recently.27 In developed countries, a number of studies report that childhood obesity is more prevalent in families of lower socioeconomic status,6 ,28 ,29 while in developing countries some studies have suggested the opposite associations.30 In the UK ALSPAC birth cohort study (born 1990–1991), socioeconomic differences in BMI began to emerge from the age of 4 years31; however, in a recent cohort of twins born in 2007, differences in weight gain were already apparent by age 3 months.32 In a study of 3-year-old to 4-year-old children from Scotland (UK), both undernutrition and obesity were associated with an area-based level of deprivation.33 Similarly, in Sweden, overweight and obesity in 4-year-olds have been related to living in a lower socioeconomic area.34 ,35 In a study of Hong Kong children aged 6–11 years born in 1997, there was no overall association between maternal education and BMI; rather, parental education was inversely associated with children's BMI in children of Hong Kong-born mothers, in contrast to a positive association in children of mainland China-born mothers.36
To our knowledge, our current study is the first to compare the association between maternal education and early growth outcomes in contemporary children from a range of different settings. While the types and prevalences of adverse growth outcomes differed widely across these settings, in all three populations higher maternal education was associated with more optimal child growth. In the UK and Sweden, where obesity and overweight prevalence are higher than underweight and stunting, more educated mothers are likely to give their children less energy-dense foods high in fat and sugar. In rural China where stunting and underweight are more common, more educated mothers are likely to feed their babies more nutritious food that protects them from these adverse growth outcomes.
Strengths and limitations
All three studies were based on large population-based samples. We standardised the maternal education exposure across the diverse settings by using the SII and RII. Child anthropometry was objectively measured, by trained staff, following standardised protocols in the UK and China and was reported by parents in the Swedish sample at or following clinic visits. In the Swedish sample, there was no relation between reporting error and mother's education. In the UK sample, we were able to adjust for ethnicity, and we expect ethnicity to be largely homogeneous in the other studies.
Our study has several limitations. We analysed observational associations between childhood growth and maternal education (adjusted for maternal age); hence, we cannot comment on causality or the mechanisms involved. Several related factors are also socially patterned (such as: parental body size, parental smoking, breastfeeding and other lifestyles); if these mediated the effects of maternal education, then adjusting for these factors would have attenuated the associations. We are therefore unable to infer any causal role of maternal education.
Similarly, we did not examine other SES exposures, such as income and occupation and the influence of paternal education, which could all influence childhood growth. One view is that SES differences are the results of factors that are largely financial37; however, cultural factors could also play an important role.36 In Europe and other developed countries, energy-dense foods are relatively cheaper compared to the more nutritious food like fruits and vegetables.38 ,39 In China, the situation seems different as a study by Shan et al23 found that, in Beijing, the consumption of soft drinks was low due to the high prices.
Conclusions and implications
The foundations for lifelong socioeconomic inequalities in health are laid in early life; hence, optimising the growth of children early on could help to reduce inequalities throughout the life course. Although the UN Millennium Development Goals set a target for universal education by 2015, this has not been achieved by many countries40 and is likely to lead to persistent health inequalities. We found that higher maternal education was associated with lower obesity and overweight in the UK and Sweden, and lower stunting and underweight in rural China. Depending on the setting, public health policies to monitor and promote healthy childhood growth and weight gain may need to have a differing emphasis on undernutrition and overnutrition, with timely review in settings of rapid transition. Developing countries, especially those going through a rapid economic transition, need more studies investigating lifestyle factors such as diet and physical activity/inactivity to understand the factors associated with these lifestyle changes and their impact on long-term health.
What is already known on this subject
-
Studies in developing countries have reported a high prevalence of stunting and thinness/wasting, while studies in developed countries have reported a high prevalence of tall stature and obesity/overweight compared to the WHO Growth Standard.
What this study adds
-
Higher maternal education was associated with more favourable growth patterns in young children: lower obesity and overweight in UK and Sweden, and lower stunting and underweight in rural China. Public health strategies to optimise growth in early childhood need to acknowledge socioeconomic factors, but possibly with a different emphasis in different settings.
Acknowledgments
We are grateful to all children and families participating in the MCS, ABIS and NCGSS studies and thank the Directors of all the studies. The Millennium Cohort Study is funded by grants to Professor Heather Joshi, Director, from the ESRC and a consortium of UK government funders. We are grateful to The Centre for Longitudinal Studies, Institute of Education for the use of these data and to the UK Data Archive and Economic and Social Data Service for making them available. We acknowledge the Chinese Association of Eugenic Science Project and Chinese Ministry of Health for providing the funding for the NCGSS study. ABIS has been funded by the Juvenile Diabetes Research Foundation, Swedish Child Diabetes Foundation (Barndiabetesfonden) and Research Council of Southeast Sweden. TS was funded by a grant from VINNOVA (Sweden). RL was funded by the National Prevention Research Initiative (Grant Ref: MR/J000361/1) and NIHR School for Public Health Research. None of the funders bears any responsibility for the analysis or interpretation of these data.
References
Supplementary materials
Supplementary Data
This web only file has been produced by the BMJ Publishing Group from an electronic file supplied by the author(s) and has not been edited for content.
Files in this Data Supplement:
- Data supplement 1 - Online supplement
Footnotes
RL, JZ and JDZ are the first authors.
-
Contributors RL wrote the first draft of the paper and obtained the UK Millennium Cohort Study (MCS) dataset. JDZ extracted and cleaned the China data; RL and KKO performed the analyses. JL is the founder and project leader of All Babies in South East Sweden Study (ABIS) and JZ is the founder and project leader of NCGSS, construct and systemize the China data. TS coordinated and compiled the data from Sweden and China and also wrote the paper. All authors contributed to the critical revision of the manuscript and approved the final version.
-
Competing interests None.
-
Ethics approval Ethics committees of respective countries.
-
Provenance and peer review Not commissioned; externally peer reviewed.
-
Correction notice This article has been corrected since it was published Online First. The Correspondence details have been amended to: “Dr Tanja Sobko, Division of Paediatrics, Department of Clinical Science, Intervention and Technology, Karolinska Institutet, Stockholm, Sweden; Division of Health Improvement, JC School of Public Health and Primary Care, Faculty of Medicine, Prince of Wales Hospital, The Chinese University of Hong Kong, Hong Kong; tanja.sobko@gmail.com”