Article Text

Abstract
Background Confounding of mediator–outcome associations resulting in collider biases causes systematic error when estimating direct and indirect effects. However, until recently little attention has been given to the impact of misclassification bias.
Objective To quantify the impact of non-differential and independent misclassification of a dichotomous exposure and a dichotomous mediator on three target parameters: the total effect of exposure on outcome; the direct effect (by conditioning on the mediator); and the indirect effect (identified by the percentage reduction in the excess OR on adjusting for the mediator).
Methods Simulations were conducted for varying strength of associations between exposure, mediator and outcome, varying ratios of exposed to unexposed and mediator present to mediator absent, and varying sensitivity and specificity of exposure and mediator classification.
Results ORs before (total effect) and after adjustment (direct effect) for the mediator are both biased towards the null by non-differential misclassification of the exposure, but the percentage reduction in the excess OR is little affected by misclassification of exposure. Conversely, misclassification of the mediator rapidly biases the percentage reduction of the excess OR (indirect effect) downwards.
Conclusions If the research objective is to quantify the proportion of the total association that is due to mediation (ie, indirect effect), then minimising non-differential misclassification bias of the mediator is more important than that for the exposure. Misclassification bias is an important source of error when estimating direct and indirect effects.
- Epidemiology
- Methodology
- Measurement
Statistics from Altmetric.com
Introduction
The aim of much epidemiological research is to identify cause and effect associations. Having identified a causal association, or perhaps to strengthen the case for a causal association, researchers often seek to determine what mediates the association between the exposure and outcome. For example, mediation of the association of socioeconomic position with mortality is a common focus of research.1–5 Such an analytical approach is known as process analysis,6 pathway or intermediary analysis,7 hierarchical analysis,8 and more recently as determining direct and indirect effects.9–11 A standard approach is to quantify the exposure–outcome (X–Y) measure of association (eg, OR) before and after adjusting for (or conditioning on) the mediating variable (Z).12 The association before adjustment is the total effect, and the X–Y association after adjustment is the ‘direct’ effect that is not mediated by Z. By extension, the ‘indirect’ effect is the effect of X on Y which is mediated though Z. There are a number of methods that are used to quantify the magnitude of the mediating pathway13 ,14; in this paper we focus on the proportion or percentage of the X–Y association ‘explained’ by adjustment for the mediator as is common practice in social epidemiology.13 ,15 ,16
Systematic error may bias the quantification of direct and indirect effects. The main methodological focus to date has been on sources of error arising from confounding (labelled C in figure 1) of the mediator (Z) to outcome (Y) association, such that when one conditions on the mediator Z, a collider bias occurs opening a backdoor pathway from X to Y through C as shown in figure 1B.9 ,17–20 While such a collider bias is plausible,9 ,10 for it to be of substantive impact all of the X–Z, C–Z and C–Y associations shown in figure 1 have to be strong and the confounding variable C needs to be neither rare nor ubiquitous in the source population.21 ,22 We have previously argued a decade ago that measurement error, as opposed to backdoor confounding induced by conditioning on a mediator that also happens to be a collider, is likely to be at least as important as a source of error in practice.21 Our argument was based on the mathematical parallel with confounder adjustment whereby non-differential measurement error of confounders rapidly attenuates adjustment, resulting in residual confounding23–26; we reasoned the same logic would apply to measurement error of the mediator. However, it is only recently that methodological work has more closely looked at this issue.27–30 This work confirms our previous suspicions: non-differential measurement error of the mediator causes an overestimate of the direct effect (eg, the OR after adjusting for the mediator), and therefore an underestimate of the ‘percentage explained’ that is often used in social epidemiology.
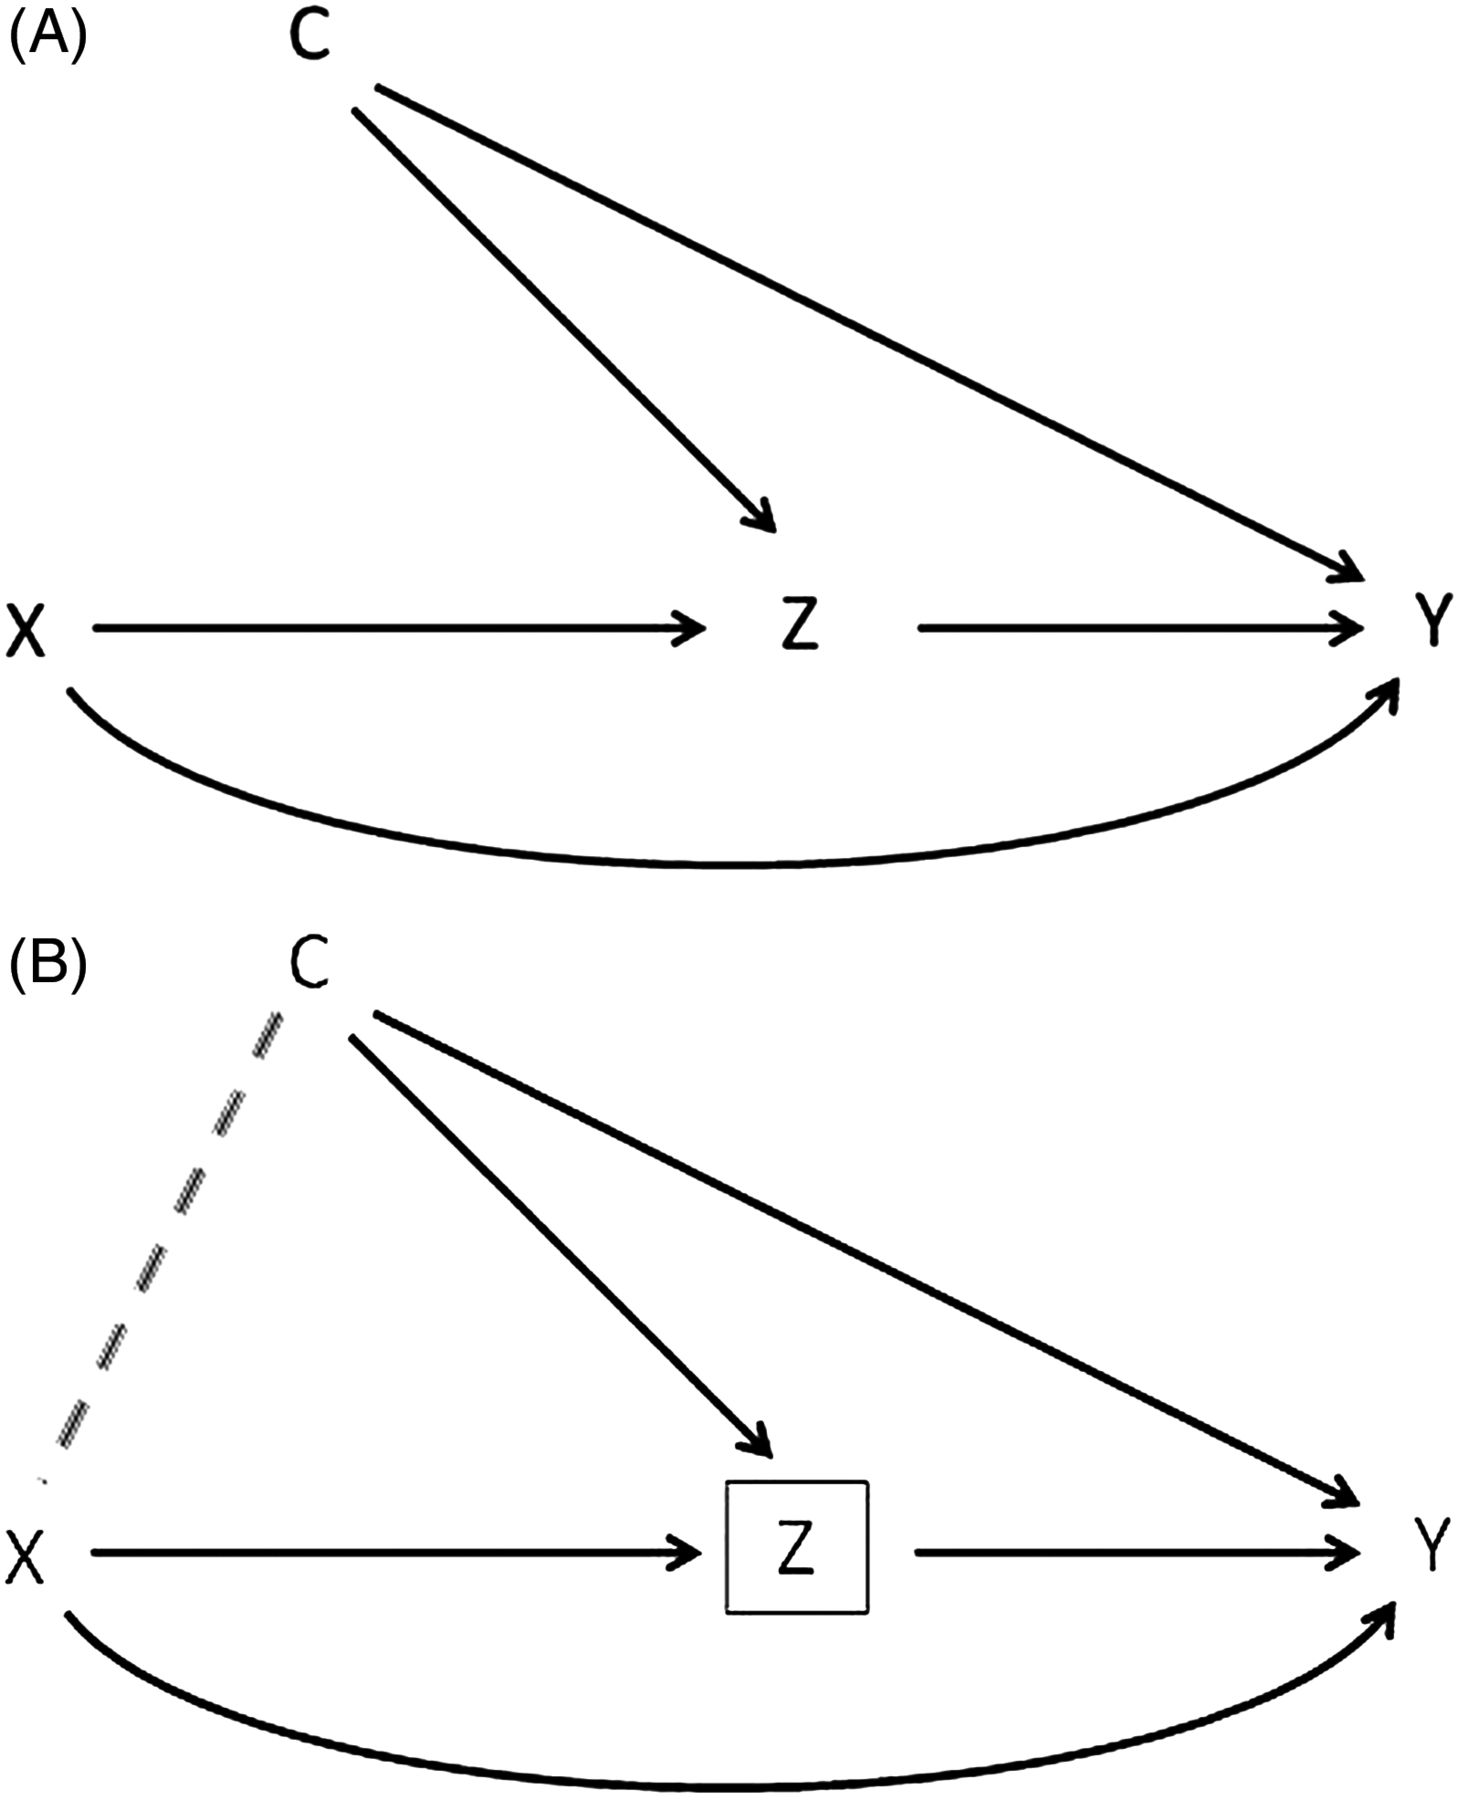
Directed acyclic graph of the associations between exposure (X), mediator (Z), outcome (Y) and confounder of the Z–Y association, demonstrating collider bias when conditioning on Z. (A) Before conditioning on Z. (B) After conditioning on Z.
In this paper, we present simulations about misclassification of a dichotomous mediator and exposure. (We use the term ‘(mis)classification’ for categorical variables, and the term ‘(mis)measurement’ more generally for both continuous and categorical variables.) While not presenting mathematical formulae for correction factors, our simulations examine the combined effects of misclassification of the exposure and mediator that (to our knowledge) has not previously been reported. We also emphasise the ‘percentage explained’ metric commonly used by applied epidemiologists such as those publishing in this journal. Recent methodological literature focuses on the impact of misclassification on the direct effect per se. Finally, we hope by presenting relatively simple simulations that our paper is accessible to a wider range of epidemiologists and public health researchers.
Motivating example, objective and general method
We have recently used cross-sectional data to analyse the association of childhood socioeconomic position (main exposure) with adult psychological distress (outcome), and attempted to determine the proportion of this association mediated by adult socioeconomic position.31 In this example, we had only one crude measure of childhood socioeconomic position (created from subjects’ recall of parental occupation), but multiple (potentially better) measures of adult socioeconomic position (ie, highest education, household income, labour market activity and area deprivation). The question then arises as to the relative impacts of misclassification of the exposure and mediator on the assessment of mediation in the analysis.
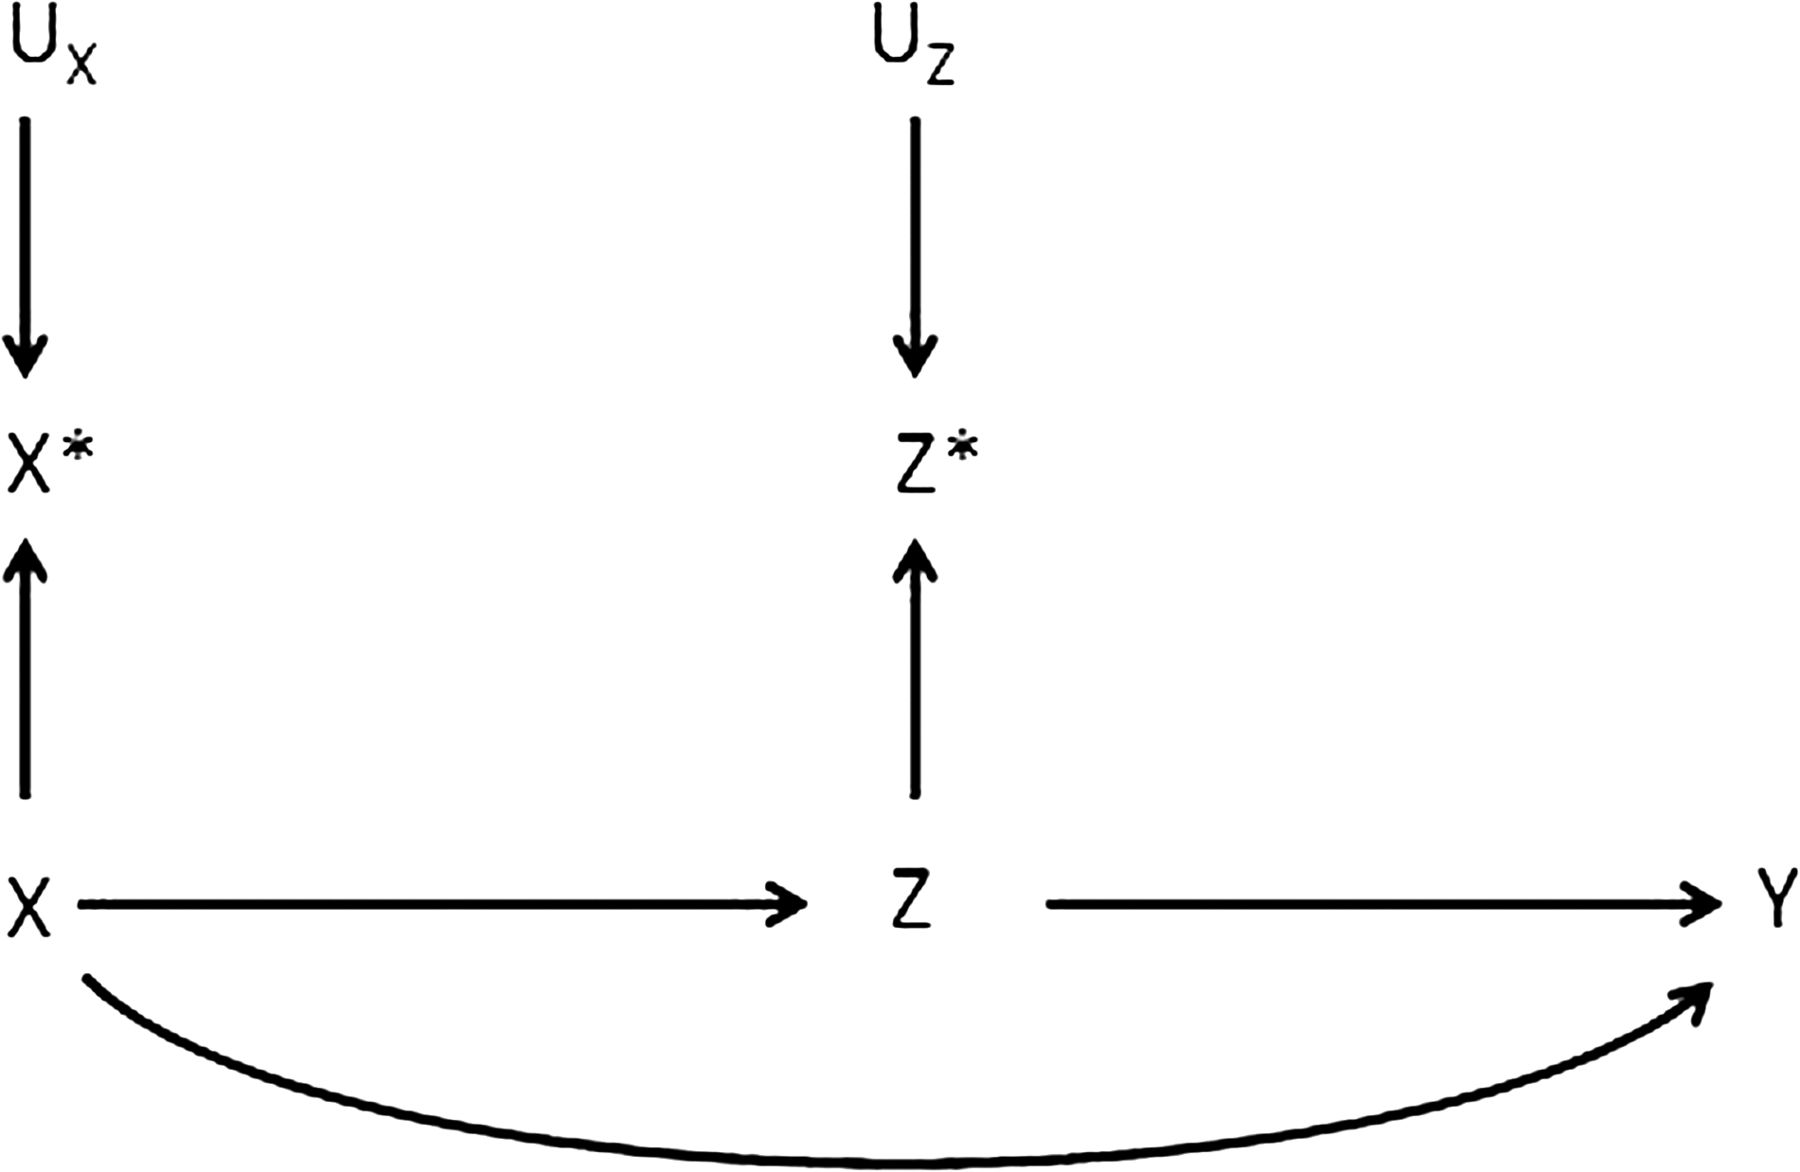
Figure 2 shows the causal structure with misclassification determinants UX and UZ, as well as true values of X and Z, determining the observed but misclassified exposure and mediator values, X* and Z*, respectively (and using the framework of Hernan and Cole,32 and as subsequently elaborated33). Using the example above, UZ would be the process of measuring adult socioeconomic position, such as using a single census question with bin categories for total household income as opposed to an ideal set of accurate income records. In this paper we use simulated data to assess the impact of non-differential and independent misclassification of a dichotomous exposure X and a dichotomous mediator Z, separately and simultaneously, when quantifying direct and indirect effects.

Directed acyclic graph of the casual associations in figure 1, additionally representing measurement error of exposure (X) and mediator (Z).
We focus on three ‘target parameters’: the OR of the exposure–outcome association before adjustment for the mediator (ORXY: the total effect); this OR after adjustment for the mediator (ORXY|Z: the direct effect); and the percentage reduction in this association after adjustment for the mediator (100%×(ORXY−ORXY|Z) / (ORXY−1): the indirect effect). With misclassification, these three parameters become: ORX*Y; ORX*Y|Z*; and (100%×(ORX*Y−ORX*Y|Z*) / (ORX*Y−1)). Space constraints in this paper mean we do not simulate misclassification of the outcome Y, differential misclassification between X and Z, nor dependent misclassification between X and Z.
We use bias analysis methods34 ,35 to estimate the observed joint distribution of exposure, mediator and outcome in the presence of varying sensitivity and specificity of exposure and mediator (mis)classification. The ratio of exposed to unexposed (ie, X1:X0), and mediator present to mediator absent (ie, Z1:Z0), also impacts on the final amount of bias. For example, for a fixed specificity of the exposure the number of false positives becomes large relative to true positives as the true prevalence of those exposed decreases, that is, the positive predictive value decreases with decreasing true prevalence. We use Mantel–Haenszel pooling across strata of Z to calculate ORX*Y|Z* (ie, the direct effect with misclassification).36 Workings and calculations were undertaken in Excel (a copy of the spreadsheet is available at http://www.uow.otago.ac.nz/sofiehealth-info.html).
We present our simulations in the following three sections: misclassification of mediator Z only; misclassification of exposure X only; and misclassification of both exposure and mediator. All simulated misclassification is assumed to be non-differential and independent.
Misclassification of mediator Z
We let ORXY|Z, ORXZ|Y and ORYZ|X have two possible values, 2 or 5, to approximate moderate and strong associations. (Selecting even stronger OR values (eg, 10) does not alter the general findings of this paper.) For example, in the case of ORXY|Z=2, and ORXZ|Y=ORYZ|X=5, this equates to a moderately strong association of X with Y having adjusted for mediator Z (ie, the ‘direct’ effect), and strong independent associations of the mediator Z with both X and Y. Given these parameters, the total effect of X on Y, ORXY, also depends on the ratio of Z1:Z0. In the case of ORXY|Z=2, and ORXZ|Y=ORYZ|X=5, the maximum value of ORXY is 3.6 (using the formula (R+1)2/4R times ORXY|Z (1.8×2), where R=ORXZ|Y=ORYZ|X),22 and occurs when the ratio of Z1:Z0 among the non-cases (ie, Y=0) is about 1:4.
To generate data for the simulations, in addition to setting the three ORs and the Z1:Z0 ratio, we also set three of the cells in the two by two table of X and Y given Z=1 at 100, as shown in table 1. The remaining cells can be solved given the above specifications. Thus, the ‘true’ data has ORXY=3.08, and both ORXY|Z = 0 and ORXY|Z = 1=2.00 (as set), meaning that 100%×(3.08−2.00) / (3.08−1)=52% of the X→Z association is mediated by Z.
Table 1 shows the data as observed (or ‘expected’) if the sensitivity and specificity of Z is 70%. No other misclassification bias is allowed, and thus counts are redistributed only between cells: a–e, b–f, c–g and d–h. For example, cell a in table 1 is given by the following maths using cells in table 1: Se×a+(1−Sp)×e=70%×100+30%×5.5=72. The observed crude ORXY accordingly remains unchanged, but the Z-stratum specific ORs are 2.60 and 3.52, or 2.89 pooled using Mantel–Haenszel pooling. (Misclassification bias is well known to spuriously generate heterogeneity of stratum specific measures of association23 (ie, 2.60 vs 3.52), but for this paper we focus on ORs pooled across strata.) Accordingly, with misclassification of Z the percentage mediation by Z is 100%×(3.08−2.89)/(3.08−1)=9%, considerably less than 52% in the absence of misclassification of Z.
Simulated expected data for ORXY|Z=2, ORXZ|Y=ORYZ|X=5, when the ratio of Z=1|Y=0 to Z=0|Y=0 equals 1
Table 1 shows the simulated findings for just one combination of parameter values. Table 2 shows the true ORXY, and true and observed percentage mediation by Z, for varying sensitivity (95% or 70%) and specificity (95% or 70%) of Z measurement, and varying ratios of Z1–Z0 among the controls (0.1, 1.0 and 10). The output for the example in table 1 is shaded grey in table 2. To simplify, we only present the results where ORXY|Z, ORXZ|Y , ORYZ|X are all 2 or 5, and when ORXZ|Y , ORYZ|X are both stronger or both weaker than ORXY|Z. (The full 96 possible simulations can be found in web annex table 1.) We also do not present ORXY|Z* but rather present the observed percentage mediation; the reader can back calculate ORXY|Z* from the true/observed ORXY and percentage mediation (ie, ORXY|Z*=1+((ORXY − 1)×(100%−(% med by Z))) or read them off figure 3 for selected scenarios (see below). Note that the observed ORXY does not differ from the true ORXY when only Z is misclassified, as there is as yet no conditioning on Z. The specific example outlined in table 1 of a true ORXY of 3.08, true mediation of 52% and observed mediation of 9%, is highlighted in the middle panel (where Z1 : Z0=1.0) of table 2 for the combination of 70% sensitivity and 70% specificity of Z.

Effect of mediator Z misclassification scenarios on: total and direct ORs; percentage of total effect explained by conditioning on mediator Z (Z1 : Z0 ratio among non-cases=1.0).
True ORXY, and true and observed percentage mediation of X→Y association by Z, for selected combinations of ORXY|Z, ORXZ|Y, ORYZ|X, varying ratio of Z1 to Z0 among non-cases (Y=0), and sensitivity (Se) and specificity (Sp) of Z measurement
Across all simulations of misclassification of Z shown in table 2, there is substantive underestimation of the percentage mediation. For the best combination of sensitivity and specificity (both 95%) where Z1 : Z0=0.1, the observed percentage mediation was underestimated by about a third across the various combinations of ORXY|Z, ORXZ|Y and ORYZ|X. For example, when all OR are 5 and Z1 : Z0=0.1 (ie, top right of table 2), the 32% observed mediation is nearly a third less than 46% even when the sensitivity and specificity are both 95%. When Z1 : Z0=1.0, the underestimate was approximately a fifth for both sensitivity and specificity of Z equal to 95%. When Z1 : Z0=10, the ORXY was very similar to the set ORXY|Z across all scenarios, and thus the true percentage mediation was always low. That said, the observed percentage mediation was underestimated by approximately half for the best combination of sensitivity and specificity (eg, 4% observed compared to 8% true for all OR=5, and sensitivity and specificity both 95%). When either or both the sensitivity and specificity of Z reduced to 70%, the percentage mediation was often underestimated by as much as 90%.
Figure 3 graphically shows the total and direct ORs (ie, after conditioning on Z) when Z1 : Z0=1 (ie, the middle panel of scenarios in table 2). The true total and direct effect ORs are shown as the black and white bars in each of the four groupings, with true percentage mediated being 19%, 52%, 12% and 38% from left to right. The remaining patterned bars are the direct effects (ORXY|Z*) for various combinations of sensitivity and specificity misclassification of Z. One can see that for worsening misclassification of Z, the ORXY|Z* gets progressively larger and closer to the total effect ORXY, meaning that the percentage mediation is progressively underestimated.
(Simulations for weaker associations (ie, ORs of 1.2 and 1.5) are shown in web annex table 4, and demonstrate qualitatively similar patterns to those shown above.)
Misclassification of exposure X
Consider the case of misclassification of X, but not Z. While the X1:X0 ratio among the non-cases does not alter the true ORXY, it does have a substantial impact on ORX*Y and some additional impact on ORX*Y|Z. Therefore, we vary ratios of X1 : X0 in our simulations. Table 3 shows an example of the calculations used in simulations, following a similar framework for the above Z misclassification analyses. Three cells in the ‘true’ data are set to 100, but one of the cells (e) must be among the Z=0 stratum to operationalise the X1 : X0 specification. Otherwise the calculation of solutions for other cell counts proceeds in a similar manner to table 1. For the example in table 3, ORX*Y=1.48 (compared to the true ORXY=2.89) and ORX*Y|Z=1.27 (compared to the true ORXY|Z=2.0), results in 45% of the X→Y association being due to mediation by Z. Despite the misclassification of X and the resulting biases in ORX*Y and ORX*Y|Z, there is little difference from the true percentage mediated of 47%. This is consistent with non-differential independent misclassification of X not being as important as misclassification of Z if the target parameter is the percentage of the excess OR due to mediation by Z.Table 4 presents summary output for multiple simulations for varying combinations of ORs, sensitivity and specificity (95% or 70%) of X (mis)classification, and the ratio of X1 : X0 among the non-cases (1.0, 0.1 and 0.01). The output for the example in table 3 is shaded grey in table 4. Whereas it made little sense to consider very low or very high prevalence of Z above, exposures are often uncommon—hence the X1 : X0=0.01 (ie, a prevalence of exposure among non-cases of just under 1%). A fuller tabulation of simulations is presented in web annex table 2, including a higher specificity of 99% for X, as in the context of an uncommon exposure (ie, X1 : X0=0.01) one would probably select/set a higher specificity to prevent the true exposed being overwhelmed by the false positive exposed.
Simulated expected data for ORXY|Z=2, ORXZ|Y=ORYZ|X=5, when the ratio of X=1|Y=0 to X=0|Y=0 equals 1
True ORXY and observed ORX*Y, and true and observed percentage mediation of X→Y association by Z, for selected combinations of ORXY|Z, ORXZ|Y, ORYZ|X, varying ratio of X1 to X0 among non-cases (Y=0), and sensitivity (Se) and specificity (Sp) of X measurement
To aid interpretation, the target parameter of ‘percentage mediation’ in table 4 is underlined when it is more than five percentage points less than the true percentage mediation. Using this threshold, no errors of greater than five percentage points occurred for any simulations when the X1 : X0 ratio was 1.0, and only for some simulations when the X1 : X0 ratio was 0.1 (only when specificity of X was 70%). When the X1 : X0 ratio dropped to 0.01 (ie, an uncommon exposure with 1% prevalence), many more simulations had greater than a five percentage point error. However, it should be noted that when more than a five percentage point error in the percentage mediated occurred, it occurred in concert with large downward bias in the ORX*Y that may render the study ‘unacceptable’ even before undertaking an analysis of direct and indirect effects. Thus, ensuring a high specificity for the classification of an uncommon exposure is important to prevent bias in both overall and mediation analyses. That said, in most instances when ORX*Y was underestimated, so too was ORX*Y|Z in a commensurate manner such that little or no bias resulted in the percentage mediation explained. (Simulations of exposure misclassification for weaker associations (see web annex table 5) also demonstrate little impact on the percentage mediation.)
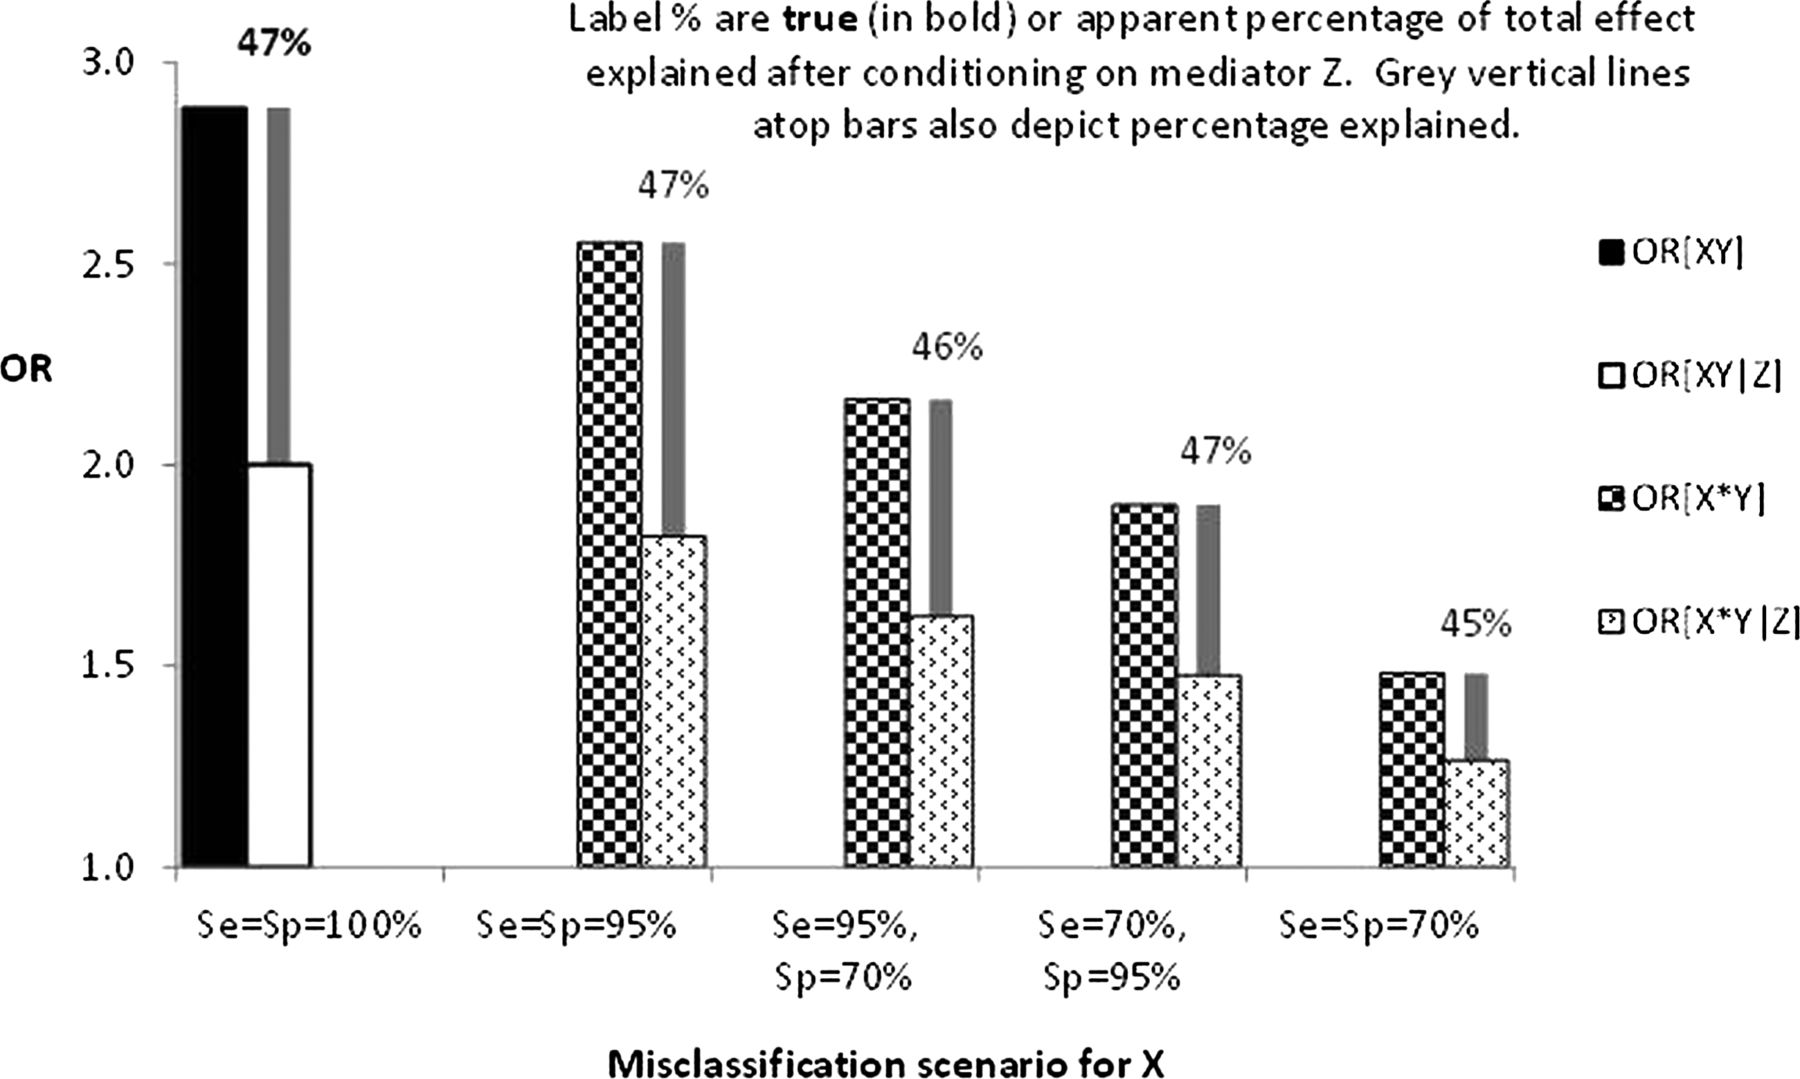
Figure 4 graphically shows the total and direct ORs for the same exposure misclassification scenario as the top panel of results in table 4. One can see that worsening misclassification of X biases both the total and direct effects (ie, ORX*Y and ORX*Y|Z) towards the null to a commensurate degree, such that no or little bias results in the estimated percentage mediation.
Effect of exposure X misclassification scenarios on: total and direct ORs; percentage of total effect explained by conditioning on mediator Z (ORXY|CZ = 2, ORXZ|CY = ORYZ|CX = 5, (X1 : X0|Y = 0) = 1.0).
To summarise thus far, misclassification bias of the mediator alone results in substantial underestimation of the percentage mediated. Misclassification bias of the exposure alone (as is well known) causes substantial underestimation of ORX*Y, and in parallel a substantial underestimation of ORX*Y|Z. However, the observed percentage mediated (in expectation at least) is only modestly underestimated when the X1 : X0 ratio is 1.0 or 0.1, but becomes more notably biased when the X1 : X0=0.01.
Misclassification of both exposure X and mediator Z
Table 5 presents selected results for misclassification bias of both X and Z. Only options where the sensitivity and specificity of X or Z are equivalent are presented (ie, both 70% or both 95%). Scenarios about the X1 : X0 ratio are specified, but not about Z. A fuller range of simulations are included in web annex table 3, including those with a 99% specificity of X.
All instances in table 5 where sensitivity and specificity of Z are 70% result in severe underestimation of the percentage mediation. When both the sensitivity and specificity of Z are 95%, the underestimation of the percentage mediation by Z is more severe than with just misclassification of Z (table 2) or just misclassification of X (table 4). For example, when all ORs were 5, and the ratio of X1:X0 among the controls was 1.0, the true percentage mediation by Z was 36%, and the observed mediation was 25% and 22% for sensitivity/specificity of X of 95%/95% and 70%/70%. Comparing these observed percentage mediation estimates with the comparable ones from table 4 for misclassification of X (36% and 32%, respectively), they are further underestimated by over a third. This underestimate by over a third is comparable to that occurring in table 2 for the same combination of ORs, both sensitivity and specificity of Z of 95%, and Z1:Z0 ratio of 0.1 (actually=0.11 for scenario in table 5), namely an observed percentage mediation of 32% compared to a true percentage mediation of 46%. That is, the underestimation bias of the parameter ‘percentage explained by Z’ for both misclassification of X and Z is roughly the sum of the separate impacts of misclassification of X and Z.
True ORXY and observed ORX*Y, and true and observed percentage mediation of X→Y association by Z, for selected combinations of ORXY|Z, ORXZ|Y, ORYZ|X, varying ratio of X1:X0 among non-cases (Y=0), and sensitivity (Se) and specificity (Sp) of both X and Z
Discussion
Assuming non-differential and independent errors of the exposure and mediator, these simulations suggest that the indirect effect or estimated percentage of the total exposure–outcome association that is due to mediation by Z will be systematically and substantially underestimated by misclassification of Z (consistent with other recent methodological work29), but less so by misclassification of the exposure. The magnitude of the bias depends on the ratios of exposed to unexposed, and the ratio of mediator present to mediator absent. Misclassification of both exposure and mediator causes an underestimation of the ‘percentage explained’ parameter that is, roughly, equivalent to the sum of the separate biases.
The majority of the methodological examination of systematic error in the estimation of direct and indirect effects within epidemiology has focused on collider bias when conditioning on Z, due to uncontrolled confounding of the Z→Y association. This is shown by ‘C’ in figure 1. Using formulae derived by Greenland,22 if each of the independent ORs for X→Z, C→Z and C→Y were 2.0, the maximum (given ‘worst’ possible combination of prevalences of Z and C) downward bias in the direct effect (ie, ORXY|Z as compared to the true ORXY|CZ) is only 2%. This maximum downward bias increases to 20% if each of the independent ORs were 5.0 (or about 17% if the prevalence of Z and C were both 50%). If we apply this collider bias to our scenarios, assuming the ratio of Z1:Z0 is 1 (ie, equivalent to a 50% prevalence of Z; middle panel of table 2) and a prevalence of C of 50%, then the apparent percentage mediation will be overestimated as shown in table 6. It is only when there is strong confounding by C of the ZY association (eg, both ORCZ|XY=ORCY|XZ=5) that the collider bias becomes substantive,21 ,22 and of an equivalent magnitude to that for misclassification bias in our simulations. However: (1) collider bias may not be predictable in its direction of bias (whereas non-differential and independent misclassification bias may be more predictable in its direction); and (2) the total impact of collider bias will increase if there are many collider pathways opened by conditioning on Z (ie, C1, C2, C3, … could be added to figure 1, and if they are all on separate back door or confounding paths then the cumulative effect of opening all these collider paths may be substantive). Thus, both collider bias and misclassification of the mediator are important potential sources of error in mediation analysis.
Observed direct effect and percentage mediation in the presence of collider bias by C (as shown in figure 1) but no misclassification bias, for ratio of Z1 to Z0 among controls (Y=0) equal to 1 and prevalence of U=50%
The existing body of work on measurement error of confounders and its impact on observed exposure–outcome associations24 ,25 ,37 ,38 is directly applicable from a mathematical viewpoint—one just shifts from conceptualising Z as a confounder to conceptualising Z as a mediator. The methods presented here facilitate an intuitive shift in interpretation from confounding to mediation of direct and indirect effects: residual (or unmeasured) confounding now equates to residual (or unmeasured) mediation; the crude (confounded) measure of association now equates to the total effect; the adjusted measure of association now equates to the direct effect; and the percentage reduction from the crude to adjusted measure of association now equates to the percentage mediation.
An example of the applicability of the methodological work on measurement error of confounders to measurement error of mediators is one finding of Fewell et al.37 They found that ‘residual confounding’ by multiple mismeasured or unmeasured confounders is less problematic when the confounders are all correlated—adjusting for two of four such correlated confounders ‘captured’ most of the confounding. Going back to our motivating example (ie, adult socioeconomic position as a potential mediator of the association of childhood socioeconomic position with adult psychological distress31), we know that varying measures of adult socioeconomic position (such as income, education and asset wealth) are all correlated. Therefore, including a couple of such measures of socioeconomic position that are well measured, or a handful of such socioeconomic factors that are moderately mismeasured, should ‘capture’ most of the percentage mediation (again, assuming independent and non-differential measurement errors). Including multiple measures of the mediating variable or construct, ceteris paribus, will be a better strategy for fully capturing percentage mediation than including only one mismeasured proxy of the mediator.
In this paper we focus on the percentage of the excess OR explained by adjusting for the mediator, a common practice in social epidemiological studies where the goal is to explain causal pathways from social position to health outcomes. Hafeman and Schwartz11 have connected this ‘explanation’ agenda with recent methodological work on direct and indirect effects. Briefly, a key distinction in the estimation of direct and indirect effects is between a focus on controlled effects (by setting the value of the mediator) and natural effects (by allowing the mediator to vary ‘naturally’ with exposure).39 Hafeman and Schwartz11 argue that natural effects are most appropriate for an ‘explanation’ agenda that is implicit in our paper. More specifically, Hafeman and Schwartz's second motivation for undertaking mediation analysis, to ‘test a pathway specific hypothesis’,11 matches our motivating example. Thus, using their framework, it is the ‘total indirect effect’ (TIE; the effect of exposure that would be prevented if the exposure did not cause the mediator) that is of interest to us. Accordingly, we also calculated TIEs and compared them to the total risk difference (RD) for the above simulations (ie, P(Y=1|X=1)−P(Y=1|X=0); workings available in spreadsheets). Given that our simulations forced OR homogeneity, there was (mathematically necessary) heterogeneity of the RD for the XY association across strata of Z. (It is mathematically impossible to specify RD homogeneity for all three of RDXY|Z, RDXZ|Y and RDZY|X using a framework similar to that used above.) Nevertheless, examining the TIEs using RDs within the framework of Schwartz and Hafeman gave a qualitatively similar conclusion to our OR simulations: for mediator misclassification the TIE was underestimated (often grossly), and therefore the TIE as a percentage of the total RD was underestimated; for exposure misclassification, both the TIE and total RD were underestimated, but the TIE as a percentage was (usually) little affected.
A potential concern with our simulations is non-collapsibility of the OR.36 For strong effects and large differences in the proportion of exposed across strata of a third variable, one may see a lower crude OR than by stratum of the third variable in the absence of any confounding. Such a concern may extend to when there is an absence of mediation. While noting scale dependency (homogeneity of the three ORs in our simulations), we do note that before modelling any misclassification, if we set either ORXZ|Y or ORZY|X to 1 then there was perfect collapsibility of ORXY (ie, ORXY|Z = 0=ORXY|Z = 0=ORXY). Also, the above alternative examination using the TIEs provides further reassurance that our key findings are not distorted by non-collapsibility. Nevertheless, this might be a worthwhile area of further methodological research.
Conclusion
Accurate classification of the mediator is essential and more important than accurate classification of the exposure when the goal is to estimate the percentage of the total X–Y association mediated by Z. However, accurate classification of the exposure is also still highly desirable for the following reasons. It gives an observed total effect (ORX*Y) that is both more accurate, and is far enough away from the null to allow statistically stable estimates of the percentage mediation to be calculated. Accurate classification of the exposure also guards against substantial differential or dependent misclassification of the exposure, which will alter the conclusions that apply above for non-differential and independent errors. Finally, accurate exposure assessment combined with accurate mediator assessment will usually result in more accurate estimation of the direct effect (ie, ORXY|Z).
The accurate estimation of percentage mediation will require attention to study design to minimise misclassification of the mediator. Additionally, it is possible to use quantitative bias analyses methods,28 ,29 ,34 ,35 whereby one posits plausible ranges of misclassification of the mediator and exposure and then calculates corrected total, direct and indirect effects. Such quantitative bias analyses could also simultaneously model both collider and misclassification bias.
What this study adds
-
Determining direct and indirect effects, or the proportion of and exposure–outcome association explained by a mediating variable, is a common analysis in epidemiology.
-
Confounding and collider bias as sources of error in determining direct and indirect effects have been understood for at least a decade, but only recently has there been serious methodological scrutiny of misclassification bias.
-
For the target parameter of ‘proportion of the exposure–mediator association explained by the mediator’, we find using simulations about non-differential and independent misclassification of both a dichotomous exposure and mediator that misclassification of the mediator is a far more important source of error than misclassification of the exposure.
Acknowledgments
Comments were received on drafts of this paper from John Lynch, Diana Sarfati, Neil Pearce, Jennie Connor and Ana Diez-Roux.
References
Supplementary materials
Supplementary Data
This web only file has been produced by the BMJ Publishing Group from an electronic file supplied by the author(s) and has not been edited for content.
Files in this Data Supplement:
- Data supplement 1 - Online tables
Footnotes
Contributors TB initiated the paper, led all simulations, and led drafting of the paper. SM assisted with simulations and contributed to drafting. KC contributed to drafting.
Funding This work was supported by Health Research Council of New Zealand grant number 08/048. All authors receive funding for the Health Research Council of New Zealand (10/248, 08/048, 06/256).
Competing interests None.
Provenance and peer review Not commissioned; externally peer reviewed.
Data sharing statement Simulations (in Excel spreadsheets) are available from the authors on request.