Article Text

Abstract
Background Socio-economic disparities in nutrition are well documented. This study tested the hypothesis that socio-economic differences in nutrient intakes can be accounted for, in part, by diet cost.
Methods A representative sample of 1295 adults in King County (WA) was surveyed in 2008–2009, and usual dietary intakes were assessed based on a food-frequency questionnaire. The monetary value of individual diets was estimated using local retail supermarket prices for 384 foods. Nutrients of concern as identified by the 2005 Dietary Guidelines Advisory Committee were fibre, vitamins A, C and E, calcium, magnesium and potassium. A nutrient density score based on all seven nutrients was another dependent measure. General linear models and linear regressions were used to examine associations among education and income, nutrient density measure and diet cost. Analyses were conducted in 2009–2010.
Results Controlling for energy and other covariates, higher-cost diets were significantly higher in all seven nutrients and in overall nutrient density. Higher education and income were positively and significantly associated with the nutrient density measure, but these effects were greatly attenuated with the inclusion of the cost variable in the model.
Conclusions Socio-economic differences in nutrient intake can be substantially explained by the monetary cost of the diet. The higher cost of more nutritious diets may contribute to socio-economic disparities in health and should be taken into account in the formulation of nutrition and public health policy.
- Food prices
- diet cost
- nutrient density
- diet quality
- inequalities
- economics
- nutrition
- public health epidemiology
- social inequalities
Statistics from Altmetric.com
- Food prices
- diet cost
- nutrient density
- diet quality
- inequalities
- economics
- nutrition
- public health epidemiology
- social inequalities
Introduction
Socio-economic disparities in health are well documented.1 2 Studies have shown consistent associations between low education and income levels and higher rates of obesity, type II diabetes and coronary heart disease.2 3 These health inequalities may be explained, in part, by differences in lifestyle habits and in the nutritional quality of the diet.4 5 In several studies, higher socio-economic position (SEP) was associated with a higher consumption of fruits and vegetables6–10 and whole grains,10 and higher intakes of micronutrients10 11 and dietary fibre.10 11 In a multiyear, nationally representative sample of adults in the USA, higher education and incomes were associated with diets that were lower in energy density with higher in vitamin A, calcium and potassium.7
Vitamin A, calcium and potassium were among seven nutrients of public health concern identified by the 2005 Dietary Guidelines Advisory Committee. Along with vitamins C and E, magnesium and fibre, these nutrients were each linked to indicators of nutrient adequacy or disease prevalence and were consumed in inadequate amounts by the general public.12 The 2005 Dietary Guidelines Advisory Committee Report recommended efforts to increase intakes of these nutrients, emphasising the importance of obtaining nutrients from foods rather than supplements. However, the Dietary Guidelines Advisory Committee also recognised that a number of factors, including economic constraints, might limit access to the best food sources of these nutrients, such as fruits and vegetables.12
Understanding individual and community level barriers to adopting healthy diets is essential to reducing socio-economic disparities in diet quality.13–15 Poverty has been associated with greater distances to supermarkets and other food outlets that offer nutritious foods.14 16 17 Within the supermarket, the lack of money may impose further barriers. Studies have shown that nutrient rich foods cost more per calorie than do energy dense foods of minimal nutritional value.18 Furthermore, the relative prices of healthy foods, notably vegetables and fruit, have increased to a greater extent over time than prices for refined grains, added sugars and fats.19 20
If the relatively high cost of nutritious foods contributes to observed socio-economic disparities in nutrition, then the associations of SEP with dietary nutrient intake would be attenuated once diet costs are taken into account. The present focus was socio-economic differences in the intake of seven nutrients of concern in the American diet and the importance of the monetary value of food in explaining these differences.
Methods
Participant sample
Analyses were based on data from the Seattle Obesity Study, a population-based study of food access, diet quality and health among adults in King County, WA, USA. The sampling and survey methods were similar to those used in the Behavioural Risk Factor Surveillance System for WA state. Telephone survey respondents were contacted using a sampling scheme stratified by income range and race/ethnicity. Sampling was geographically based among five strata defined in terms of household income and percentage African–American and Hispanic. Strata with a lower income and higher proportion of African–Americans and Hispanics were oversampled. Randomly selected telephone numbers were matched with household addresses using commercial databases. Once a household was contacted, an adult (>18 years) member of the household was randomly selected to be the survey respondent. A 20 min telephone survey was administered by trained and computer-assisted interviewers to respondents. The Seattle Obesity Study sample of 2001 adults was demographically comparable with the 2007 Behavioural Risk Factor Surveillance System data for King County and was representative of the county population as compared with data from the 2000 US Census. Like the nationwide Behavioural Risk Factor Surveillance System sample, the present sample was disproportionately composed of women (1235/2001, 61.7%).
Of the 2001 men and women who completed the telephone survey, 1909 were sent FFQs. Of these, 1318 completed the FFQs, a response rate of 69.2%. Twenty-three completed FFQs were excluded based on extreme energy intakes (<2.1 MJ/day, >20.9 MJ/day) leaving a final analytical sample of 1295 (825 women and 470 men). Those who completed the study received remuneration for their participation. All recruitment and study procedures were approved by the Human Subjects Division, the institutional review board for the University of Washington.
Demographic and socio-economic measures
Self reported data on gender, age, race/ethnicity and household size were obtained during the telephone interview. Race was recoded into four categories (white, black, Asian and all others) for analysis. The highest level of education attained was grouped into three strata (see Results), and household incomes, reported in 12 categories (<$15 000 to >$175 000), were regrouped into five strata (see Results). Strata were selected prior to analyses to have a substantial spread in the variables of interest (education and income) and still provide a sufficient sample size within each stratum. Household size was a continuous variable and included all adults and children residing in the respondent's household.
Dietary intake assessment
The food-frequency questionnaire (FFQ) used in this study has been used previously in a number of large studies of population health and disease risk.21–24 Participants recorded the frequency of consumption of 152 line-item foods and beverages and indicated portion size. Respondents returned the completed FFQs to the investigators by mail. The completed FFQs were reviewed, checked for errors and processed using the nutrient database at the Nutrition Coordinating Center at the University of Minnesota.23 Nutrient composition analyses of dietary intake data yielded dietary energy (MJ, kcal), the weight of foods, beverages and drinking-water (g), and the estimated daily intakes of over 45 macro- and micronutrients. The energy density and nutrient content of the diet were estimated based on all foods and beverages, caloric and non-caloric, but excluding drinking-water. Aside from analyses of vitamins A, C and E, calcium, magnesium, potassium and fibre, a nutrient density variable based on these seven nutrients was computed. The nutrient density was defined as the mean percentage daily value for all seven nutrients in 8.4 MJ (2000 kcal) of dietary energy. The following formula was used to compute this variable:
Ratioi is the intake of nutrient i adjusted for 8.4 MJ of dietary energy divided by the daily value for that nutrient (DVi), based on 8.4 MJ (see table 2 for DVs).25
Monetary value of diets
The monetary value of the reported diets was estimated by attaching a food price vector to the nutrient composition database as described previously.26 27 Retail prices for each of the 384 component food items in the FFQ were obtained using standardised and published price collection methods.19 The prices were collected from three supermarket chains in Seattle contemporaneously with the dietary survey. All food prices were adjusted for preparation and waste using a standard USDA reference,28 and were expressed in dollars per 100 g, edible portion. The variable associated with each individual's diet was the monetary value per day ($/d).
Statistical analysis
Descriptive statistics were used to characterise the energy and nutrient characteristics of dietary intakes among demographic strata. General linear models (GLM) were used to provide covariate-adjusted means of nutrient intakes among strata of diet cost. Covariates in these models were dietary energy and the respondent's age and gender. GLM was also used to provide covariate-adjusted means of diet cost and nutrient intakes among strata of educational attainment and household income. Covariates for these analyses were dietary energy, age, gender and race. Analyses of income also adjusted for household size. In the analyses of nutrient intakes, these covariates were included in one model. A second GLM also included the diet cost variable as a continuous covariate. A comparison of models with and without diet cost adjustment provided evidence regarding the role of this variable in mediating socio-economic differences in nutrient intake. All analyses were conducted using SPSS 18.0 for Mac (IBM).
Results
The mean age was 56.8 years for women and 56.5 years for men. Eighty-five per cent of men and women identified themselves as white. The rest were Asian (7.2% of women, 6.7% of men) and black (4.5% of women, 4.3% of men). All other races made up 1.4% of the sample. Most women and men had completed a bachelor's degree or higher (56.5 and 58.4%, respectively). Household incomes corresponded to the median incomes of King County (62.3% reported incomes above $50 000/year). Demographic and socio-economic characteristics data are summarised in table 1.
Demographic and socio-economic characteristics of sample
Crude means and standard errors of dietary attributes by gender
Energy and nutrient intakes
The mean intakes of dietary energy and seven nutrient of concern are summarised in table 2. Women consumed fewer calories than men, 7.1 MJ/day (1700 kcal) versus 8.3 MJ/day (1982 kcal). Men generally had higher crude nutrient intakes, but, with the exception of vitamin C, intakes for both men and women fell short of the daily values for a 8.4 MJ diet. Gender-specific means of a nutrient density variable were computed to summarise the average attainment of recommended intakes for all seven nutrients. Although men had higher crude intakes for most of the individual nutrients, women had more nutrient-dense diets overall than did men. Table 2 also shows the estimated mean monetary diet cost ($/day) for women and men. The monetary value of the diet was higher for men than for women, corresponding in part to the higher quantity of food consumed.
Nutrient intakes and monetary value of the diet
Table 3 shows the covariate-adjusted mean and 95% CIs for nutrient levels across the quintiles of diet cost. Nutrient levels were adjusted for dietary energy and respondents' age and gender. Diets in the top quintile of diet cost were higher in all seven nutrients. This relation was significant for all seven nutrients tested and for the composite measure of nutrient density
Adjusted means and 95% CIs of nutrient intakes by quintile of diet cost: all subjects (n=1295)
Socio-economic position, dietary nutrient density and monetary value
The relations of diet cost with indicators of SEP were explored using GLM to control for total energy intake and other covariates. Figure 1 shows the association between diet cost and education (a) and income (b). The mean diet cost was higher in persons with higher educational attainment and higher household income. Persons with the lowest educational attainment had a mean diet cost that was $1.09/day lower than that of persons in the highest group ($8.19 vs $9.28, p trend <0.001). Differences in diet cost were slightly larger across household income groups. The mean diet cost of the lowest income group was $1.37 lower than the diet cost in the highest income group ($8.36 vs $9.73, p trend <0.001).
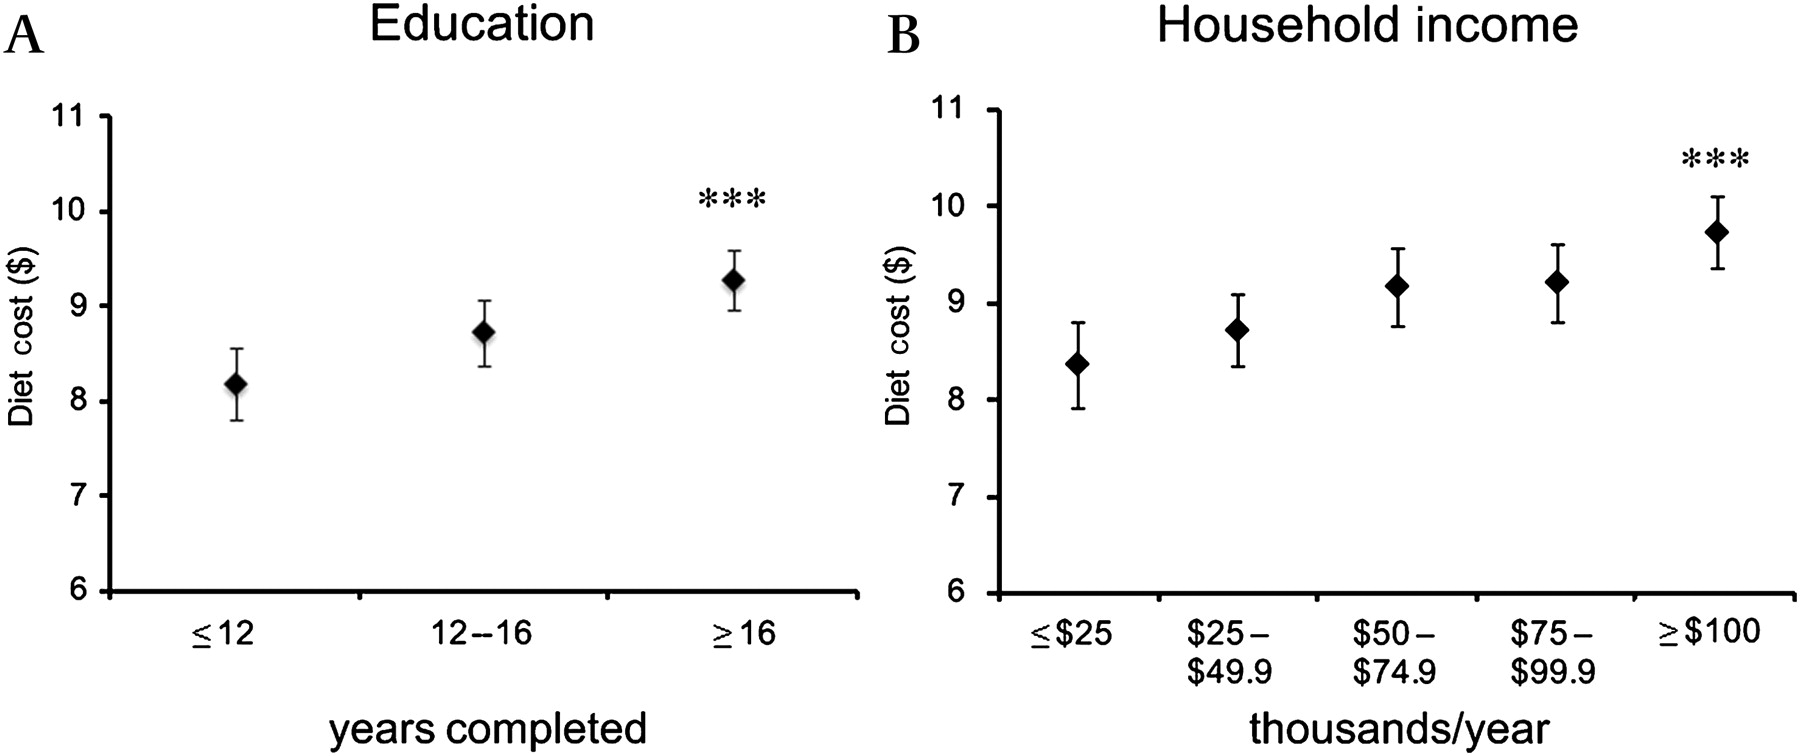
Covariate-adjusted mean and 95% CIs of diet cost in $/day among persons of different educational attainment (A) and household income (B). For both analyses, means were adjusted for dietary energy and respondent's age, gender and race. For the analysis of household income, means are also adjusted for household size. Asterisks indicate a significant test for linear trend across groups (p<0.001).
The hypothesis that diet cost could explain some of the observed socio-economic gradients in dietary nutrient density was evaluated using GLM. Figure 2 shows the covariate-adjusted means in dietary nutrient density among levels of education (a) and household income (b). Data points in black indicate nutrient density of diets adjusted for dietary energy intake, age, gender and other covariates. Persons with the highest educational attainment reported diets that were 11.5 percentage points higher in nutrient density than diets reported by the lowest group (mean of 95.7 vs 84.2%, p trend <0.001). Differences by household income also were evident. Persons in the highest income group had diets that were 9.3 points higher in nutrient density than the diets of those in the lowest group (96.6 vs 87.3%, p trend=0.003). Introducing the diet cost variable into the models reduced these differences for both SEP variables (grey data points). The difference in dietary nutrient density between highest and lowest education levels was 5.3 percentage points (94.3 vs 89.0%, p trend=0.012). Adjusting for diet cost attenuated the income trend more strongly. The difference between highest and lowest income groups was 1.4 percentage points (93.0 vs 91.6%, p trend=0.618).

Covariate-adjusted mean and 95% CIs of nutrient density of dietary intakes among persons of different educational attainment (A) and household income (B). Means were adjusted for dietary energy and respondent's age, race, gender and household size. Nutrient density is the mean percentage daily value (DV) for seven nutrients: vitamins A, C and E, calcium, magnesium, potassium and fibre. Shown are means adjusted for standard covariates (black points) and means adjusted for standard covariates and diet cost (grey points). Significance for linear trend across groups is indicated by ***p<0.001; **p=0.003; *p=0.012.
Discussion
Socio-economic disparities in health have an established dietary component.4 29 Moreover, diet quality, whether defined by nutrient intake or particular patterns of food consumption, has been shown to follow socio-economic gradients.7 30 31 The present findings indicate that such gradients can be substantially explained by diet cost, defined here as the monetary value of the diet.
Despite a long-term concern over social disparities in nutrition and health, studies on the relation between diet quality and cost are still outside the mainstream research in public health nutrition. A lack of available data has been a barrier to this line of research. On one hand, labour and agricultural economists have studied food prices and food expenditures, typically collecting data at the household level.32 33 On the other hand, public health researchers have collected data on diet quality and health outcomes at the individual level. Whereas economists lack data on foods consumed, nutrition scientists lack information on the monetary cost of foods consumed.
Without data on food expenditures, nutrition scientists have estimated dietary cost by applying retail food prices to diet records, diet history questionnaires and FFQs. Studies from Japan34 35 and Europe36–39 have shown that higher-cost diets are higher in nutritional quality34 36 38 39 and are associated with a lower body mass index.34 36 40 Fewer studies have examined food prices and diet cost in the context of socio-economic disparities in nutrition.
For persons with a low income or low level of educational attainment, food prices and limited budgets can constrain the purchase and consumption of nutritious foods.9 41–43 Those observations, together with the findings reported here, lead to the suggestion that diet cost is a mediating variable between SEP and diet quality. A mediating variable, by definition, explains at least some of the observed association between an exposure (eg, indicators of SEP) and an outcome (eg, nutrient density of the diet),44 and, when controlled for statistically through adjustment (shown in figure 2), biases the main exposure–outcome association towards the null.45
Limitations
Several design and methodological factors limited this study. First, the major purpose of this study was to explore diet cost as part of a causal pathway to diet quality. However, conclusions of causality or determinants of health behaviours are limited in cross-sectional studies.44 Second, while the present sample of adults was representative of King County, Washington, USA, it was not representative of the USA population overall. The sample was mostly white and non-Hispanic, more highly educated and with higher household incomes than the USA population generally. Third, nutrient and monetary estimates were derived from an FFQ, an instrument that is subject to known biases,46–48 and monetary estimates were limited by the validity of the prices that were used in the database. As described previously,19 27 the database was composed of 384 retail prices from three local supermarket chains in the Seattle metropolitan area.
While these food prices may not have reflected those actually paid by respondents in this study, 65% of respondents did shop at the three supermarket chains as their primary or secondary food source. It should also be noted that convenience stores, corner stores and other specialty stores, which may have had higher food prices,49 50 were not a major source of food in the present sample. Most respondents (93%) reported shopping at large supermarket and grocery store chains as their primary and/or secondary food sources. Nevertheless, the cost variable used in the present study should be viewed not as an estimate of food expenditure but rather as an estimate of the intrinsic monetary value of the diet, based on retail food prices.
Conclusions
If socio-economic differences in diet quality and nutrient intake are related to the cost of food, then food prices should be viewed as a critical component of the greater economic environment, which is a recognised determinant of health.51 Public health initiatives to promote the consumption of shortfall nutrients and address disparities in nutrition should be mindful of the economic hierarchy the food supply, in which calories are inexpensive, but vitamins and minerals are costly.19 52 53 At the same time, more research is needed to better understand how cost constraints affect food choices and diet quality in different demographic and socio-economic strata.
What is already known
Socio-economic disparities in diet patterns and nutrient intake are well documented. However, little is known about the extent to which those disparities are driven by the higher monetary cost of nutritious foods.
What this study adds
This study found that the more nutritious diets were associated with higher diet costs. Moreover, socio-economic disparities in diet quality were attenuated when the cost of the diet was taken into account. If diet costs can explain disparities in diet quality, then public health efforts to improve diet quality in vulnerable populations must move beyond simply emphasising education and motivation. Economic and food systems interventions may be needed as well.
Acknowledgments
The authors thank T Hastert and C Rehm for their comments on earlier versions of this manuscript.
References
Footnotes
Funding Supported by grants R01DK076608 and R21DK085406 from the National Institute of Diabetes and Digestive and Kidney Diseases.
Competing interests None.
Ethics approval Ethics approval was provided by the University of Washington Human Subjects Division.
Provenance and peer review Not commissioned; externally peer reviewed.