Article Text

Abstract
Background There are few longitudinal studies investigating the risk of major depression by socioeconomic status (SES). In this study, data from the longitudinal cohort of Canadian National Population Health Survey were used to estimate the risk of major depressive episode (MDE) over 6 years by SES levels.
Methods The National Population Health Survey used a nationally representative sample of the Canadian general population. In this analysis, participants (n=9589) were followed from 2000/2001 (baseline) to 2006/2007. MDE was assessed using the Composite International Diagnostic Interview—Short Form for Major Depression.
Results Low education level (OR=1.86, 95% CI 1.28 to 2.69) and financial strain (OR=1.65, 95% CI 1.19 to 2.28) were associated with an increased risk of MDE in participants who worked in the past 12 months. In those who did not work in the past 12 months, participants with low education were at a lower risk of MDE (OR=0.43, 95% CI 0.25 to 0.76), compared with those with high education. Financial strain was not associated with MDE in participants who did not work. Working men who reported low household income (12.9%) and participants who did not work and reported low personal income (5.4%) had a higher incidence of MDE than others.
Conclusions SES inequalities in the risk of MDE exist in the general population. However, the inequalities may depend on measures of SES, sex and employment status. These should be considered in interventions of reducing inequalities in MDE. MDE history is an important factor in studies examining inequalities in MDE.
- Socioeconomic status
- major depression
- population-based longitudinal study
- risk
- employment status
- cohort ME
- depression
- employed CG
- epidemiology
- health status ME
Statistics from Altmetric.com
- Socioeconomic status
- major depression
- population-based longitudinal study
- risk
- employment status
- cohort ME
- depression
- employed CG
- epidemiology
- health status ME
Socioeconomic inequalities in health are a significant public health issue.1 A lower social position is often associated with poorer physical and general health and a higher level of mortality,2–6 high psychiatric morbidity and disability.7–12 Most of previous studies on the relationship between socioeconomic status (SES) and mental disorders are cross-sectional, which cannot distinguish whether low SES is associated with the development of mental disorders. Major depression is one of the most prevalent mental disorders in the general population13–15 and is a leading cause of disease burden in the world.16 However, there is a paucity of population-based longitudinal studies examining the relationship between SES and major depression.8
Various measures have been used as indicators for SES, including objective (education, income, social class and wealth) and subjective (financial strain) measures. In a meta-analysis of socioeconomic inequalities in depression, Lorant and colleagues8 identified five longitudinal studies in the USA,17–19 the UK20 and Canada.21 The meta-analysis showed that the low SES individuals had higher odds of developing a new episode of major depression (odds ratio (OR)=1.24).8 However, an 18-month longitudinal study in the UK showed that education and social class were not associated with the risk of major depression.22 The Belgian Households Panel Survey revealed that subjective financial strain, not household income, was positively associated with the risk of depressive syndrome.23
The SES inequalities in depression may vary according to how depression was measured, the definition and measurement of SES, geographic locations, time and employment status.8 24 Household income has been used in previous studies as an indicator for SES. It is reasonable to believe that some who report high household income may be at a low personal income level and vice versa. Personal income can be considered as an indicator for individuals' SES in the workplaces. However, the relationship between personal income and health has not been well studied. The limitations of previous studies also include the fact that important confounders including history of major depression25 and physical health24 were not fully controlled. In the current analysis, we analysed data from a large population-based longitudinal study using four SES indicators and a fully structured diagnostic instrument for major depression. The objectives of this analysis were to: (1) estimate incidence proportions of major depression over 6 years by levels of SES indicators and (2) examine the associations between SES and the risk of major depression.
Methods
Data from the longitudinal cohort of the Canadian National Population Health Survey (NPHS) were used. Detailed information about the methodology of the NPHS can be found in Statistics Canada's documentation.26 The NPHS was initiated by Statistics Canada in 1994/1995, targeting household residents in all Canadian provinces with certain exclusions.26 The NPHS is a Canadian national health survey using multiple-stage, stratified random sampling procedures. The 1994/1995 NPHS participants (n=17 276) formed a longitudinal cohort that was re-interviewed every 2 years. This cohort has been interviewed seven times. The 1994/1995 NPHS was conducted face to face by interviewers hired and trained by Statistics Canada. Telephone interviewing was the major data collection method in subsequent surveys.27 All data collected were based on participants' self-report.
Major depression
Major depressive episode (MDE) in the past 12 months was evaluated using the Composite International Diagnostic Interview—Short Form for Major Depression (CIDI-SFMD).28 The CIDI-SFMD is a brief version of the major depression section from the CIDI, based on the Diagnostic and Statistical Manual of Mental Disorders, fourth edition criteria.29 The CIDI-SFMD was developed and validated at the University of Michigan.28 30 Major depression, as defined in the NPHS, represents a 90% predictive cut-point for the CIDI-SF. The sensitivity and specificity of the CIDI-SFMD using this cut-point when compared against the full version of the CIDI are 90% and 94%, respectively.30 MDE was assessed in every cycle of the NPHS.
SES indicators
In this analysis, we used both objective (education, household income and personal annual income) and subjective (financial strain) measures for SES. Information about education and household income was collected in all cycles. Questions about personal annual income and financial strain were asked from cycles 4 to 7. Education was classified into two levels (having less than 13 years education vs 13 years education or above). The NPHS categorised family income into five levels based on total family income and the number of people in the household (lowest, lower middle, middle, upper middle and highest). Preliminary analyses showed that there were no significant differences in the incidence of MDE between “middle”, “upper middle” and “highest” income groups. Thus, in this analysis, the five income levels were grouped into two categories (low family income vs middle and high family income). There is no standard classification system for personal income levels. In this analysis, based on the distribution of personal income, we classified participants into three levels, such as (1) no income to $29 999, (2) $30 000 to $59 999 and (3) $60 000 and above (all in Canadian dollars). In the NPHS, participants were asked “You don't have enough money to buy the things you need”. The answer of “true” was considered as having financial strain.
Other variables
Included in this analysis are sex, work status in the past 12 months, types of job (full-time vs part-time job), marital status (married or in common-law relation, divorced, separated or widowed, and single or never married) and self-rated health (fair/poor health vs good/excellent health) at baseline (2000/2001 NPHS).
Statistical analysis
In this analysis, 2000/2001 NPHS participants who did not have MDE from 1994/1995 to 2000/2001 were included. Although the NPHS started in 1994/1995, we chose cycle 4 (2000/2001) NPHS as the baseline of this analysis. The decision was based on two factors. First, data about personal annual income were not collected in the first three cycles of NPHS. Second, using cycle 4 of the NPHS as baseline, MDE occurring in the previous three cycles could be used as an indicator for history of MDE. History of MDE is widely considered as an important risk factor for later development of MDE.
In the 2000/2001 NPHS, there were 11 941 participants who were 18 years old and above. To compare the risk of MDE by levels of SES variables in 2000/2001, we excluded participants with MDE in any of the first four cycles (1994/1995–2000/2001). Incident cases of MDE were defined as those who had had MDE in cycle 5 (2002/2003), cycle 6 (2004/2005) or cycle 7 (2006/2007). The NPHS participants who did not have MDE from cycles 1 to 4 (n=9589) were classified by the levels of 2000/2001 SES variables. The incidence proportions of MDE by levels of SES indicators overall and by sex were estimated and compared. The same analysis procedures were repeated in participants who worked and those who did not work in the past 12 months in the 2000/2001 NPHS. Logistic regression models were performed to estimate the associations between SES and MDE in the form of OR and 95% confidence interval (95% CI). Because the NPHS used multistaged stratified random sampling procedures, sampling weights provided by Statistics Canada were used for point estimation. Bootstrap weights provided by Statistics Canada were used to estimate the CIs, adjusting the sampling and design effects. The analyses were performed using STATA V.10.31
Results
The demographic and socioeconomic characteristics of the 2000/2001 NPHS participants who did not have MDE from 1994 to 2001 are presented in table 1.
Demographic and socioeconomic characteristics of the 2000/2001 NPHS participants who did not have MDE from 1994 to 2001 (n=9589)
We estimated the incidence proportions of MDE by levels of SES indicators. Preliminary analysis showed that there were significant differences in the incidence proportions by levels of the selected SES variables, without exclusion of MDE from 1994 to 2001. After MDE cases from 1994 to 2001 were excluded, only participants who reported financial strain in 2000/2001, especially women, were more likely to have developed MDE (table 2).
Weighted 6-year incidence proportions of MDE by SES status in the 2000/2001 NPHS, overall and by sex
The incidence proportions of MDE were estimated by SES variables separately in participants who worked and those who did not work in the past 12 months at the time of the 2000/2001survey (table 3). Among participants who worked in the past 12 months, those with low education had a higher incidence of MDE than individuals who had higher education, regardless of sex. Whereas in those who did not work in the past 12 months, participants who had a higher level of education had a higher incidence proportion than their counterparts, irrespective of sex. Household income was only associated with MDE among men who worked in the past 12 months. Participants who did not work and who were at the lowest level of personal annual income were more likely to have developed MDE than others. However, the differences became statistically insignificant when it was examined by sex separately. Working participants who reported financial strain had a higher incidence proportion than those who did not. This was not observed in participants who did not work.
Weighted incidence proportions of MDE by SES status in the 2000/2001 NPHS in participants who worked and those who did not work in the past 12 months, overall and by sex
We examined interactions between selected SES indicators and demographic variables. An interaction between working status and educational levels was found (table 4). Logistic regression models were then developed for all eligible participants and by working status, excluding participants with MDE from 1994 to 2001 (table 4). Because the correlations among the four SES variables were small (the correlation coefficients ranged from 0.05 to 0.25), we included all SES variables in the multivariate models. In the multivariate logistic regression model, low educational level and reported financial strain were associated with the risk of MDE. Among participants who worked in the past 12 months, the odds of having developed MDE in those who were at the low educational level and those who reported financial strain were greater than those who had a higher level of education and those who reported no financial strain. In participants who did not work, because there were no incident cases in men who were in the highest personal income level, including sex in the model generated large variances associated with the estimates. Therefore, sex was not included in the model. In the final model, it was found that those who had a lower level of education were less likely to have developed MDE than others.
Results of logistic regression models, overall and by employment status in 2000/2001
The logistic regression models were developed by sex. An effect modification between working status and educational levels was found in women (table 5). Because of relatively small numbers of participants who did not work in men and in women, estimates of the associations between SES and MDE in these subpopulations were not precise and therefore were not presented. Table 5 contains the associations between SES and MDE in participants who worked in the past 12 months by sex. In working women, low education and financial strain were positively associated with MDE. In working men, low education was positively associated with MDE. Low household income appeared to be associated with a high risk of MDE in working men (OR=2.04). However, the association was not statistically significant.
Results of logistic regression models, by sex and employment status in 2000/2001
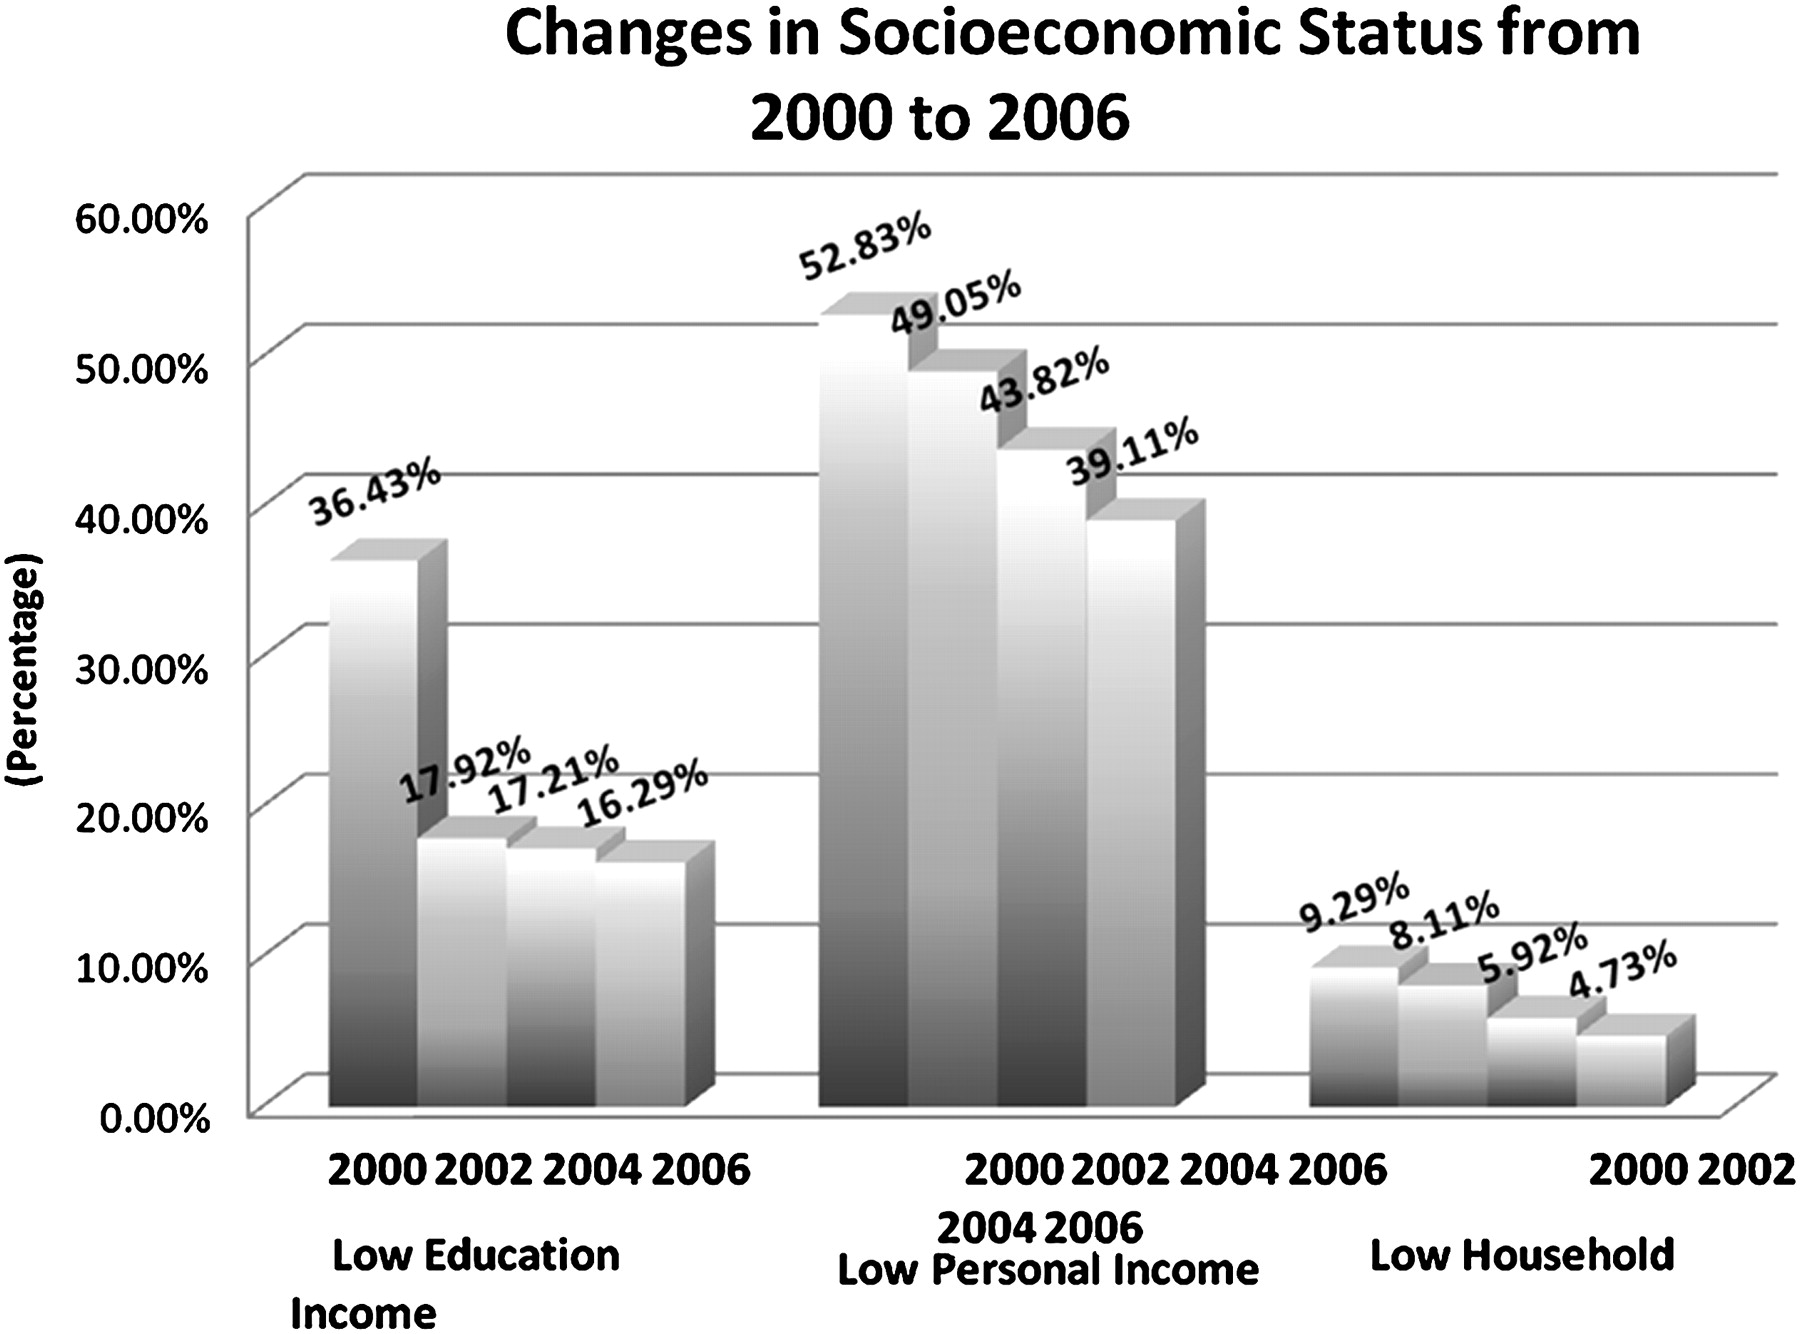
It is possible that the risk of MDE is affected by the trends of SES in the follow-up. We estimated the proportions of low SES of NPHS participants from 2000/2001 to 2006/2007 (figure 1). The proportions of low SES decreased in subsequent NPHS, which was attributable to missing data of these variables in these surveys. Additional analysis found that a majority of those with missing data on SES did not provide information about MDE. Thus, logistic regression modelling with SES as time-varying variables did not significantly change the results described above.

Changes in socioeconomic status from 2000 to 2006.
Discussion
Objective and subjective measures of SES have been used in health research.32 In this analysis, we used both objective measures (education, household income and personal income) and subjective indicator (financial strain) of SES. The NPHS data showed that participants who were at the low educational level and those who reported financial strain were more likely to have developed MDE than others, especially in the working poplation; significant associations between household income, personal income and MDE existed in subpopulations, for example, working men and those who did not work in the past 12 months. These results indicated that there are SES inequalities in the risk of MDE; the inequalities depend on the measurements of SES and the study populations. In this study, we used the 2000/2001 NPHS as baseline. Most of the differences in the incidence of MDE by baseline SES levels disappeared after MDE cases in the past (from 1994 to 2001) were excluded. Therefore, MDE history played an important role in examining SES inequalities in the risk of MDE.
The associations between education, financial strain and MDE in this study were stronger than that reported by Lorant et al.8 The association between financial strain and MDE was consistent with that in the UK longitudinal study.22 It should be noted that the study of Lorant and colleagues was a meta-analysis, which included studies using various measures of SES and depression. The measures of SES in the UK longitudinal study were similar to those used in our study. However, the participants in the UK study were followed for 18 months. With such a relatively short follow-up period, the number of incident cases may be small, as reflected by the wide 95% CIs in that study.22 The short follow-up period may partly explain the non-significant association between education and major depression in the UK study (OR=2.09, 95% CI 0.69 to 6.35) and the non-significant association between SES and major depression in the US study.18
The NPHS data showed that history of MDE was an important confounder in the relationship between SES and MDE. In our preliminary analysis, all SES indicators were associated with MDE. After excluding baseline MDE and MDE in the past surveys, the incidence proportions of MDE by levels of education and income were not different. This indicated that, in studies examining SES inequalities in the risk of MDE, excluding MDE cases at baseline and cases occurring in the past is critical to ensure the validity of the estimates.
The strong association between financial strain and MDE was consistent with previous studies.19 22 Theoretically, financial strain may be considered as an indicator for subjective social status,33 which “reflects the cognitive averaging of standard markers of socioeconomic situation”.34 It is possible that individuals in the high income group also experience financial strain because of overspending or inappropriately raising standard of living.22 To this extent, financial strain can be considered as a negative life event or stressor accompanied by the perception of lowered social status, which leads to the increased risk of MDE. However, in the NPHS, we found that such an association only existed in the working population. Although it is possible that participants who reported financial strain were more likely to cluster in the low educational group, this cannot be the sole explanation because financial strain and education were two independent risk factors associated with MDE in the model. It was not clear why financial strain was not associated with MDE in those who did not work. Although objective SES (eg, income) constitutes the basis of subjective SES (eg, financial strain),32 people may use other criteria to make judgement about their own social status,34 which makes objective and subjective SES conceptually different. Given that income in general was not associated with the risk of MDE in the NPHS and the individuals who do not work are more likely to be in the low income group, one may hypothesise that, in the participants who did not work, the perception of financial strain was more closely related to their income status, compared to those who were employed.
The NPHS did not collect information about job grade. However, we found that, in the NPHS working population, those who had a higher level of education were less likely to have developed MDE. It was interesting that, among those who did not work in the past 12 months, participants who had a higher level of education were more likely to have had MDE than those with low education at baseline. One possible explanation was that unemployment had a greater impact on the risk of MDE in those who had a higher level of education and thus were previously at the advantaged social position. Wiggins et al24 also found very high rates of mental health problems assessed by the General Health Questionnaire among unemployed persons in more advantaged households and who had previously been in more socially advantaged occupations.
Working men who were at the low household income level were more likely to have had MDE than others. This was not found in women. Traditionally, men give priority to breadwinner role. Therefore, it was possible that the low household income status affected men's self-esteem, leading to an increased risk of MDE.
This study had several limitations. The NPHS longitudinal cohort was interviewed every 2 years. MDE in the NPHS referred to the past 12 months. Thus, information about MDE in the year immediately after each survey was not available. Given the lack of information, the incidence of MDE in the groups could have been underestimated. The NPHS relied on self-report. Therefore, reporting and recall biases were possible. In the NPHS, the CIDI-SF was used, which may not be as specific as the full version of CIDI. Nevertheless, the high sensitivity and specificity of the CIDI-SF have been established. Although MDE cases from 1994 to 2001 were excluded from the analysis, some participants might have had MDE before the 1994/1995 NPHS, who could not be identified. As such, confounding by MDE that occurred before 1994 was a possibility. One major source of bias in a longitudinal study is attrition and missing information in subsequent surveys. As we defined SES using four different indicators, the number of participants with missing information about MDE in subsequent surveys varied by SES indicators. We compared participants with and without missing information about MDE in subsequent surveys by SES indicators. It was found that participants with missing information of MDE were more likely to be male, older and not married. In particular, as described in the Results section, those with missing data on MDE during follow-up were more likely to be those who were in low SES at baseline and had missing information about SES in the follow-up. If participants with missing SES data in the follow-up had a higher risk of MDE than those who were in the cohort, the associations between education, household income, personal income and the risk of MDE could have been underestimated. This may partly explain the non-significant associations between MDE and these SES variables. The estimates presented in this study were weighted, using the weights provided by Statistics Canada. The weights adjusted non-responses, sex, age, education and income.26 Therefore, we assumed that the missing information about MDE in relation to SES indicators might not have significant impacts on the results of this analysis. However, longitudinal studies with less missing data in SES and MDE are needed.
This was one of few longitudinal studies investigating SES inequalities in the risk of MDE in the general population. Low SES is associated with the increased risk of MDE. However, the inequalities in the risk of MDE depend on the measures of SES, sex and employment status. The directions of the association between education and MDE differ in the employed and the unemployed. These should be considered in the efforts of reducing SES inequalities in the risk of MDE.
What is already known on this subject
Socioeconomic inequalities in health are a significant public health issue. Although major depression is a leading cause of burden of disease, there are few population-based longitudinal studies investigating inequalities in the risk of major depression.
Previous longitudinal studies were not consistent in the inequalities of major depression and important confounders were not controlled.
What this paper adds
Inequalities in the risk of major depression exist in the general population.
History of major depression is an important confounder in the relationship between SES and major depression.
The patterns of major depression inequalities differed by employment status.
Acknowledgments
The research and data analysis used data from Statistics Canada. However, the opinions and views expressed do not represent those of Statistics Canada.
References
Footnotes
Funding Other funders: This study was supported by a grant from the Canadian Institutes of Health Research (CIHR). JLW holds a CIHR New Investigator award. CD is a recipient of the CIHR/PHAC Applied Public Health Chair.
Competing interests None.
Ethics approval This study was conducted with the approval of the Conjoint Health Research Ethics Board of the University of Calgary.
Provenance and peer review Not commissioned; externally peer reviewed.