Article Text

Abstract
Objective: To examine the socioeconomic patterns and time trends in fetal growth in Denmark, Finland, Norway, and Sweden from 1981 to 2000.
Design and settings: Data on all live-born singleton births was drawn from national population registries in each of the four countries (Denmark n = 1 077 584; Finland n = 400 442; Norway n = 929 458; Sweden n = 1 761 562).
Main outcome measure: Slope index of inequality (SII) and mean differences in birthweight for gestational age, SII and risk differences in small-for-gestational-age (SGA) and large-for-gestational-age (LGA) infants.
Results: In all countries, gradients in fetal growth by parental education existed. Low parental education was associated with lower birthweight, increased risk of SGA and decreased risk of LGA. Mother’s education exerted the strongest influence on outcomes, whereas father’s education had a weaker effect. The educational gradients as measured by the SII were generally steepest in Denmark, followed by Norway, Sweden, and Finland. From 1981 to 2000, the educational gradients in birthweight decreased in all countries, except Denmark where it increased. All countries experienced small decreases in the educational gradient in SGA over time.
Conclusion: The economic recession in Denmark in the 1980s was concurrent with an increase in disparities in fetal growth, whereas the economic recession in Finland and Sweden in the early 1990s did not substantially increase the socioeconomic inequality in fetal growth. The economic growth in the later part of the 1990s may have diminished the socioeconomic inequality in fetal growth in Finland, Norway, and Sweden.
Statistics from Altmetric.com
Birthweight is a commonly used indicator of the newborn infant’s health at birth, partly because it is easy to measure and is routinely recorded on birth certificates in many countries. Even though most newborn infants with perinatal problems are healthy in childhood,1 birthweight has been shown to predict health and health-related outcomes in childhood and later in life, eg infant mortality,2 3 school age cognitive performance,4 adult mortality,5 and chronic disease in adulthood, especially cardiovascular disease.6 7 If birthweight affects health trajectories over the life course, inequality in birthweight may translate into health inequality over the life course. Secular trends in the social inequality in birthweight may thus be predictive of both short-term and long-term secular trends in health inequality.
An inverse association between birthweight and socioeconomic position has been observed in several different populations and across different measures of socioeconomic position inside and outside the Nordic countries.8–21 Fewer studies have, however, examined the time trends in the associations14–20 or compared the associations across countries.21
The Nordic countries are well suited for comparative aetiological studies of differences in social inequality in birthweight; as a result of high homogeneity between countries the possible causes of differences might be fewer and thus easier to identify.22 The Nordic countries are similar in many fundamental respects, but important differences exist. The countries have experienced quite different macroeconomic trajectories from 1981 to 2000 and have pursued very different policies regarding tobacco and alcohol control, labour market mobility, and social benefits for pregnant women and families with children, such as maternal leave and child allowances.23
Finally, much of the existing literature has used birthweight or low birthweight (<2500 g) as an outcome. Birthweight is determined by the length of gestation and intrauterine growth, which may have different aetiologies and health effects.24 Consequently, gestational age needs to be taken into account to isolate the effect of intrauterine growth on birthweight.
The purpose of this paper is to examine the social inequality in birthweight for gestational age, small-for-gestational-age (SGA) and large-for-gestational-age (LGA) infants in Denmark, Finland, Norway and Sweden in the period 1981–2000.
METHODS
Study population
The Medical Birth Registries in Denmark, Finland, Norway and Sweden contain records on all births. This information was supplemented with health and socioeconomic data on the mother, father and child through linkage with other national registries.
This paper is based on the NorCHASE (Nordic Collaborative project on Health And Social inequality in Early life) cohort, which is a database created for comparative research on social inequality in early life health, and is based on national registries and censuses in Denmark (the Medical Birth Registry, the National Hospital Registry, the Integrated Database for Labour Market Research, the Population Registry, the Causes of Death Registry, and the Register of Transfer Payments), Finland (the Medical Birth Registry, the Malformation Registry, the Registry on Social Assistance, and the Causes of Death Registry, Registry on Education, and Population Registry), Norway (the Medical Birth Registry, the Causes of Death Registry, and Statistics Norway), and Sweden (the Medical Birth Registry, the Causes of Death Registry, the LOUISE database, and the Census of Sweden 1980, 1985 and 1990). The NorCHASE cohort encompasses all births in Denmark, Norway and Sweden from 1981 to 2000. In accordance with data protection regulations at Statistics Finland, the total Finnish data were not available to NorCHASE. The Finnish data consisted of all stillborn and deceased infants plus a random 50% sample of all other births in Finland from 1987 to 2000.
For the present study, we used data on all live singleton infants born between 1981 and 2000 (for Finland since 1987). To increase the homogeneity of the study populations, we only included births to mothers who themselves were born within any of the Nordic countries (Denmark n = 1 097 455; Finland n = 406 916; Norway n = 1 035 126; and Sweden n = 1 778 329). We excluded infants with missing values for gestational age or birthweight, infants with gestational ages of less than 28 or more than 44 completed weeks, and infants with implausible values of birthweight by gestational age according to the method described by Alexander et al25 The percentages excluded were 1.8% (Denmark), 1.6% (Finland), 10.2% (Norway) and 0.9% (Sweden). The large proportion of excluded cases in the Norwegian dataset was due to 8.3% missing values on gestational age. The effective sample sizes were: Denmark n = 1 077 584; Finland n = 400 442; Norway n = 929 458; and Sweden n = 1 761 562.
Variables
Birthweight, SGA, and LGA were the outcome measures. SGA and LGA was defined as birthweights falling below the 10th percentile (SGA) or above the 90th percentile (LGA) of the birthweight distribution for a given sex in a given week of gestation in a given year in a given country.24 26
Highest completed education (⩽9 years, 10–12 years, ⩾13 years), gestational age (in completed weeks), parity (0, ⩾1), maternal age (⩽19 years, 20–34 years, ⩾35 years) and paternal age (⩽24 years, 25–39 years, ⩾40 years), whether a father was registered in the Medical Birth Registry, and year of birth (1981–1985, 1986–1990, 1991–1995, 1996–2000) were chosen as independent variables. We measured the highest completed education at the latest possible time, ie between 2003 and 2005. In Finland, only non-mandatory education was recorded in the National Register on Education. Consequently, we have coded those not registered in the National Register on Education as having less than 10 years of education. The slope index of inequality (SII) in mother’s and father’s education was calculated for birthweight, LGA and SGA. The SII is interpreted as the difference in outcome (mean birthweight, risk difference in SGA/LGA) between the hypothetically most advantaged (100th percentile of the distribution) and least advantaged (0th percentile).27
Statistical analysis
For data protection reasons, data from each country had to be analysed separately. Linear and binomial linear regression was used to model the relationship between the dependent variables birthweight, LGA and SGA and the independent variables. From the binomial linear regression, risk differences (RD) are reported. RD is the risk in the exposure group minus the risk in the reference group, and is interpreted as the difference in risk attributable to the difference in exposure. Separate effect estimates of all covariates were obtained for each of the four five-year periods under observation. Interaction terms between parental education and birth year period were employed to assess whether changes over time were statistically significant. In the analyses in which birthweight was used as the dependent variable, gestational age in completed weeks was modelled as a fourth degree polynomial.28 No adjustment for gestational age was made when SGA and LGA were used as outcomes. To take account of the sampling design of the Finnish data, we used inverse probability-weighted regression to analyse the Finnish data.29 An inverse probability weight of 2 was assigned to infants from the random sample, who had a 50% probability of being sampled to the cohort. All deceased infants, who had a 100% probability of being selected, were assigned weights of 1. In the descriptive analyses of Finnish data, we assigned a frequency weight of 2 to infants of the random sample.
RESULTS
In all four countries the average educational attainment increased from 1981 to 2000, but with important differences (table 1). Denmark, which had the least favourable educational profile in the early 1980s, experienced the largest increase in educational level through the period. For example, the fraction of Danish mothers with less than 10 years of education dropped by more than 10% over the study period. Finland and Norway, which both started from more favourable positions than Denmark, experienced a stable growth in educational attainment. Comparably, Sweden experienced the lowest growth in the length of education. All four countries experienced increases in the mean parental age by approximately two years from 1981 to 2001.
Mean birthweight increased by more than 100 g in Denmark over the study period, by a little less in Norway and Sweden, whereas the average birthweight in Finland was very stable, possibly because of an increased focus on the monitoring of gestational diabetes in Finland.30 Mean birthweight was very similar in the four countries in 1996–2000, and ranged from 3555 g (Denmark) to 3609 g (Norway). The proportions of very (28–32 weeks) and moderately (33–36 weeks) preterm births were similar in the four countries.
Birthweight for gestational age
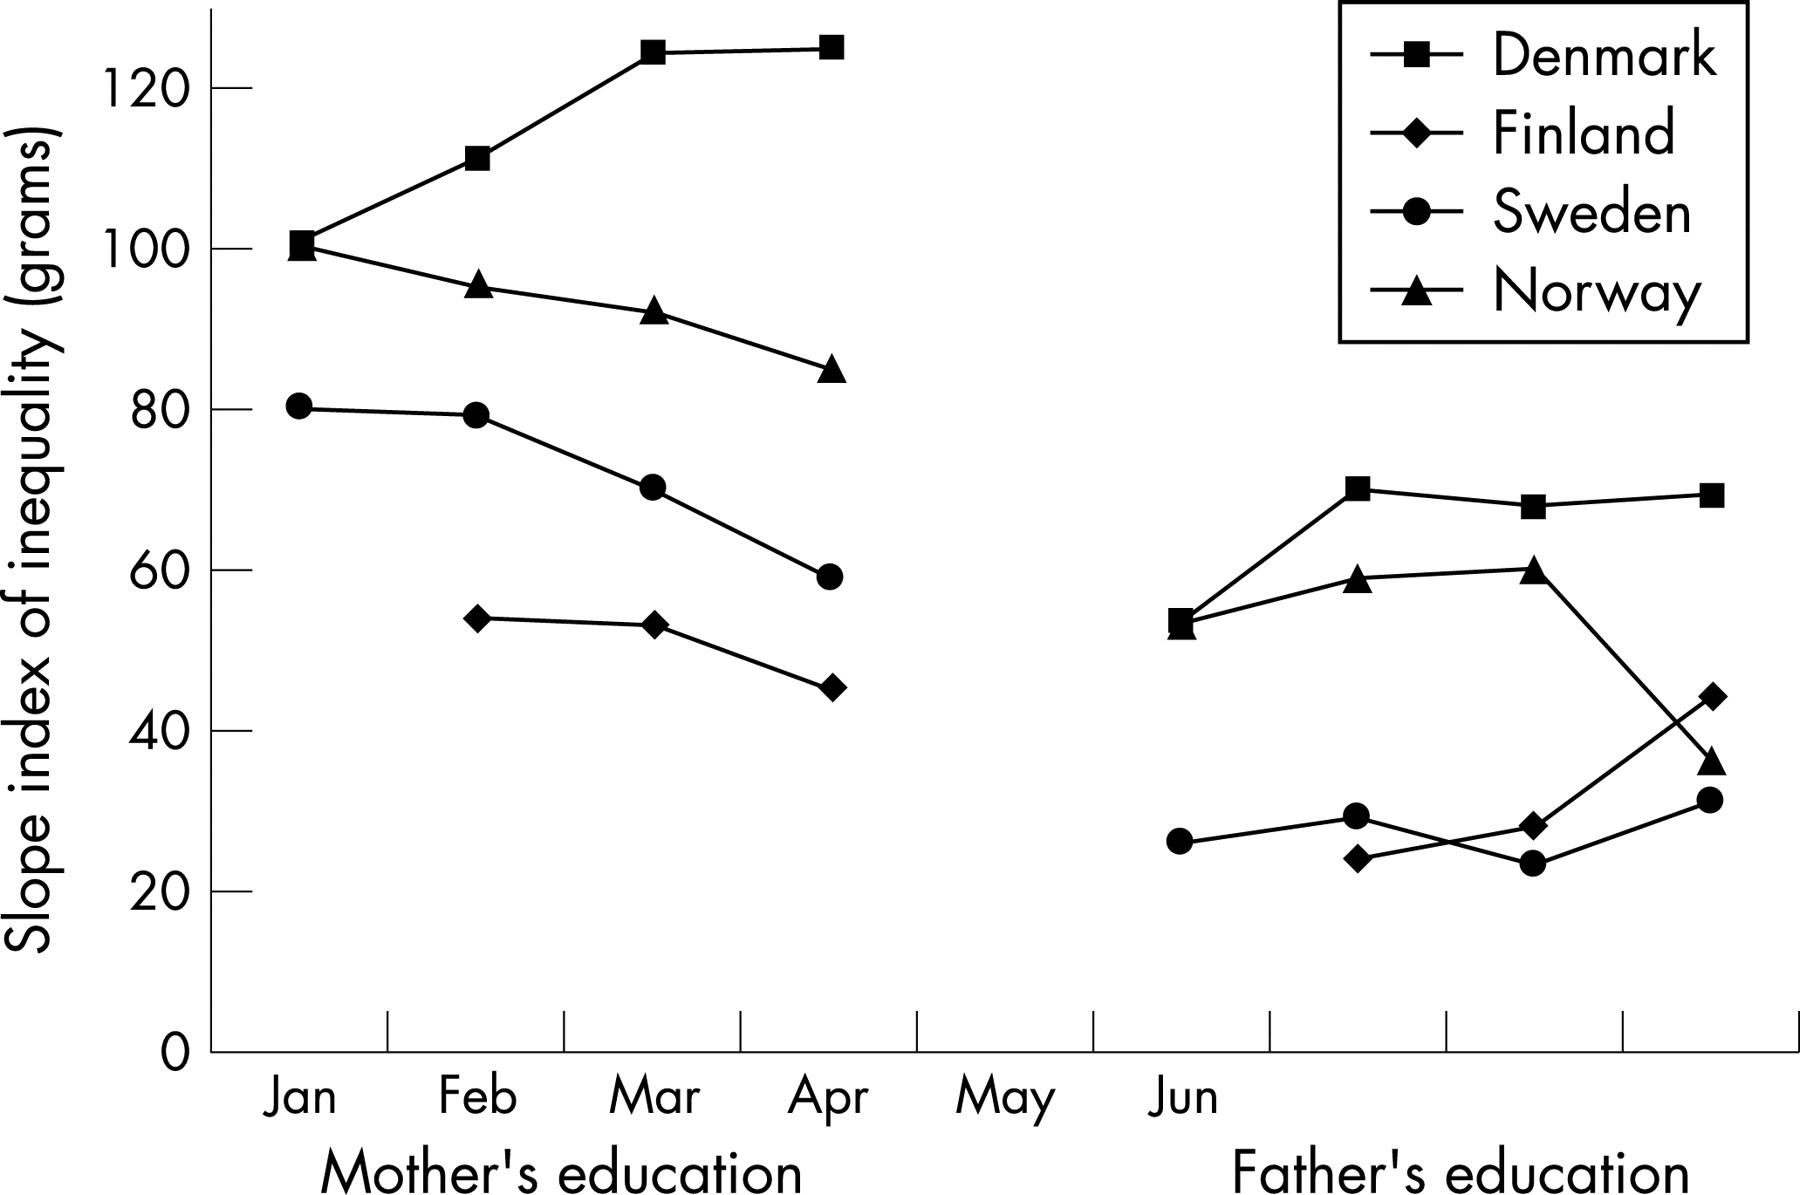
Table 2 shows the association between mother’s education and offspring’s birthweight, adjusted for gestational age and parental characteristics. There was a clear association between mother’s education and birthweight for gestational age in all countries. A maternal education of less than 10 years or 10–12 years was associated with decreased birthweight when compared with a maternal education of 13 or more years. The educational gradients in birthweight were weakest in Finland, followed by Sweden, Norway, and Denmark. The time trends showed that the educational differences were most stable in Norway, whereas the educational differences increased in Denmark. In Finland and Sweden the educational differences in birthweight were relatively stable until the last half of the 1990s, when the educational differences diminished. The SII differed substantially between countries, probably reflecting differences in the effect of education as well as the distribution of education in the four counties. For example, the effect estimates for short education were similar in magnitude in Denmark and Norway, but the prevalence of exposure to low education was higher in Denmark than in Norway. Consequently, the SII was higher in Denmark (fig 1).

Father’s education was also independently associated with birthweight for gestational age (table 3 and fig 1). The effect sizes of father’s education were roughly half of the effect of mother’s education, and the pattern of association over time and between countries was very similar to that of mother’s education.
Small for gestational age
Table 4 shows that a clear association between SGA and mother’s education exists. The largest differences were seen in Denmark, followed by Norway, Sweden and Finland. The effect of mother’s education was stronger than that of father’s education, but both had independent effects (data not shown). The SII in mother’s education decreased slightly over time in the four countries.
Large for gestational age
A weak inverse gradient in LGA was observed so that a short parental education was associated with a decreased risk of LGA. Compared with the educational gradients in SGA, the association between parental education and LGA was weaker. For mother’s education, the largest differences were seen in Denmark, followed by Norway (table 5). In Sweden and Finland the educational gradients were very small. The picture was similar for father’s education, which had little or no effect on LGA in Sweden and Finland (data not shown).
DISCUSSION
In all countries, low parental education was associated with decreased birthweight, increased risk of SGA and decreased risk of LGA. Mother’s education exerted the strongest influence on outcomes, whereas father’s education had a weaker effect. The educational gradients as measured by the SII were generally steepest in Denmark, followed by Norway, Sweden, and Finland. From 1981 to 2000, the educational gradients in birthweight decreased in all countries, except Denmark where it increased. All countries experienced small decreases in the educational gradient in SGA over time. For LGA, Denmark experienced an increase in the educational gradient, whereas the gradients were stable in the other countries.
Covering four countries and more than four million births over a 20-year time span, this is to our knowledge the most comprehensive study of its kind. As the national registries have almost complete coverage, selection is not a significant source of bias. The large percentage of excluded births from the Norwegian dataset as a result of missing values on gestational age (8.3%) might bias the observed findings, but it does not seem likely that the association between parental education and fetal growth over time would be different in those excluded. Most information in this study was not collected by self-report and was thus not sensitive to the associated types of information bias. Country-dependent misclassification of exposure might be a source of bias and may falsely increase the between-country differences. The proportion of parents with nine years of education or less is surprisingly high in Denmark compared with the other three countries, and may be partly explained by differences in the classification schemes. It is worth noting that the difference between the least educated (nine years or less) and the highest educated (13 or more years) is generally largest in Denmark, which also has the highest proportion of individuals belonging to the least educated category. If the “nine years of education or less” category is (falsely) inflated in Denmark as a result of the misclassification of individuals with a longer education, we would rather expect to find that low maternal education was associated with smaller differences in Denmark. There are some indications of underestimation of the proportion of individuals in the “nine years of education or less” category in the other countries. For example, Norway has recently implemented a new classification standard that substantially increases the proportion of individuals classified as having less than 10 years of education.31 This would not, however, substantially bias the difference between the least and the highest educated towards null if we make the reasonable assumption that misclassification primarily takes place between adjective categories.
What is already known on this subject
Fetal growth is important for short and long-term health
Social inequality in fetal growth may affect short and long-term health inequalities
What this paper adds
We observed different educational gradients in the four countries. Denmark experienced stable or increasing educational inequalities, whereas Finland, Norway and Sweden experienced decreasing educational inequality in fetal growth from 1981 to 2000
The steepest gradients in fetal growth were generally found in Denmark, followed by Norway, Sweden and Finland
The economic recession in Finland and Sweden in the early 1990s did not substantially increase educational inequality Evi
Policy implications
The social inequality in fetal growth should be monitored to ensure equity in health
The educational gradient in fetal growth is affected by the prevalence and distribution of mediating factors, eg parental smoking, which should be targeted by national policies to reduce social inequality
The between-country differences in educational gradient in fetal growth might partly reflect between-country policy differences
The effects of parental education reported in this study were adjusted for parity and parental age. As it cannot easily be determined whether parity and parental age should be considered confounders or mediators, we adjusted for these factors to arrive at estimates that were independent of parity and parental age. Also, the effect of one parent’s education was adjusted for the other parent’s education. This was done to examine the independent effects of mother’s and father’s education. In this study, we have chosen to report absolute effect estimates (differences in mean birthweight for gestational age and risk differences) rather than relative effect estimates (eg risk ratios), because relative measures can be misleading, especially when comparing effects across populations with different exposure and outcome distributions.32 We measured parental education at the latest possible point in time. This means that mother’s and father’s education was commonly measured after the birth of the offspring, which makes reverse causation possible. It seems unlikely, however, that outcomes such as birthweight, SGA and LGA will have major effects on parental educational trajectories.
Why would we expect differences in socioeconomic inequality over time within and between the Nordic countries? The Nordic countries have quite similar welfare systems with universal healthcare and social benefits, and high social expenditure as a percentage of gross domestic product.33 The Nordic countries are also characterised by low income inequality and low childhood poverty rates. Women’s participation in the labour market is high in all countries in the period under observation. In the 1990s, especially Finland, but also Sweden was hit by severe economic recession, which caused unemployment rates to increase. Denmark experienced a prolonged economic recession from the early 1980s to the early 1990s.34 35 Norway, on the other hand, has not been subject to similar economic recessions in the period under observation. If economic recession increases the impact of education on fetal growth, we would expect the educational gradients to increase in Sweden and Finland in the third period (1991–1995). Our findings do not confirm this hypothesis, although there is a small increase in Finland. In the last period (1996–2000), we would expect educational gradients to decrease as all countries experienced economic growth in this period. This appears to have been the case for all countries but Denmark, where the educational gradient increased in the last period for all outcomes but SGA.
A few studies have looked at time trends in socioeconomic inequality in fetal growth and birthweight in settings that are comparable to this study. Using data from the Finnish Medical Birth Registry from 1991 to 1999, Gissler et al36 found a decrease in occupational socioeconomic differences in low birthweight, preterm birth and perinatal mortality from 1991 to 1999. A recent study from Scotland revealed an increase in the social inequality measured by the Registrar General’s occupational social class in birthweight similar to what we found for Denmark, but it is not comparable to the time trends in the other countries.15 16
A likely explanation for the steeper educational gradient in Denmark is the prevalence and distribution of mediating factors, especially maternal smoking, which decreases birthweight considerably. The prevalence has dropped from approximately 35% in 1980 to approximately 25% among pregnant women in Denmark.37 38 In Finland, smoking prevalence was approximately 15% among pregnant women from 1987 to 1997.39 In Norway, 31% of pregnant women smoked in 1980, whereas the corresponding figure for 1999–2002 was 17%.40 41 In Sweden, the prevalence has dropped from 31% in 1982 to 13% in 2000.38 Given that smoking is associated with (low) education,38 42 the difference in prevalence is probably the single most important contributor to the between-country differences in the association between education and fetal growth. Other factors related to fetal growth, for example alcohol use, stress, body mass index, and the monitoring of gestational diabetes,42 may also be of importance in explaining the within and between-country variation in the educational gradient in fetal growth, but comparative information on these factors is not available for the present study.
In conclusion, educational gradients in fetal growth exist in Denmark, Finland, Norway and Sweden, but there are subtle differences in the association between parental education and outcomes in the four countries. The between-country differences in fetal growth suggest that determinants at the societal level such as policy are important.
REFERENCES
Supplementary materials
erratum 62/4/325
Corrected Figure 1.
Files in this Data Supplement:
Footnotes
Funding: NorCHASE was funded by the Research Program in Longitudinal Epidemiology, which is supported by the Nordic Council of Ministers and administered by NordForsk (the Nordic Research Board).
Competing interests: None.
Linked Articles
- In this issue
- Correction