Article Text

Abstract
Objective: To explore the association between physical neighbourhood stressors and smoking, and the contribution of these stressors to neighbourhood and individual socioeconomic inequalities in smoking.
Methods: Data were analysed of participants of the baseline measurement of the Dutch GLOBE study (1991), aged 20 years and older, who lived in 79 neighbourhoods of the city of Eindhoven (n = 9062). The neighbourhood socioeconomic environment was assessed from aggregated self reported information of participants’ education and occupation level, and employment status. Neighbourhood stressors included were the physical quality (decay), required police attention, noise pollution from traffic, and population density in neighbourhoods. Current smokers were distinguished from previous and never smokers.
Results: Compared with those living in the most advantaged neighbourhoods, residents living in the socioeconomically most disadvantaged neighbourhoods were more likely to smoke (adjusted for age, sex, education, occupation, and employment status) (OR = 1.24, 95% CI 1.05 to 1.46). An increase in a summary neighbourhood stressor score was associated with smoking, independently of the neighbourhood socioeconomic environment (OR = 1.57, 95% CI 1.11 to 2.21, in the neighbourhoods with the highest stress score). Adjustment for the score substantially reduced the odds ratio for living in the socioeconomic most disadvantaged neighbourhoods (OR = 1.03, 95% CI 0.84 to 1.28, for those in the most disadvantaged neighbourhoods). Neighbourhood stressors contributed 10% to the increased probability of smoking in the lowest educated persons.
Conclusions: Physical neighbourhood stressors are related to smoking and contribute substantially to neighbourhood inequalities in smoking over and above individual level characteristics.
- smoking
- socioeconomic inequality
- stress
- neighbourhood
Statistics from Altmetric.com
Prevalence rates of smoking are higher in more compared with less socioeconomically disadvantaged neighbourhoods, even after adjustment for individual socioeconomic factors of study participants.1–9 This implies that it may be efficient to use the neighbourhood as a setting for interventions aimed at the prevention of smoking initiation and at smoking cessation. Before developing such interventions there is a need to unravel the pathway underlying neighbourhood inequalities in smoking.
Stead et al carried out a qualitative study to explore this pathway. Residents in disadvantaged neighbourhoods mentioned that the struggle to cope on a limited income was intensified by stress because of unfavourable neighbourhood circumstances.10 Neighbourhood stressors mentioned were an unpleasant neighbourhood physical environment, crime, and limited opportunities for recreation. These findings fit well with studies showing that stress (such as from limited financial resources) contributes to socioeconomic differences in smoking behaviour at the individual level.11,12
The importance of bringing back the (physical) environment in public health research is well recognised.13 For smoking, recent studies suggest associations of smoking with the availability of tobacco14 and the concentration of convenience stores.15 This study is among the first to investigate whether neighbourhood stressors contribute to neighbourhood inequalities in smoking, taking into account individual level socioeconomic factors. Moreover, if associated with smoking, neighbourhood stressors may contribute to socioeconomic inequalities at the individual level as well. Therefore, the second aim of this study is to investigate whether neighbourhood stressors contribute to individual level socioeconomic inequalities in smoking.
METHODS
Study population
The Dutch prospective GLOBE study was started with the purpose of investigating explanations of socioeconomic inequalities in health. Detailed information about objectives and design of the study are presented elsewhere.16 For the baseline measurement in 1991, a random sample of 27 070 non-institutionalised subjects between 15 and 75 years of age and living in or near the town of Eindhoven were invited to fill in a postal questionnaire. The response rate was 70.1%, which resulted in 18 973 study participants. There were no significant differences in response rates by age, sex, social class (postcode), marital status, and level of urbanisation.
Most participants (n = 10 450, 52.7%) resided in Eindhoven (the fifth largest city of the Netherlands with about 190 000 inhabitants in 1991) and lived in 86 different neighbourhoods. From this group, subjects younger than 20 years of age (n = 512) were excluded because socioeconomic indicators and smoking behaviour were presumably not representative for the period of adulthood. Those with missing values for individual level indicators of socio-economic position (SEP) (n = 395), smoking (n = 184), problems with meeting ends financially (n = 135), and neighbourhood characteristics used in the study (n = 162) (please see below) were also excluded. Thus, analyses were carried out with n = 9062 subjects (87% of the original population, living in 79 neighbourhoods (mean number of participants per neighbourhood: n = 115, range: n = 8 to n = 331)).
Neighbourhood variables
To define the neighbourhood socioeconomic environment, information in the postal survey was used to rank neighbourhoods by (1) the percentage of participants with primary school as highest attained educational level per neighbourhood, (2) the percentage of participants with the main breadwinner in occupational class V (unskilled manual workers) per neighbourhood, and (3) the percentage of unemployed participants per neighbourhood. These rankings were summed and quartiles were constructed. Hence, the first and fourth quartile of the neighbourhood socioeconomic environment consisted of the 25% neighbourhoods with the lowest and highest summed ranks (neighbourhoods with the most and least favourable socioeconomic environment, respectively).
For this study, indicators for other neighbourhood characteristics were selected from two additionally available datasets (please see below), which were mentioned in the literature as urban stressors with a chronic character (that is, comparatively enduring problems and threats that people face in their daily life17), and for which there was some empirical evidence that they can act as stressors. Four neighbourhood stressors were included in the analysis: (1) the quality of the physical neighbourhood environment (physical decay),18,19 (2) the required police attention in neighbourhoods,19 (3) the population density level in neighbourhoods,18 and (4) noise pollution from traffic.20,21
Information on the quality of the physical environment, police attention required, and noise pollution from traffic were obtained from a policy oriented survey. Around the time of the baseline survey for the GLOBE study (1992/1993), a core group of representatives of municipal services responsible for functional, physical, and social conditions of the city developed a plan to monitor these conditions for policy purposes. They identified relevant functional, physical, and social characteristics to be monitored, and developed a policy oriented survey in close collaboration with responsible municipal services. For these characteristics (Likert type) scales (ranging from 1 to 5) were developed for each characteristic, based on policy relevant criteria. Professionals from municipal services responsible for these characteristics filled in the survey. From this information, we developed an indicator of the quality of the physical environment by taking the mean of (a) the structural conditions of the houses in the neighbourhood, (b) quality of the streets, (c) quality of the sewerage, and (d) the quality of green facilities. The required police attention and noise pollution from traffic in neighbourhoods was derived from single questions in the policy survey. Appendix 1 presents more detailed information about the survey methodology and survey questions in this policy survey. The population density in neighbourhoods, defined as the number of residents divided by the total surface (in km2) of the neighbourhoods was calculated using a database of the city municipal statistics division, including routinely collected statistical information. Both databases were linked to the GLOBE database, using a neighbourhood code assigned by Statistics Netherlands.
To test the role of urban stress as a concept, an overall neighbourhood stress score was included, and subsequently the role of separate characteristics was explored. For the development of the overall neighbourhood stress score, all characteristics were included in a principal component analyses. The neighbourhood physical environment, the required police attention, and the population density loaded about equally strong on the first component; noise pollution from traffic mainly loaded on the second component (results not tabulated). A simple summary score was developed based on tertiles of indicators of the first component (the physical environment, police attention, and population density). Values ranged from 3 (a neighbourhood in the most disadvantaged tertile for all three factors) to 9 (a neighbourhood in the most advantaged tertile for all three characteristics). Noise pollution from traffic was included as a separate neighbourhood characteristic. Results for these characteristics were essentially similar as compared with the results based on the components of the PCA. For simplicity, the summary stress score and noise pollution from traffic are presented, instead of the components.
Individual factors
Indicators of individual level SEP and smoking were asked for in the postal questionnaire. From information about the highest obtained level of education four groups were constructed: (1) primary education, (2) lower vocational and intermediate secondary schooling, (3) intermediate vocational schooling and higher secondary schooling, (4) higher vocational schooling and university. Educational level has proved to be a good indicator of SEP in the Netherlands.22 Information about the occupational level of the main breadwinner was classified in five groups by using the Erikson, Goldthorpe, Portocarero (EGP) classification.23 Information about employment status was divided in six groups including a category of unemployed. In analyses on individual level socioeconomic inequalities only data for education are presented, but result for the other indicators are essentially similar.
Problems with meeting ends financially were measured by a single item question with three answer categories (no problems, some problems, or many problems).
From a closed question on smoking behaviour, two groups were distinguished: current smokers compared with never or former smokers. From current smokers additional information was collected about the age of smoking initiation and the average amount of cigarettes smoked daily.
Statistical analyses
In most analyses, logistic regression analyses were carried out. Because of the hierarchical structure of the data, multilevel random intercept models were fitted.24 Firstly, smoking behaviour was regressed on (a) quartiles of the neighbourhood socioeconomic environment (adjusted for age, sex, and individual level SEP) and (b) education (adjusted for age, sex, and the neighbourhood socioeconomic environment). Subsequently, the independent association of the neighbourhood stress score, separate neighbourhood stressors and problems with meeting ends financially with smoking was assessed. Ecological correlation coefficients with continuous scores were calculated to assess the association between the neighbourhood socioeconomic environment and neighbourhood stressors. Finally, the neighbourhood stress score, separate characteristics and problems with meeting ends financially (if associated with smoking and related to the neighbourhood socioeconomic environment) were introduced into a model already containing the neighbourhood socioeconomic environment and the individual level SEP. The reduction in the odds ratios for quartiles of the neighbourhood socioeconomic environment score (and education) was interpreted as the contribution of the variables introduced in the model to the neighbourhood and individual socioeconomic inequalities in smoking.
Finally, interaction terms were included between the neighbourhood socioeconomic environment and age, sex and individual level indicators of SEP, to explore if neighbourhood inequalities differed by subgroups of sociodemographic and socioeconomic factors. The Wald test and confidence intervals were used to evaluate the significance of these interaction terms.24
RESULTS
Prevalence rates of smoking increased from 31.6% in the most advantaged to 41.3% in the most disadvantaged quartile of neighbourhoods (table 1). The average amount of cigarettes smoked daily by current smokers varied between 15.5 and 16.5, and did not differ significantly between the quartiles of neighbourhood socioeconomic environment. Smokers in the most disadvantaged neighbourhoods started smoking significantly earlier in their lives compared with smokers in the most advantaged neighbourhoods (mean ages being 17.3 years and 18.2 years, respectively).
Descriptive statistics by neighbourhood socioeconomic environment
Adjusted for age and sex, living in neighbourhoods with the worst compared with the best socioeconomic conditions was associated with an increased probability of smoking (odds ratio 1.68, 95% CI 1.42 to 1.98) (table 2). Additional adjustment for education, occupation, and employment status attenuated the odds ratio substantially, but the probability of smoking remained significantly increased in the most disadvantaged neighbourhoods (odds ratio 1.24, 95% CI 1.05 to 1.46). The educational gradient in smoking seemed to be larger than the gradient for the neighbourhood socioeconomic environment (odds ratio in the lowest compared with highest educational group 2.33, 95% CI 2.02 to 2.70). The gradient attenuated after adjustment for the neighbourhood socioeconomic environment, but remained steeper than at the neighbourhood level (odds ratio in the lowest educated group 1.96, 95% CI 1.65 to 2.33).
Odds ratios (and 95% confidence intervals) of smoking by neighbourhood socioeconomic environment and by education in men and women in the GLOBE study, the Netherlands, 1991
Adjusted for age and sex, living in the neighbourhoods with the highest stress score was associated with an increased probability of smoking (odds ratio 2.31, 95% CI 1.69 to 3.17, not tabulated). Additional adjustment for the individual level indicators of SEP attenuated the odds ratios, while further adjustment for the neighbourhood socioeconomic environment resulted in a modest attenuation. However, the odds ratio in the neighbourhoods with the highest stress score remained significantly increased (odds ratio 1.57, 95% CI 1.11 to 2.21).
Using separate characteristics of the stress scores showed no association between the quality of the physical living environment and the probability of smoking. Increased odds ratios of smoking were found for participants in neighbourhoods with increased police attention required and with a higher population density as compared with the neighbourhoods in the reference group. Adjustment for the neighbourhood socioeconomic environment attenuated odds ratios slightly, with only a significantly increased probability of smoking for those in the most densely populated neighbourhoods (odds ratio 1.28, 95% CI 1.00 to 1.46). Furthermore, the probability of smoking was higher in people living in the neighbourhoods with the highest noise pollution from traffic, even after adjustment for the neighbourhood socioeconomic environment (odds ratio 1.17, 95% CI 1.01 to 1.36). At the individual level, those who reported many financial problems were more likely to smoke as compared with those reporting no problems meeting ends financially and this association was independent of the neighbourhood socioeconomic environment (odds ratio 3.05, 95% CI 2.46 to 3.79).
For the factors related to smoking, the ecological relation with the neighbourhood socioeconomic environment was explored. Using a one way analysis of variance technique, the mean stress score significantly decreased with increasing neighbourhood socioeconomic environment (F = 14.71, 3 df, p<0.00). An increasing neighbourhood socioeconomic disadvantage was associated with an increasing police attention required (r = 0.50, p<0.001), a larger population density (r = 0.56, p<0.001), and an increasing percentage of participants reporting many problems meeting ends financially in neighbourhoods (r = 0.58, p<0.001). There seemed to be however, no association with noise pollution from traffic (r = 0.00, p = 0.99).
Adjusting the association between the neighbourhood environment and smoking for the neighbourhood stress score resulted in a substantial reduction of the odds ratios, which were no longer statistically significant (table 4). Adjusting the same association for the required police attention and for the population density separately showed that both characteristics contributed about equally large to the neighbourhood socioeconomic inequalities in smoking. Adjusting the association for problems with meeting ends financially affected the odds ratios of smoking by the neighbourhood socioeconomic environment only moderately. The educational inequalities attenuated moderately after adjustment for the neighbourhood stress score, or the separate characteristics. Problems with meeting ends financially contributed more substantially to these inequalities.
Odds ratios (and 95% confidence intervals) of smoking by neighbourhood and individual characteristics in men and women in the GLOBE study, the Netherlands, 1991
Effect of adjusting the association of the neighbourhood socioeconomic environment and education with smoking by individual and neighbourhood characteristics in the GLOBE study, the Netherlands, 1991
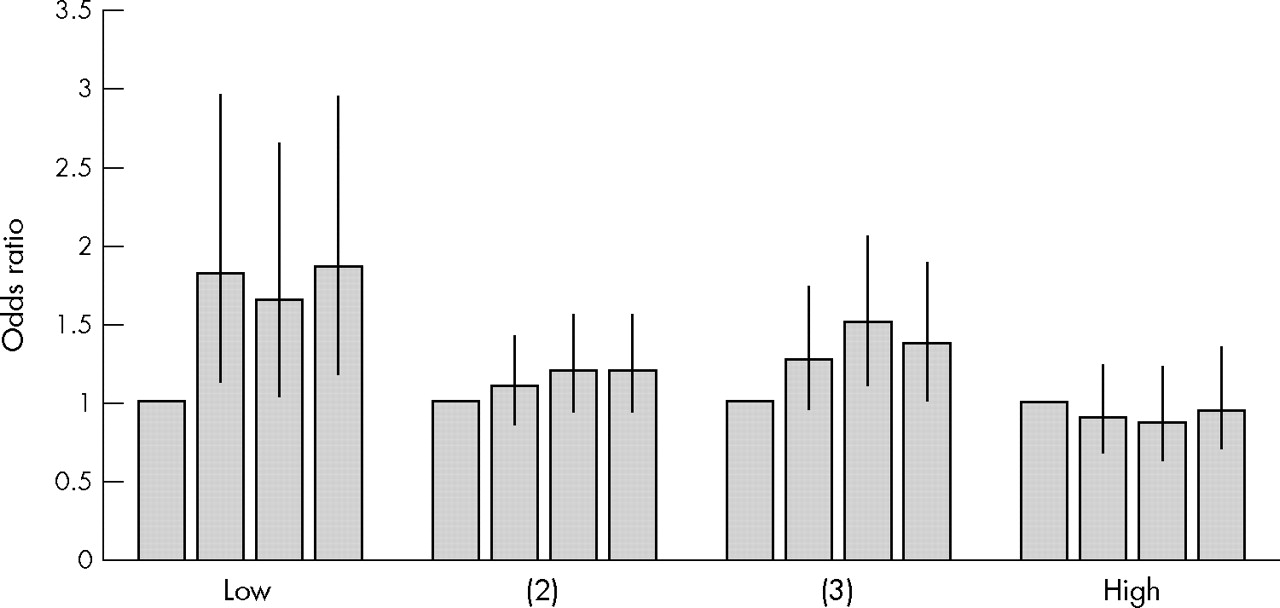
Finally, interaction effects were found between the neighbourhood socioeconomic environment and education. Stratified analyses by individual educational level showed that the probability of smoking for participants in more compared with the least disadvantaged neighbourhoods was highest for the lowest educated participants (fig 1). The odds ratio for the lowest educated persons residing in the most compared with the least disadvantaged neighbourhoods was 1.86 (95% CI 1.18 to 2.93). Adjustment for problems with meeting ends financially did not mediate this association (odds ratio = 1.84, 95% CI 1.16 to 2.92) but required police attention and population density did to some extent (odds ratio = 1.76, 95% CI 1.07 to 2.89).
Odds ratios (and 95% confidence intervals) of smoking by neighbourhood socioeconomic environment in the GLOBE study, the Netherlands, 1991, stratified by education.
What this paper adds
This paper adds to understanding neighbourhood variation in smoking. While scarce knowledge on this topic was thus far concentrated on differential exposure to advertisements and tobacco availability, this study showed that physical stressors from the neighbourhood—often beyond control of the person—are related to smoking. As far as to our knowledge, it is the first international paper showing that “objectively” measured neighbourhood stressors mediate neighbourhood and individual socioeconomic inequalities in smoking.
DISCUSSION
This study confirmed that living in more compared with less socioeconomically disadvantaged neighbourhoods increases the probability of smoking, even when taking into account the socioeconomic composition of the neighbourhoods. Physical neighbourhood stressors are associated with smoking. They contributed substantially to the neighbourhood inequalities, and modestly to individual socioeconomic inequalities in smoking.
Several methodological remarks need to be made to the study. Firstly, we assumed a causal mechanism to be operating; however, our cross sectional design prohibits us from making causal inferences. Secondly, information on smoking was self reported. This is threatening the validity of our results if misclassification occurs by individual level socioeconomic factors, on which we also based our measure of the neighbourhood socioeconomic environment. Available evidence however, suggests no such differential misclassification.25 Thirdly, former smokers and never smokers were collapsed into one group and compared with current smokers. The consequences of this collapse were explored, and it was found that it did not influence the results, because former smokers were evenly distributed across the quartiles of the neighbourhood socioeconomic environment. Fourthly, indicators of the neighbourhood socioeconomic environment were aggregated from individual level socioeconomic indicators of study participants. For the percentage of unemployment information from all neighbourhood residents was also available in the database of the statistical division of Eindhoven municipality; a high correlation between our aggregated indicator of unemployment and the “objective” indicator derived from the city municipality (r = 0.71, p<0.01) was found. Moreover, Reijneveld used other indicators of the neighbourhood socioeconomic environment, and found similar associations as we did in the city of Eindhoven.26 Fifthly, information about the neighbourhood characteristics was partly derived from a survey, which was not explicitly developed for research purposes, and there is no information available about their psychometric quality. Because the evaluation of the characteristics was done by professionals of municipal services responsible for (maintenance of) characteristics throughout the city, differential misclassification by the neighbourhood socioeconomic environment does not seem likely, but can also not be excluded. Finally, our sample did not include ethnic minorities. It is known that ethnic minorities are comparatively often in lower socioeconomic groups, and that smoking prevalence among some ethnic groups in the Netherlands is higher.27 Although this does not need to affect the associations presented, it may limit the external validity of the results to the autochthon population.
Policy implications
The findings of this study suggest that initiatives to reduce neighbourhood and (to a lesser extent) individual socioeconomic inequalities in smoking need to consider the neighbourhood context in which people smoke. Particularly, policies aimed at reducing physical neighbourhood stressors in socioeconomic disadvantaged neighbourhoods may shape a context in which people are less likely to smoke.
Based on the findings of Stead et al10 neighbourhood characteristics presumably causing stress were selected. We also explored a mediating role of the proximity of recreation facilities, but found that these characteristics were equally distributed by the neighbourhood socioeconomic environment.28 The contribution of problems meeting ends financially to neighbourhood inequalities in smoking seemed to be small, perhaps because its role was largely captured by the individual level indicators of socioeconomic position. It would have strengthened our analyses if other individual level factors, such as caring responsibilities10 and health problems of relevant others, could have been also included.
There are only few comparable studies with some conflicting results. Steptoe and Feldman developed a questionnaire with neighbourhood problems as sources of chronic stress.21 They found an association of neighbourhood problems with poor self rated health, but not with smoking. A methodological remark to this study is the low response rate (29%), which may have resulted in selective group of respondents. A conceptual difference is that this study measured perceived neighbourhood problems, where we measured more objective neighbourhood characteristics. A study also using objective data (that is, data from existing registrations) found some evidence that smoking was more prevalent in high crime areas in women.6
Associations between the neighbourhood socioeconomic environment and smoking were stronger for those in the lowest individual level socioeconomic groups. It is not unlikely that characteristics of the area expose persons to feelings of limited control over life. Stronks et al showed a contribution of perceived control to educational inequalities in smoking behaviour.12 Thus, same levels of stress may have different effects on socioeconomic groups because of other perceptions and coping strategies. Inclusion of such intermediate factors at the individual level should permit further exploration of this pathway. Another explanation is that daily life in lower socioeconomic groups is perhaps more concentrated in and around the neighbourhood, which increases exposure to the unfavourable neighbourhood living circumstances. Finally, smokers in more compared with less socioeconomically disadvantaged neighbourhoods started smoking significantly earlier, and the age of smoking initiation explains partly why lower educated persons continue smoking more often than higher educated persons.29
In addition to a mechanism via stress, other processes may operate as well. Smoking may be “contagious”8: in neighbourhoods with a high prevalence of smoking it is perhaps more accepted to start smoking, where it may be more difficult to stop smoking. Furthermore, neighbourhoods may differ in the availability of selling points of cigarettes and in tobacco advertisement. It has been shown that the number of billboards with smoking advertisements is higher in more disadvantaged neighbourhoods.30–32
This study is among the first to include neighbourhood characteristics in the explanation of neighbourhood inequalities in smoking behaviour. Given the methodological and conceptual issues mentioned above, our results need to be confirmed in other studies. Preferably, such studies should use a longitudinal design, include objectively measured as well as by residents perceived neighbourhood characteristics and include individual level factors, which may link the neighbourhood characteristics to smoking behaviour. Because the neighbourhood socioeconomic environment is associated with the probability of smoking, in particular in lower socioeconomic groups, intervention studies aimed at investigating ways to reduce (socioeconomic inequalities in) smoking prevalence could be conducted in socioeconomically disadvantaged neighbourhoods, and targeting of both individual and neighbourhood characteristics should be considered. Community based intervention studies may be particular suitable for this purpose, even though previous community based studies in deprived settings have shown little evidence thus far.33 In these studies, the emphasis of interventions was on the social context. Our study suggests that the physical context in which persons live also contributes to smoking, and therefore intervening on this context is important to consider in community based interventions. Finally, our study shows that individual level socioeconomic inequalities in smoking should be explained by including factors beyond the individual context. This context should include the neighbourhood, but other settings (for example, the household environment34) seem important as well.
APPENDIX 1: MEASUREMENT OF NEIGHBOURHOOD CHARACTERISTICS FROM POLICY ORIENTED SURVEY
Information on neighbourhood characteristics were derived from a survey, developed for and used by policy makers in the city. Professionals of the municipal services responsible for the characteristics scored all characteristics. To obtain a detailed overview, survey characteristics were scored for clusters within neighbourhoods by the professionals. Clusters were defined as units that were comparatively homogeneous in terms of types of housing (one family housing compared with “more” family houses) and house ownership (rented compared with owned); they had on average 250 residents. For the analysis in this study, we aggregated the cluster scores of the characteristics to the neighbourhood level, thereby weighting the contribution of each cluster to the neighbourhood score by the number of persons living in these clusters. From these continuous neighbourhood scores, we constructed tertiles.
Information about the quality of the physical living environment was derived from this survey survey. We calculated the mean of (a) the structural conditions of the houses in the neighbourhood (1 = total quality is bad, 5 = houses of equivalent quality and younger than 20 years), (b) quality of the streets (1 = bad quality, 5 = re-paved after 1985, (c) quality of the sewerage (1 = bad, 5 = restored or constructed after 1985). and (d) the quality of green facilities (1 = bad, difficult to keep good, 5 = high quality).
Information about safety was derived from a question in the survey about the required police attention in neighbourhoods, with the following answer categories:
-
Area that regularly requires very special attention
-
Area that requires additional attention
-
Area that can be controlled with normal attention
-
Quiet area with very incidental problems of external causes
-
Very quiet area with hardly any conflicts
Information about noise pollution from traffic was derived from a question in the survey with the following answer categories:
-
Structural inconvenience because of traffic/transport function
-
Reduced inconvenience because of traffic/transport function
-
Acceptable level of noise
-
Almost entire neighbourhood outside sources of noise
-
Entire neighbourhood outside sources of noise
Acknowledgments
The GLOBE study is carried out by the Department of Public Health of the Erasmus Medical Centre Rotterdam, in collaboration with the Public Health Services of the city of Eindhoven and region south east Brabant.
REFERENCES
Footnotes
-
Funding: this study is supported by grants of the Ministry of Public Health, Welfare and Sport and the Health Research and Development Council (ZON). FvL is supported by a grant from the Netherlands Organisation for Scientific Research (NWO grant number 904-66-104).
-
Conflict of interest: none.
Linked Articles
- In this issue