Article Text

Abstract
Objective: To examine the associations of childhood and adult measurements of socioeconomic position with coronary heart disease (CHD) risk.
Methods: Cross sectional and prospective analysis of a cohort of 4286 British women who were aged 60–79 years at baseline. Among these women there were 694 prevalent cases of CHD and 182 new incident cases among 13 217 person years of follow up of women who were free of CHD at baseline.
Results: All measurements of socioeconomic position were associated with increased prevalent and incident CHD in simple age adjusted models. There was a cumulative effect, on prevalent and incident CHD, of socioeconomic position across the lifecourse. This effect was not fully explained by adult CHD risk factors. The adjusted odds ratio of prevalent CHD for each additional adverse (out of 10) lifecourse socioeconomic indicator was 1.11 (95% confidence interval: 1.06, 1.16). The magnitude of the effect of lifecourse socioeconomic position was the same in women who were lifelong non-smokers as in those who had been or were smokers.
Conclusion: Adverse socioeconomic position across the lifecourse increases CHD risk cumulatively and this effect is not fully explained by adult risk factors. Specifically in this cohort of women cigarette smoking does not seem to explain the association between adverse lifecourse socioeconomic position and CHD risk.
- CHD, coronary heart disease
- SEP, socioeconomic position
- HOMA, homoeostasis model assessment
- coronary heart disease
- lifecourse epidemiology
- socioeconomic position
Statistics from Altmetric.com
Socioeconomic position (SEP) across the lifecourse influences coronary heart disease (CHD) risk, with childhood SEP and adult SEP each independently contributing to increased risk.1–5 Most previous studies have been on men only and it is possible that associations will differ in women.6 For example, the association between early life adverse SEP and future CHD risk may be in part mediated via lifestyle risk factors such as smoking and diet. It is conceivable that the effect of childhood SEP on the adoption of these behaviours will differ between men and women. Thus there is a need to examine these associations in women. In addition, an important limitation of earlier studies is that they have assessed just one or two measures of SEP at each stage of the lifecourse—commonly occupational social class.
There are three reasons why assessing a number of different measures of SEP across the lifecourse might be important. Firstly, societies are stratified in multiple ways that lead to degrees of economic, political, social, and cultural advantage. Although rarely defined in epidemiology papers, Krieger and colleagues define socioeconomic position as “an aggregate concept that includes both resource-based income, wealth, education and prestige-based rank in the social hierarchy measures”.7 Three important dimensions of socioeconomic position—social status or prestige, material resources, and employment relations and conditions—have been identified in the literature.7,8 With the exception of a small number of theoretically based and validated measurements, such as the Erikson-Goldthorpe schema that measures employment relationships, most measurements of SEP will act upon health outcomes through a number of direct and indirect pathways.9 A single measure is unlikely to provide a full assessment of SEP either at one point in time or across the lifecourse and therefore both in terms of providing an estimate of the effect of lifecourse SEP on disease outcomes, and when one wishes to take account of the potential confounding effect of lifecourse SEP, a number of measurements are likely to be required. Historically occupation has been selected as the principal component of SEP, because it has been regarded as encompassing a number of domains. Occupation gives some indication of probable working conditions, facilities available, risk of intermittent unemployment, as well as remuneration—which in turn is associated with family living standards and access to material goods.10 However, father’s occupation may not fully encompass all domains of SEP in childhood. While fathers occupational class will clearly provide some information on material resources and family social status, other measures are likely to be necessary to provide a full assessment of early life SEP and how this will have an impact on later ill health.
Secondly, although different measures of SEP will each describe something of the social and economic stratification of a population, they may also have specific direct effects on health outcomes. There is evidence that different measurements of SEP in adulthood are not interchangeable in their relation with health outcomes,11 and this is likely to also be the case for measurements of SEP in childhood. For example, certain parental occupations may result in passive exposure to toxic chemicals in children, which have a lasting effect on future health, while the lack of running hot water and household crowding may have direct effects in increasing risk of childhood infections. While the measurements of SEP that we use in this study are not theoretically based in the way that the Erikson-Goldthorpe schema is,9 we set out a priori the dimensions of SEP that each is likely to represent based on Krieger and colleagues theoretical discourse on SEP as discussed above and the other pathways (direct and indirect) through which each measurement is likely to affect CHD (see table 1). Comparing the nature and magnitude of effect of different childhood measures of SEP on adult CHD risk may, therefore, provide clues about the mechanisms by which CHD risk is modified by socially patterned exposures acting over the lifecourse. For example, as education is influenced by material resources, parental social status, and living circumstances it can be considered a measure of SEP. However, it has also been argued that education is more appropriately considered as a mediator for the effects of early life SEP. To some extent this conceptualisation of education will be driven by available data, in that studies with no other measurement of childhood SEP may use it as an indicator of SEP. Studies, as in our case, that have information on other measurements of childhood SEP are in a position to explore how much of the effect of these other measures is explained by adjustment for education. Thus again providing some information on potential mechanisms.
Theoretical underpinning and potential mechanisms of action on CHD of each measurement of socioeconomic position examined in this study
Finally, even when two or more indicators of SEP are essentially measuring the same underlying factor, because of inevitable measurement imprecision additional measures will reduce the degree of measurement error inherent in the use of a single measurement.
The aims of this study, therefore, are to examine the association of a number of measurements of SEP from across the lifecourse with adult CHD risk (to find out if associations between different measurements of SEP can provide insights into the mechanisms linking SEP and CHD) and to examine their cumulative effect (to provide a fuller representation of the magnitude of association between lifecourse SEP and CHD than that provided by the use of just one or two measures of SEP).
METHODS
Data from the British women’s heart and health study were used. Full details of the selection of participants and measurements used in the study have been previously reported.12 Between 1999 and 2001 4286 (60% of those invited) women aged 60 to 79 years, who were randomly selected from 23 British towns were interviewed, examined, completed medical questionnaires, and had detailed reviews of their medical records.12 These women have been followed up over a median of four years by flagging with the NHS central register for mortality data and two-yearly review of their medical records. Medical record reviews and flagging with the NHS central register is complete for all participants. Local ethics committees’ approvals were obtained for the study.
Methods used at baseline assessment have been previously described.12 Prevalent CHD at baseline was defined as a woman with either of the following: (a) a medical record of a myocardial infarction, angina, coronary artery by pass, or angioplasty; (b) self report that they had ever been diagnosed by a doctor as having a heart attack or angina.12 Further validation against WHO criteria was ascertained by additional medical record review for those with an indication of a myocardial infarction (WHO criteria = at least two out of three of typical chest pain lasting at least 30 minutes, raised cardiac enzymes, diagnostic ECG changes). As previously reported there was a large degree of overlap between those identified through self report and those identified through their medical records.12 Including both self reported and those from medical records provides greater assurance that all with baseline disease have been excluded in the prospective analyses. Incident cases of CHD in women who were free of prevalent CHD at baseline were defined as either of: (a) death with an underlying or contributing cause of CHD (ICD10 codes I20–I25, I51.6); (b) a myocardial infarction (fulfilling WHO criteria), diagnosis of angina or coronary artery by pass or angioplasty identified in the follow up medical record review—occurring in the follow up period up until 1 June 2004.
Data on SEP across the lifecourse were obtained from baseline questionnaires and included data on the longest held occupation of the participant’s father during her childhood, childhood household amenities (bathroom, hot water, bedroom sharing, and car access), age at completion of full time education, the longest held occupation of the participant and her spouse, adult housing tenure, car access, and pension arrangements. Childhood occupational social class of the women was based on their fathers’ longest held occupation and adult (head of household) occupational social class was based on their husbands’ longest held occupation, or their own for single women and for women whose occupation was of a higher social class than their husbands. Adult and childhood social class were defined according to the registrar general’s classification of occupations (a hierarchical classification: I, II, III non-manual, III manual, IV, V—with I (highest SEP) being professional occupations and V (lowest SEP) being manual unskilled occupations). Age at leaving full time education was classified into four categories: <15 years (lowest SEP), 15–17 years, 18–21 years, >21 years (highest SEP). These categories represent women leaving at or before the legal minimum age for leaving full time education, those receiving some secondary education, those who completed secondary education, and those who completed further or higher education. Response options for adult housing tenure were owner occupied (owned outright or through a mortgage); private rented; living with relatives; council (public) rented; other. In these analyses in those who reported living in “other” accommodation (n = 16) were excluded and the hierarchy of SEP was assumed to be from owner occupied (highest SEP), through private rented, living with family to public rented (lowest SEP). In a sensitivity analysis those living with family (n = 75) were excluded. The results did not differ from those presented here. Response options for the question concerning pension arrangements were state pension only (lowest SEP), occupation and state pension, private and state pension, both occupation and private as well as state pension (highest SEP). In the main analyses presented here this order was used as the hierarchy. In a sensitivity analysis we changed the order of the two central categories—that is, we assumed private and state pension to be lower in the hierarchy than occupational plus state pension. The results from this analysis did not differ substantively from those presented here. All other SEP variables were binary. As we were interested in whether differences in the magnitudes of associations of each measurement of SEP could provide information about the mechanisms linking SEP to CHD we considered the possible indirect and direct effects of each measurement; these are described in table 1.
For each measure of SEP an index of inequality was derived. This takes account of differences in the proportions of participants in each category for the different measures. This simplifies comparisons between different measures of SEP, which are all put onto the same scale, and estimates based on the index of inequality are less influenced by extremes of the exposure distribution.13–15 A score from 0 to 1, the highest and lowest SEP respectively, was derived for each measure based on the midpoint of the proportion of the population in each category. For example, if 10% of the women were in the highest occupational social class (I) and 15% were in the next highest category (II), women in the first category would be assigned a value of 0.05 (0.10/2) and those in the second category a value of 0.175 (0.1+0.15/2) and so on for each category. The relative index of inequality is then obtained by regressing each of these SEP scores on the outcome. The virtue of this index is that it is directly interpretable in terms of outcome difference between the lowest (score 1) and highest (score 0), of which independent SEP indicator is used.13–15
The cumulative effect of lifecourse SEP was examined by generating a lifecourse SEP score from the 10 indicators. To generate the SEP score we dichotomised those indicators that were not binary as follows: adult and childhood social class into non-manual (I, II, III non-manual) and manual (III manual, IV, V); pension arrangements into state only or state plus other (employment or private pension); adult housing tenure into local authority (social housing) or other (owner occupied, private rental, living with a relative) and age at leaving full time education into those leaving school at or younger than 15 years, or above that age. Two scores were developed, one in which equal weight was give to each indicator and another in which inverse of prevalence weights were used. The first score has the advantage of being easy to understand as the score gives the actual number of adverse indicators. The score ranged from 0 (most advantaged position across the lifecourse) to 10 (most disadvantaged position across the lifecourse). Because there were very small numbers in the 0 category (n = 77) and in the 10 category (n = 57) the 0 category was combined with the 1 category and the 10 category with the 9 category. The second score in which each indicator was weighted by the inverse of its prevalence gave greatest weight to adverse indicators that were least prevalent, and as such may be thought of as being more severe indicators of adverse SEP (for example, if just 10% of the sample have no car access in childhood this indicator is given more weight as an indicator of adverse SEP than for example father being in a manual social class, which was the case for most participants). The resulting weighted score was highly positively skewed with a range from 0 to 28.9. The two composite SEP scores showed similar linear trends in their association with CHD. Results for the unweighted score only are therefore presented.
Data on smoking (never, past, current—including those who said they had quit smoking in the six month period before assessment), frequency of alcohol consumption (daily or most days, weekends only, once-twice a month, special occasions only, never), and physical activity (⩽2, 2–3, ⩾3 hours per week of either moderate or vigorous activity) were obtained from the interview or questionnaires. Participants were coded as taking hypertensive drugs if they were currently using drugs listed in sections 2.2.1 (thiazide diuretics), 2.4 (β blockers), 2.5 (drugs affecting the rennin-angiotensin system and some other antihypertensive drugs), 2.6.2 (calcium channel blockers) of the British National Formulary (http://www.bnf.org/). As most of these drugs have multiple indications their use as antihypertensives was confirmed by a report from the participant at the research nurse interview that they had been prescribed the particular drug for hypertension. If they were unclear as to why they were taking a particular drug they were assumed to be taking it for hypertension. Blood samples were taken after a minimum six hour fast. These samples were used for assessment of insulin resistance (homoeostasis model assessment (HOMA) calculated from fasting insulin and glucose concentrations) and lipids. Blood pressure, height, and weight (used for calculating body mass index) were measured using standard procedures. Seated height was also measured and used to estimate leg length and trunk length. Leg length (the component of height specifically associated with CHD16,17) partly reflects childhood environmental exposures that influence childhood linear growth.18
Statistical analysis
Multiple logistic regression was used to assess the association of each SEP index of inequality, or binary measurement of SEP, and the cumulative SEP score with prevalent CHD and Cox proportional hazards models were used to assess similar associations with incident CHD. HOMA scores were not calculated for women with doctor diagnosed diabetes at baseline or in those whose fasting glucose ⩾7.0 mmol/l. To adjust for the full range of insulin resistance diabetes a categorical variable consisting of fifths of the HOMA score distribution and a sixth category of those with diabetes or a fasting glucose of ⩾7.0 mmol/l was created and entered into multivariable models as five indicator variables. The time scale used in the Cox proportional hazards models was age and assumptions of proportionality were assessed by examination of survival plots; these assumptions were not violated in any of the models.
HOMA scores and triglyceride concentrations were positively skewed but their logged values had normal distributions. Logged values of these variables were used in the regression models. When these variables were the outcome of a particular model the resulting coefficient was exponentiated to give a ratio of geometric means and the effect was presented as a proportionate (%) change. All analyses were conducted using Stata version 8.0 (Stata, TX).
RESULTS
Of the 4286 women who participated in the study 694 had CHD at baseline, giving a prevalence of 16.2 (95% confidence interval 15.1, 17.3%). Among surviving women who did not have CHD at baseline there were 182 new cases of fatal or non-fatal CHD among 13 217 person years of follow up giving a rate of 13.4 (95% confidence interval 10.9, 14.7) per 1000. All measurements of SEP from across the lifecourse were associated with each other (all p values <0.005). Table 2 shows the cross tabulations of each of the other measurements of SEP with childhood and adulthood occupational social class.
Cross tabulation of other measures of lifecourse socioeconomic position with childhood and adult occupational social class
Table 3 shows the age adjusted associations between indices of inequality for each of the childhood SEP measurements and CHD and CHD risk factors. All measures of childhood SEP were associated with prevalent CHD, such that those from the lowest SEP had the greatest odds of CHD. The magnitudes of these associations were similar for each childhood SEP measurement with no statistical evidence that any of the effects differed from one another (all p values >0.2). In general those from the lowest childhood SEP backgrounds had worse adult risk factor profiles, with associations with body mass index, HOMA scores, and triglyceride concentrations being consistent across all childhood SEP measurements and exhibiting strong associations. All measurements of adult SEP were also associated with prevalent CHD and most CHD risk factors, again the most consistent and strongest risk factor associations were with body mass index, HOMA scores, triglyceride concentrations, and for adult SEP measurements also waist to hip ratio (table 4).
Age adjusted odds ratios for coronary heart disease and coronary heart disease risk factors according to indices of inequality for different measures of childhood socioeconomic position
Age adjusted odds ratios for coronary heart disease and coronary heart disease risk factors according to indices of inequality for different measures of adulthood socioeconomic position
Each childhood measurement of adverse SEP was associated with shorter height, leg length, and trunk length (table 3). Father’s occupational social class, hot water supply in the childhood home, bedroom sharing, and age at leaving full time education were all more strongly associated with leg than trunk length (all p values for difference in effect estimates <0.01). With adjustment for adult smoking all associations between childhood SEP indicators and trunk length, but not leg length, attenuated to the null. Measurements of adult SEP also tended to have stronger associations with leg length than trunk length (table 4) although effect differences between the associations of adult SEP measurements with trunk length and those with leg length were small and none were statistically robust (all p values >0.2). Adjustment for smoking attenuated the associations between adult home ownership and pension arrangements and trunk length to the null but associations between adult occupational social class and car access remained essentially the same as the age adjusted associations presented in table 4.
Table 5 shows the associations between each measurement of childhood SEP and prevalent CHD with adjustment for potential mediating factors. These analyses are restricted to the 2951 (70%) women with complete data on all of the variables included in any model. These women did not differ from women without complete data with respect to age, CHD prevalence, or distributions of socioeconomic measurements (all p values >0.2) and the age adjusted associations shown in the first column of this table are consistent with those for all women shown in table 3. The associations between childhood measurements of SEP and prevalent CHD were attenuated with adjustment for all four measurements of adult SEP but associations remained with fathers’ occupational social class and age at leaving full time education. With additional mutual adjustment for each other, father’s social class, and age at leaving full time education remained independently associated with CHD: age, adult SEP, and education adjusted odds ratio for fathers’ occupational social class was 1.53 (95% CI: 1.00, 2.36) and the age, adult SEP, and fathers’ occupational social class adjusted odds ratio for age at leaving full time education was 1.71 (95% CI: 1.04, 2.82). Although imprecise family access to a car in childhood seemed to be associated with adult CHD, whereas there was pronounced attenuation of the associations of living in a house with a bathroom, living in a house with hot water, and sharing a bedroom on adjustment for adult measurements of SEP. Adjustment for adult behavioural and physiological risk factors and additional adjustment for adult components of height resulted in weak attenuation of the associations. Table 6 shows similar associations of childhood SEP with incident cases of CHD among those women with no CHD at baseline. Although less precise these results are broadly consistent with those found for the associations with prevalent CHD shown in table 5.
Association of indices of inequality for different measures of childhood SEP with prevalent coronary heart disease with adjustment for potential mediating factors
Association of indices of inequality for different measures of childhood SEP with incident coronary heart disease with adjustment for potential mediating factors
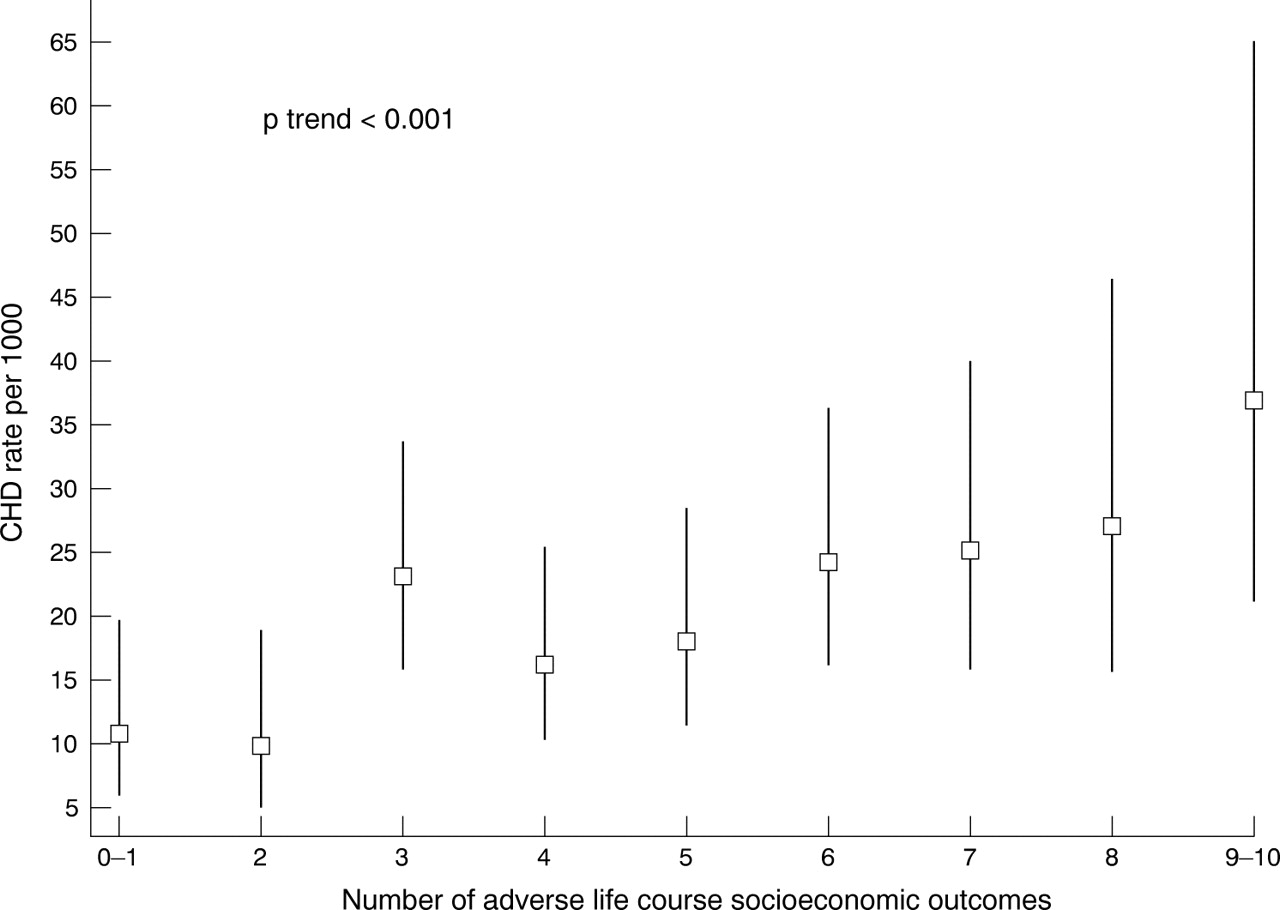
There was no evidence of interactions between any of the childhood measures of SEP with any of the adult measure of SEP (all p values >0.5). There was a cumulative effect of SEP from across the lifecourse such that both prevalent (fig 1) and incident (fig 2) CHD increased linearly with each additional adverse socioeconomic circumstance. For example, the prevalence of CHD ranged from 7.9% in those with 0−1 adverse SEP measurement to 23.8% among those with 9−10 adverse measurements. In simple age adjusted models the odds ratio of prevalent CHD for each increase of one adverse socioeconomic measurement was 1.15 (1.10, 1.20) on the sample with complete data on all covariates. With adjustment for behavioural and physiological risk factors this attenuated to 1.12 (1.07, 1.17) and with further adjustment for leg length it attenuated to 1.11 (1.06, 1.16). Among women with no baseline CHD the age adjusted hazards ratio of incident CHD was 1.11 (1.03, 1.20). With adjustment for behavioural and physiological risk factors this attenuated to 1.06 (0.98, 1.15) and with further adjustment for leg length to 1.04 (0.96, 1.13).

Age adjusted prevalence (95% CI) of coronary heart disease by number of adverse indicators of lifecourse socioeconomic indicators.

Age adjusted rate per 1000 (95% CI) of new cases of coronary heart disease (among those with no baseline disease) by number of adverse indicators of lifecourse socioeconomic indicators.
Sensitivity analyses among non-smokers
Of the 4286 participants 1961 (46%) were lifelong non-smokers and either single or had spouses who were lifelong non-smokers. Within this subgroup of women with little or no exposure to smoking the results were essentially the same as those presented in tables 3–6 and figures 1 and 2, although because of smaller numbers they were less precise. For example, the age adjusted odds ratio of prevalent CHD associated with an increase of one adverse lifecourse socioeconomic indicators (cumulative effect) in this subgroup was 1.11 (1.04, 1.19) and with full adjustment for adult risk factors and leg length this became 1.09 (1.02, 1.17).
DISCUSSION
We have examined the association between 10 measurements of SEP from across the lifecourse with CHD risk in a population of women. All 10 measurements were associated with increased risk of CHD in simple age adjusted models. There was a cumulative effect of SEP across the lifecourse with each additional adverse circumstance from 0 to 10 being associated with increased prevalence and incidence of CHD. This cumulative effect was not fully explained by adult CHD risk factors and leg length. The magnitudes of effects for each measurement were similar, thus our results did not suggest the exclusive influence of any specific mechanisms, as outlined in table 1, for the association between childhood SEP and CHD risk. However, the similarity of associations in women with little or no life time exposure to cigarette smoke signifies that the association between adverse lifecourse SEP and CHD is not largely explained by women from more adverse socioeconomic backgrounds being more likely to smoke. The effect of fathers’ occupational social class and age at leaving full time education were independent of each other, suggesting that education does not fully mediate the effect of general childhood social class on CHD risk.
Our results are broadly consistent with previous studies that have assessed the association of a single measure of childhood SEP, most commonly based on the participants father’s occupation, and CHD risk, which have found adverse circumstances to be independently, of adult SEP, associated with CHD risk.1,2,3,4,5,19,20,21 A study of a range of indicators of housing conditions in childhood (crowding, water supply, toilet facilities, ventilation, and cleanliness) that were assessed by field workers when the study participants were children found that most of these indicators, with the exception of an indoor water supply, were not associated with CHD mortality over 50 years of follow up.22 These findings are broadly consistent with our findings that childhood household amenities tended to be only weakly associated with CHD risk. These measures of household conditions—bathroom facilities, water supply, and crowding—could have a direct effect on CHD via childhood infections, with some evidence that Helicobacter pylori infection, which is largely contracted in childhood, is associated with CHD risk. However, the comparatively weak associations of these measurements compared with other measurements of childhood SEP in our study, together with the findings from a meta-analysis of the association between H pylori and CHD, which found weak effects in prospective studies,23 suggest that this is unlikely to be an important pathway to increased CHD risk.
What this paper adds
-
Previous studies have shown a cumulative effect of father’s occupational social class (an indicator of childhood socioeconomic position) and one’s own adult occupational social class on coronary heart disease risk in studies primarily of men.
-
We have extended this previous work by showing a cumulative effect on prevalent and incident coronary heart disease of 10 different measurements of socioeconomic position from across the lifecourse in women.
-
This effect is not fully explained by adult risk factors, and in particular was apparent in those women who had never smoked and who were either single or married to non-smokers. Thus the association between lifecourse socioeconomic position and coronary heart disease in women does not seem to be explained by smoking.
-
These findings emphasise the multidimensional nature of socioeconomic position and the importance in assessing the effect of socioeconomic position on health outcomes of considering a number of different measures from across the lifecourse.
Consistent with our results, other studies have shown a cumulative effect of SEP measures from across the lifecourse with CHD risk.1,2,3,4,5 Most of these studies used just one or two measures of SEP in each of childhood and adulthood and our study adds to this earlier work by showing strong linear trends of increasing CHD risk with each additional (out of 10) measurement of adverse SEP from across the lifecourse. Our results suggest that the cumulative lifecourse effect of SEP is largely independent of adult risk factors (although there was some attenuation with adjustment for these). Other studies suggest that the association between childhood and adult SEP may be mediated, in part, via adult CHD risk factors and had we measurements of these risk factors from earlier adulthood in addition to our one set of measurements in late adulthood it is possible that there would have been greater attenuation of the association. Would interventions aimed at reducing these risk factors in adulthood alleviate the adverse effects of socioeconomic adversity from across the lifecourse? Such an approach is unlikely to be effective because reducing established obesity in adulthood is difficult, and while treating high blood pressure is beneficial,24 treated and well controlled hypertensive adults still have a substantial excess mortality and reduced survival compared with normotensive people.25 Prevention of these risk factors in early life may be a more effective way of reducing the link between childhood SEP and CHD risk, but further research is required to establish whether this would be the case. Long term follow up of adult CHD risk factors and outcomes in trials that have attempted to alleviate childhood poverty (for example, evaluations of child welfare benefits, supplementary feeding, maternal benefits) would provide the strongest evidence of a causal link between SEP and CHD, and would also underpin health promotion policy. Of interest is our finding that the magnitude of the cumulative effect of lifecourse SEP is the same in women who are lifelong non-smokers as in women who have smoked, suggesting that the association in women is not explained by the effect of smoking.
As well as having important public health implications—highlighting the need to reduce inequalities in a number of aspects of SEP, including occupation, education, and material resources—our findings have implications for epidemiological studies examining the associations of CHD with exposures that are likely to be strongly socially patterned. We have previously shown how residual confounding by SEP across the lifecourse might explain the inconsistencies between observational epidemiological studies of hormone replacement26 and CHD and antioxidant vitamins and CHD,27 which at best adjusted for one or two adult indicators of SEP and largely unconfounded randomised controlled trial evidence.
Study limitations
Our most powerful analysis was cross sectional and while reverse causality as an explanation for the association between childhood SEP and adult CHD is implausible, survivor bias may be a problem. Mortality from CHD among women before the age of 70 years (mean age of women in this study) is uncommon, and therefore survivor bias is an unlikely explanation for our results. Furthermore, we did assess the associations prospectively over a median of four years of follow up and tried to minimise the potential of survivor bias in these analyses by excluding all women with baseline evidence of CHD. The results from these analyses were broadly consistent with those from the cross sectional analyses, although less precise because of smaller numbers. We used self report in adulthood of childhood SEP. This may be inaccurate and it is possible that adult SEP may affect the accuracy of reporting of childhood SEP. Thus replication of our results in prospective studies that do not use adult recall of childhood SEP would be valuable. As we do not have prospective measurements, but have asked about general exposures in childhood and in adulthood, we are unable to examine particular lifecourse models, such as whether there are critical or sensitive periods for the effects of adverse SEP. Our results are from a group of women who largely (99%) described themselves as white, while a study in women adds to previous knowledge based largely on cohorts of men, our results are not necessarily generalisable to other groups.
In conclusion, adverse SEP across the lifecourse increases CHD risk cumulatively. The prevention of socioeconomic inequalities in CHD needs to reduce these economic inequalities in early life as well as in adulthood. Fuller adjustment for socioeconomic confounding in studies of novel CHD risk factors requires more detailed information across the lifecourse.
Acknowledgments
The British women’s heart and health study is codirected by Shah Ebrahim, Debbie A Lawlor, Peter Whincup, and Goya Wannamethee. We thank Rita Patel, Carol Bedford, Alison Emerton, Nicola Frecknall, Karen Jones, Mark Taylor, Simone Watson, and Katherine Wornell for collecting and entering data; all of the general practitioners and their staff who have supported data collection; and the women who have participated in the study.
REFERENCES
Footnotes
-
Funding: we thank the (UK) Department of Health for core support to the British women’s heart and health study. Debbie A Lawlor is funded by a (UK) Department of Health career scientist award. The views expressed in this paper are those of the authors and not necessarily those of any funding body.
-
Conflicts of interest: none.