Article Text

Abstract
Study objective: Most studies of place effects on health have followed the multilevel analytical approach that investigates geographical variations of health phenomena by fragmenting space into arbitrary areas. This study examined whether analysing geographical variations across continuous space with spatial modelling techniques and contextual indicators that capture space as a continuous dimension surrounding individual residences provided more relevant information on the spatial distribution of outcomes. Healthcare utilisation in France was taken as an illustrative example in comparing the spatial approach with the multilevel approach.
Design: Multilevel and spatial analyses of cross sectional data.
Participants: 10 955 beneficiaries of the three principal national health insurance funds, surveyed in 1998 and 2000 on continental France.
Main results: Multilevel models showed significant geographical variations in healthcare utilisation. However, the Moran’s I statistic showed spatial autocorrelation unaccounted for by multilevel models. Modelling the correlation between people as a decreasing function of the spatial distance between them, spatial mixed models gave information not only on the magnitude, but also on the scale of spatial variations, and provided more accurate standard errors for risk factors effects. The socioeconomic level of the residential context and the supply of physicians were independently associated with healthcare utilisation. Place indicators better explained spatial variations in healthcare utilisation when measured across continuous space, rather than within administrative areas.
Conclusions: The kind of conceptualisation of space during analysis influences the understanding of place effects on health. In many contextual studies, viewing space as a continuum may yield more relevant information on the spatial distribution of outcomes.
- epidemiological methods
- logistic models
- multilevel analysis
- social environment
- spatial analysis
Statistics from Altmetric.com
The past decade has seen a growing interest in the effects places of residence have on health.1–4 Most contextual studies based on individual level data have followed the multilevel analytical approach (using the usual random coefficient multilevel models5,6 or alternating logistic regression7,8). In the multilevel analytical approach, measures of association between contextual factors and health have their standard errors corrected for the non-independence of people within areas.9 Furthermore, as Merlo has emphasised,10 multilevel models provide measures of variation based on random effects (such as area level variance or the variance partition coefficient) that inform us on the distribution of health outcomes across areas.11,12 This study aims to show that the multilevel analytical approach may fail to provide optimal epidemiological information for both measures of association and measures of variation in many analytical cases, because of dependence on a space fragmented into arbitrary administrative areas.
As a specific instance of the modifiable areal unit problem discussed in the field of geography,13–16 measures of variation in multilevel models are dependent on the arbitrary size and shape of the areas.17 More importantly for social epidemiologists, even if appropriate size and shape are considered, the usual multilevel models, in neglecting spatial connections between areas, treat them as if they were disconnected entities. Assuming independence for persons from different areas even if the areas are adjacent or nearby,9 the multilevel analytical approach fundamentally assumes that all spatial correlation can be reduced to within area correlation. Therefore, measures of variation in multilevel models may only provide partial information on the spatial distribution of health outcomes in quantifying the magnitude of correlation within areas but not the range of correlation in space.
To obtain epidemiologically relevant information such as the latter, we suggest building a more continuous notion of space into statistical models. This approach has been advocated in ecological studies for disease mapping,18–20 identification of clusters of disease,19,21 and implementation of spatial regression.22–28 However, there has been much less effort to incorporate a continuous notion of space in studies based on individual data.29–31 Some authors have modelled spatial variations of individual outcomes with non-parametric functions of the spatial location.32,33 Approaches of this kind, and others such as geographically weighted regression,34 do not provide the requisite parametric information of interest on the spatial distribution of outcomes. In any case, there has been almost no attempt to examine whether investigating variations across continuous space provides more relevant information than the multilevel approach in the social epidemiological field of contextual analysis.
To explain spatial variations of outcomes, beyond individual factors, authors consider contextual factors that are usually measured within administrative areas.1 However, people may be affected not only by the characteristics of their local administrative area of residence, but also by the context beyond these administrative boundaries, as their social activities may encompass a broader space.35 Therefore, we propose an approach for defining the social factors of the context that considers spatial neighbourhoods, defined as continuous spaces around individual places of residence, rather than territorial neighbourhoods arbitrarily defined by administrative boundaries.36–39
In France, geographical variations in healthcare utilisation operate on a larger scale than the administrative areas usually considered in multilevel analysis.40 Such variations, therefore, constitute a good instance of the need for considering space as a continuum, rather than fragmented into disconnected areas. In France, people can access directly specialist physicians without referrals and as frequently as they wish, and obtain partial or total reimbursement, depending on their insurance status. With regard to utilisation behaviour, although the underuse of specialty care may result in suboptimal diagnosis or treatment options,41,42 frequent self referral to specialists without regular recourse to a primary care physician (PCP) leads to a lack of coordination of care.43,44 We investigated whether the relative utilisation of PCPs or specialists could be linked to the availability of physicians (a determinant in convenience of geographical access) and to the socioeconomic level of the context (a factor that may affect healthcare utilisation through beliefs and expectations about the healthcare system).
Using a nationwide French survey sample, (1) we undertook a multilevel analysis of healthcare utilisation and examined whether there was spatial autocorrelation unaccounted for by multilevel models; (2) we investigated whether spatial models (such as spatial mixed models45) better accounted for geographical variability and provided more accurate information on the spatial distribution of healthcare utilisation than multilevel models; and (3) we explored measuring specific place characteristics across continuous space, rather than within administrative areas, to better explain spatial variability of behaviour.
METHODS
Datasets and outcomes
Our data came from the survey on health and health insurance conducted by the French Research and Information Institute for Health Economics (IRDES).46 Half of the sample was surveyed in 1998, the other half in 2000. The nationwide population sample is representative of the persons insured through the three main national health insurance funds (for salaried employees, farmers, self employed people, and retirees in these three categories—that is, 96% of the population). After approval by the French National Commission for Data Protection, survey data were merged with administrative files containing information on physician consultations for each person over a one year period.
Two complementary binary outcomes were examined. The first was derived from a question in the survey and showed whether or not each person had a regular PCP. Analysis of this outcome was restricted to those surveyed in 2000 (n = 5227), the only year in which this question was asked. The second binary outcome showed whether or not more than 50% of a person’s consultations over the course of the year had been with specialists, rather than PCPs. This outcome was computed from the administrative data on healthcare consumption and was successfully merged with the survey data for 9309 of 10 955 people. Analysis of this outcome was undertaken among people who had had at least one consultation over the one year period (n = 8102). We used a binary outcome because of the non-normality of the residuals in a multilevel linear model for the proportion of specialist consultations expressed in its continuous form, which also facilitated comparison with the model for the first binary outcome. Very similar results were obtained when cut offs other than 50% of specialist consultations were used to define the second binary outcome. After excluding people under 18 years of age, the final sample sizes were 5217 for the PCP analyses, and 8093 for analyses of the percentage of specialist consultations.
Municipality level data, including socioeconomic data (taken from the 1999 census) and information on the number of sites where physicians could be consulted (according to the ADELI database of the French Ministry of Health), were linked to the samples described above.
Explanatory variables
Definition of contextual indicators in administrative areas
Continental France is divided into 36 500 municipalities, or into 348 broad areas constituted by aggregating adjacent municipalities among all of which significant commuting occurs.47 In the dataset for the PCP outcome, 3233 municipalities and 338 broad areas were represented. In the dataset for the percentage of specialist consultations, 4421 municipalities and 340 broad areas were included. Considering areas in the latter dataset, the median population size was 2185 for municipalities (interquartile range: 794–6 533), and 98 495 for the broad areas (61 818–178 720). Municipalities in which people had been surveyed were distributed across all of France (fig 1).
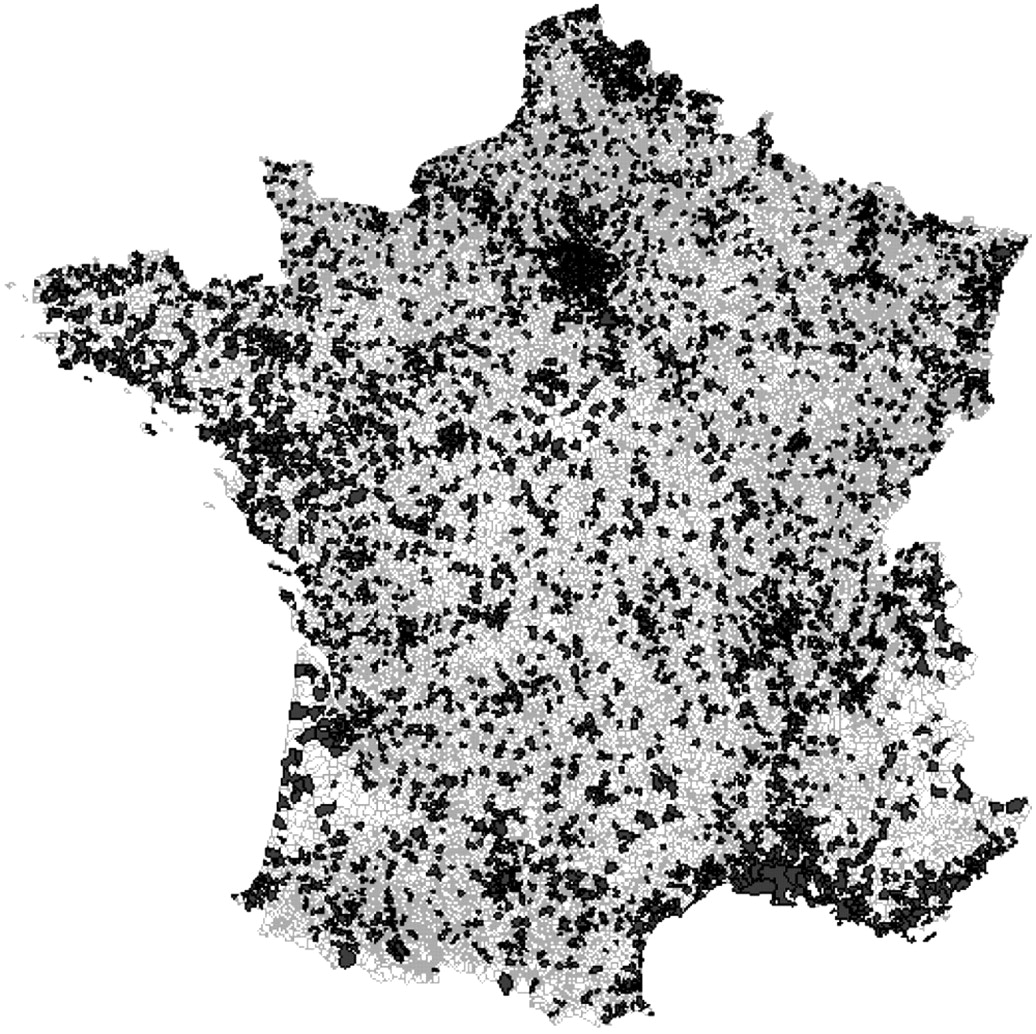
Distribution of municipalities in which people were surveyed. Individual information on healthcare utilisation was plotted across all of mainland France, providing adequate information for modelling variations across continuous space with spatial regression techniques.
We had no precise locational information other than municipality affiliation (discussed below). People were located at the centroid of their municipality when computing contextual factors across continuous space, but were randomly located within municipalities during spatial regression analysis (see appendices 1 and 2 for rationale).
At the level of administrative areas, the contextual factors investigated were one socioeconomic indicator (percentage of inhabitants with minimal education—that is, incomplete low secondary schooling or less) and the densities of PCPs and specialists (number of consultation sites per square kilometre). All these variables were computed at the municipality level and at the broad area level.
Contextual indicators measured across continuous space
The three contextual factors were also measured across continuous space surrounding each person’s place of residence.34,39 This procedure is described in detail in appendix 1. As illustrated at the bottom of figure 2, the measurement approach for the socioeconomic status of the context consists in positioning points on every kilometre of French territory, attributing to these points the socioeconomic characteristic of the municipality in which they are located, and then computing the socioeconomic contextual factor for each person as a weighted average of the contextual values for all points located around that person. In computing this average, we used weights to show that points at a greater distance from a person may affect that person less than points that are closer.34 Because of the weighting function used, our approach considers contextual information within a radius of about 35 kilometres of the persons, a space far exceeding the size of municipalities of residence. As illustrated in figure 2, this measurement across continuous space clearly differs from measures at either the municipality level or the broad area level.
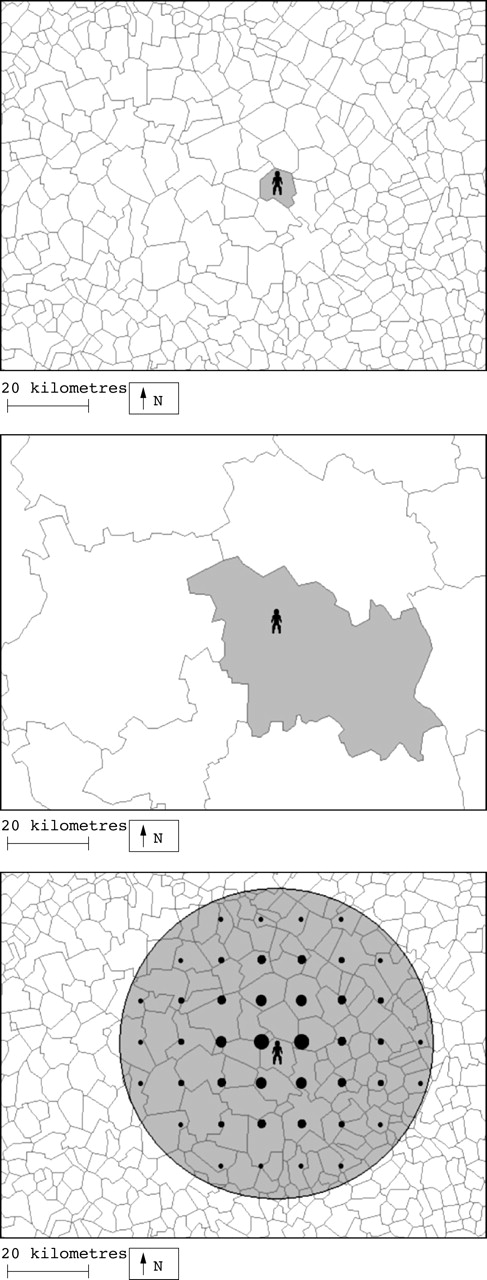
Measurement of the socioeconomic status of the context at the municipality level (above), at the broad area level (middle), and across continuous space (bottom). Measures across continuous space, computed as a weighted average of contextual information at surrounding points, take into account information over a much larger area than the municipality of residence. For ease of illustration, only one point every 10 kilometres (rather than every kilometre) is represented. The point size is a function of the weight value.
We also measured the supply of PCPs and supply of specialists across continuous space by computing the weighted number of consultation sites within a radius of 50 kilometres of a person’s residence, using weights to account for the fact that physicians at a great distance were less accessible than those closer (see appendix 1).
Individual level adjustment factors
Regression models were adjusted for health, demographic, and socioeconomic variables that have repeatedly been shown to be associated with healthcare utilisation (full details in table 1).
Individual level variables used as adjustment factors in regression models for healthcare utilisation, France, 1998 and 2000
Statistical analysis
To rigorously compare multilevel and spatial modelling approaches, the two level multilevel model described in appendix 2 was fitted separately in two different ways: first with municipalities as the second level units, and then with much larger areas—that is, the broad areas mentioned above, as second level units. An accurate estimate of random variations between areas was obtained by estimating the multilevel models with a Markov chain Monte Carlo method (MLwiN 1.2, Institute of Education, London). To see whether there was spatial autocorrelation unaccounted for by multilevel models, we used Bivand’s R software package48 to compute Moran’s I statistics for the area level residuals.32,49 In our case, the Moran’s I showed whether adjacent areas (that is, those sharing a common boundary) had more similar area level residuals than would be expected under spatial randomness. Moran’s I is roughly equal to 0 when there is no spatial autocorrelation and positive when there is clustering.
To model geographical variations across continuous space, we used geostatistical spatial mixed models that measure the correlation in healthcare utilisation between people as a decreasing function of the spatial distance between them (see appendix 2). These spatial mixed models were fitted with the SAS macro glimmix (version 8.02, SAS Institute, Cary, NC, USA). To compare the fit of the empty multilevel and spatial models, we refitted the multilevel models with glimmix. We used the scaled deviance to compare the different models. After including all individual level variables, contextual variables were added to the models, but were only retained if they were significantly associated with the outcomes in spatial mixed or multilevel models. We successively estimated place effects measured at the municipality level, at the broad area level, and across continuous space. To compare the different measures, each indicator was divided into quartiles.
The spatial perspective we propose comprises two different aspects: (1) utilisation of spatial mixed, rather than multilevel models, and (2) measurement of contextual factors across continuous space, rather than within administrative areas. Obviously, it is necessary to test these two aspects separately to assess their specific value in contextual analysis. Therefore, we estimated the multilevel models (either with people grouped within municipalities or broad areas) with contextual variables successively measured (a) within municipalities, (b) within broad areas, and (c) across continuous space. We then estimated separate spatial mixed models with these different contextual measures (municipality factors, broad area factors, measures across continuous space).
RESULTS
Twelve per cent of the participants reported they had no regular PCP, and 23% had gone to specialists for more than 50% of their consultations within a one year period.
Multilevel models showed significant variations for both outcomes at the municipality level or at the broad area level (two sided p value <0.001; table 2). The Moran’s I for area level residuals was significantly positive in all multilevel models (two sided p value <0.001), suggesting unaccounted spatial autocorrelation between adjacent areas (table 2).
Results of the empty multilevel logistic models and empty spatial logistic models for healthcare utilisation, France, 1998 and 2000
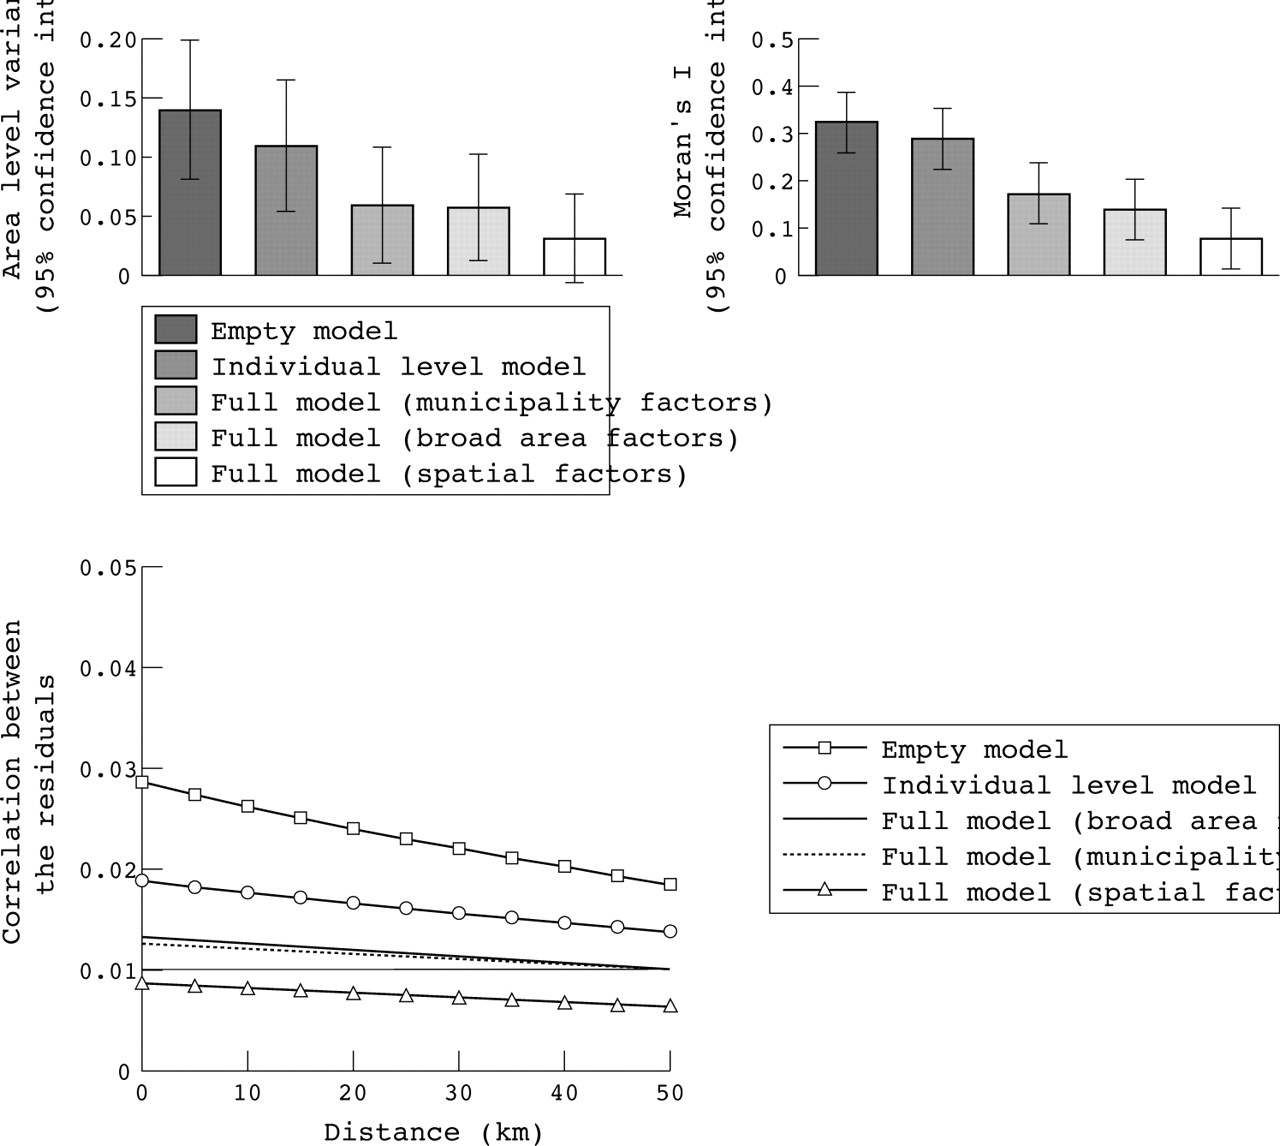
In the empty spatial mixed models (table 2), two people located in the same place had a correlation equal to 0.028 for not having a regular PCP (fig 3). Such a correlation was 46% lower for people 10 kilometres apart, and 95% lower for people 50 kilometres apart. The correlation in having a high percentage of specialist consultations was of similar magnitude for people in the same place, but decreased more gradually than for the other outcome with increasing distance between people (correlation was 5% and 23% lower, respectively, for people 10 and 50 kilometres apart). It shows that the regular PCP outcome varied in space on a more local geographical scale than the outcome on the percentage of specialist consultations. For both outcomes, the scaled deviance was considerably lower in the empty spatial mixed models than in the empty multilevel models, showing a better fit to the data for the spatial correlation structure (table 2).

Correlation between people in healthcare utilisation behaviour as a function of the spatial distance between them, estimated by empty spatial mixed models, France, 1998 and 2000.
A spatial mixed model adjusted for individual factors indicated that a higher socioeoconomic status of the context predicted increased odds of not having a regular PCP (table 3). However, the supply of physicians was not associated with this outcome. Regarding the second outcome, a higher socioeconomic status of the context and a greater supply of specialists independently predicted increased odds of having a high percentage of specialist consultations. Although confidence intervals were wide, there was an indication of consistently stronger associations between contextual variables and the outcomes when the variables were measured across continuous space, rather than within administrative municipalities or broad areas (table 3).
Place effects on healthcare utilisation from spatial mixed models adjusted for individual level characteristics. Each column corresponds to different spatial mixed models, with contextual factors successively measured at the municipality level, at the level of broad areas, and across continuous space. France, 1998 and 2000
It should be noted that the different approaches to measuring contextual variables represented in figure 2 lead to different geographical representations when identifying places that do not share the same levels of exposure to these characteristics. This aspect is illustrated in figure 4, where the socioeconomic level of the context, as defined by the three different approaches, is mapped for a rectangular zone around the city of Paris.

Variations of socioeconomic level in place of residence as measured at the municipality level, at the level of broad areas, and across continuous space. Measurements made in a rectangular zone around the city of Paris (the boundaries of Paris appear in bold at the centre of the maps). On the lower map (showing measures across continuous space) the value plotted in each municipality was obtained by considering contextual information in a circular space that far exceeds the area of the municipality. Therefore, the smoothed pattern that appears on the map simply shows that people residing in neighbouring municipalities share common contextual influences. †Each indicator was divided into quartiles, with cut offs from the study sample of 5217 people for the outcome variable regarding regular primary care physicians.
To examine whether the explanatory factors accounted for spatial variations in healthcare utilisation, we estimated the area level variance and the Moran’s I in the consecutive multilevel models (including no covariates, individual covariates, or individual and contextual factors). We represented these indicators at the top of figure 5 for the multilevel model for specialty care use with people nested within broad areas. The unexplained heterogeneity between broad areas (expressed as the area level variance) decreased when individual and contextual variables were introduced into the model. Area level variance was lowest when place indicators were measured across continuous space. The Moran’s I similarly decreased with the increasing complexity of the model, and once again was lowest when place characteristics were measured across continuous space. The same pattern was true for not having a regular PCP, and for the multilevel models with municipalities as the second level (results not shown). The Moran’s I remained significant (two sided p value <0.05; results not shown) in all multilevel models for both outcomes after the contextual variables were included, showing unaccounted residual spatial autocorrelation.

Explanation of geographical variations in the odds of having a high percentage of specialist consultations with individual and contextual variables, France, 1998 and 2000. Top: area level variance estimated from multilevel models with people nested within broad areas, and Moran’s I statistic computed from broad area level residuals (bars: 95% confidence intervals). Bottom: residual correlation between people by spatial distance between them estimated from spatial mixed models.
Similarly, in the spatial mixed models, we examined whether the residual spatial autocorrelation between people (modelled as a decreasing function of the distance between them) was explained by individual and contextual factors. The case of the models for the percentage of specialist consultations is shown at the bottom of figure 5. The residual spatial autocorrelation was lowest when place indicators were measured across continuous space. The same pattern was true for not having a regular PCP (results not shown).
Finally, we examined whether multilevel models overestimated the significance level of contextual effects in disregarding spatial autocorrelation. We considered multilevel and spatial mixed models that included place characteristics measured across continuous space, and divided the place effect parameters by their standard errors. The multilevel models systematically overestimated statistical significance of place effects, as compared with the spatial models (table 4). As an example, the supply of PCPs showed a significant association with specialty care use in the multilevel models, which was not the case in the spatial model.
Significance level (defined by dividing parameters by their standard errors) of place effects measured across continuous space on healthcare utilisation, estimated from multilevel models with people nested within municipalities or broad areas, and spatial mixed models, France, 1998 and 2000
DISCUSSION
We proposed a spatial analytical approach based on a continuous notion of space. Following the distinction between measures of variation and measures of association,11,12 we found, in our case on healthcare utilisation, that both types of measures provided more relevant epidemiological information when embedded in a spatial perspective than in the multilevel framework.
Limitations of the illustrative example
Other than municipality affiliation, we did not have precise locational information. However, this lack of precision may not have been of critical importance in our study, as the 36 500 French municipalities constitute more local areas than the municipalities in many other countries. In addition, it is known that geographical variations in healthcare utilisation operate on a much broader scale than the municipality level.40 Therefore, in our case, it would have been more undesirable to neglect geographical correlation between neighbouring municipalities than to ignore geographical variations within municipalities. Conversely, more accurate georeferencing of people would have been necessary to investigate health outcomes that exhibit significant variations within municipalities.
Key points
-
Most contextual analysis studies have followed the multilevel analytical approach that divides geographical space into discrete areas disconnected from one another.
-
In our investigation of healthcare utilisation, multilevel models, in neglecting spatial relations between areas and considering only the correlation of outcomes within areas, failed to provide complete information on the spatial distribution of outcomes.
-
Because of unaccounted spatial autocorrelation, multilevel models overestimated the significance level of contextual effects, resulting in incorrect inferences.
-
By modelling the correlation as a decreasing function of the spatial distance between people, spatial mixed models not only provided information on the magnitude of spatial variations, but also on the shape of spatial variations.
-
Measuring contextual explanatory factors across continuous space, rather than within administrative areas, allowed us to better explain the spatial variability of healthcare utilisation.
-
The conceptualisation of space used for analysis influences our understanding of place effects. In many cases, it may be more appropriate to investigate geographical variations of outcomes across continuous space.
A second limitation is that sample sizes might have been more important, especially when conducting municipality level multilevel analyses. However, our samples were sufficient to quantify geographical variations between municipalities, which, as expected, were of greater magnitude than broad area level variations.
Investigating the magnitude and shape of spatial variations
The spatial correlation of outcomes, instead of being a statistical nuisance, is a phenomenon of direct interest that needs to be modelled properly to obtain relevant information. In neglecting spatial relations among areas and only considering the correlation of outcomes within areas, multilevel models were unable to provide complete information on the spatial distribution of healthcare utilisation. In contrast with the assumption that areas of high and low risk were randomly distributed in space, the Moran’s I showed that people residing in adjacent areas exhibited greater similarity of behaviour than would be expected in the case of spatial randomness. Because of unaccounted spatial autocorrelation, multilevel models overestimated the statistical significance of contextual variables, resulting in incorrect inferences.
Viewing space as a continuum, spatial mixed models captured the spatial autocorrelation unaccounted for by multilevel models. In modelling the correlation between people as a decreasing function of the spatial distance between them, spatial models not only captured the magnitude of spatial variations but also the scale of such variations (yielding information on the range of correlation in space). It indicated that the geographical coherence in healthcare utilisation existed on a much larger scale than the municipality level.
Measuring contextual factors across continuous space
Measures across continuous space allowed us to better explain spatial variations in healthcare utilisation than did municipality level or broad area level factors. Regarding municipality level measures, people may be affected not only by the characteristics of their municipality, but also by surrounding municipalities. For example, residing in a deprived municipality may have a different impact on healthcare utilisation if the municipality belongs to a globally affluent rather than a socially disadvantaged area. Obviously, such effects can be more efficiently captured by measures that consider contextual influences in a space that exceeds municipality boundaries than by municipality level factors. On the other hand, the broad administrative areas considered in our study are not centred on individual residences, and therefore may not have allowed us to adequately capture contextual effects. Measures across continuous space surrounding people were more appropriate in reflecting contextual influences on healthcare utilisation that operated on a larger scale than the municipality level.
CONCLUSIONS
Our study shows that the conceptualisation of space that is used for analysis has an influence on the understanding of place effects on health. In investigating healthcare utilisation, measures of variation and those of association between contextual factors and health both provided more relevant information when space was viewed as a continuum than when it was seen as fragmented into disconnected areas. We acknowledge that the multilevel approach may be the appropriate choice when the context is defined in a way that is not strictly geographical (for example, workplaces or schools)17; when investigating processes that operate on the scale of administrative areas (for example, matters related to public policies); or when spatial correlation can be reduced to the correlation within areas. However, in many social epidemiological studies, investigating geographical variations across continuous space using spatial modelling techniques and place indicators that capture space as a continuous dimension may be more appropriate in describing and explaining the spatial variability of health outcomes.
APPENDIX
APPENDIX 1: CONTEXTUAL MEASURES ACROSS CONTINUOUS SPACE
We used a geographical information system (GIS) with municipalities georeferenced as polygons. People were positioned at the centroid of their municipality when computing contextual factors. There would be no reason to attribute a different location, and accordingly a different contextual value, to people from the same municipality, as we have no locational information other than municipality affiliation.
As figure 2 shows, our approach to the socioeconomic contextual factor takes into account contextual information at geographical points located in a circular space around people, which space far exceeds the boundaries of the municipality of residence. The percentage of minimally educated inhabitants was available at the municipality level and needs to be attributed to the geographical points. However, municipalities differ in size, and only considering one point per municipality located around a person’s residence would result in overestimating the impact on that person of smaller compared with larger municipalities. We, therefore, regularly positioned points on every kilometre of French territory (resulting in a regular grid of 540 000 points), and attributed to each point the socioeconomic characteristic of the municipality in which it was located, thereby ensuring that all neighbouring locations were equally represented when computing the contextual factor.
Weights were needed to show the extent to which points situated at a greater distance from people had less of an impact on them than points that were closer.34 We defined such weights by assuming that the degree surrounding locations affected people at a given location was a function of the overall movement of people regularly travelling between locations. Thus, we sought to approximate the global movement between locations as a function of the distance between locations in the territory. For the sake of simplicity, we estimated a mean function for the whole of France, rather than using a place specific weighting function. We roughly quantified the regular movement between locations by considering distances covered by people in going to work, using for this purpose the 1999 French census, which provided us with municipality of residence and workplace municipality for the 22 million people employed in mainland France. The straight line distance between the centroids of the municipalities of residence and work (set to 0 for people working in their residential municipality) followed an exponential distribution, with a density of probability roughly equal to w(d) = 0.0799×exp(–0.0799×d), where d is the distance in kilometres. We used values of this decreasing function of the distance as weights in the computation of contextual factors.
The socioeconomic contextual factor Si for people located at the centroid of a municipality i was computed as a weighted average of the socioeconomic values at surrounding points j:

where sj is the socioeconomic value attributed to point j of the one kilometre grid, and wij is the weight of point j on people from municipality i. Weights were defined with the decreasing function of the distance described above, but were set to 0 when they were less than 5% of the weight for a point at distance 0. As shown in figure 2, this means that our approach considers contextual information within a 37.5 kilometre radius of people, a space considerably larger than any municipality. Our approach is an adaptation of the spatial filters used in disease mapping to obtain smoothed maps of disease incidence.20 31
For measuring the supply of physicians across continuous space, each site of consultation was randomly located within its municipality (exact locations were not available). For people in municipality i, we determined the weighted number of sites of consultation j within a radius of 50 kilometres as:

For example, for a person having two physicians available within 50 kilometres, for example, at a distance of 10 and 30 kilometres, Pi would be equal to w(10) + w(30). Pi would be greater if more physicians were available within the area, and if they were closer to the person’s residence. Such an indicator was computed separately for PCPs and specialists.
Our approach consists in measuring contextual factors across continuous space, while allowing for the more significant impact of nearer locations.34 Slightly different approaches and methodological refinements may be suggested to implement this general idea. For example, other options exist to define the weighting function, and different functions may be needed in different parts of the territory or for the different contextual factors, but investigating these aspects will require sensitivity analyses.
APPENDIX 2: THE MULTILEVEL AND THE SPATIAL MIXED MODELS
Let yij be the value of the binary outcomes for individual i in area j. We first fitted empty multilevel logistic models for these outcomes6:

where uj is the random deviation of intercept β0 for area j. To account for the hierarchical structure of the data, the multilevel model includes area level residuals uj of variance σu2.
We also modelled geographical variations across continuous space. As figure 1 shows we did not have individual information for all French municipalities. Accordingly, spatial lattice models,24 51 which usually consider correlation between adjacent areas of a territory, were not adapted to our case. The use of a geostatistical model considering locations on the territory proved more appropriate.
The spatial mixed models considered are not dependent on a space fragmented into areas.45 People were randomly located in their municipality so that the distance between people from the same municipality would not be set to 0 when estimating the spatial correlation function. Results remained unchanged when randomly relocating people within municipalities.
Let us consider a logistic model:

Let dij be the spatial distance between places of residence for person i and person j. Spatial mixed models do not take into account geographical correlation with area level random effects, but specify a spatial correlation structure for individual residuals, assuming that the correlation between residuals ei and ej for persons i and j is a decreasing function of the distance dij:

Exp(-dij/ρ) shows that the correlation is proportional to the exponentiated distance between people. In this model, two people located at the same place may have an estimated correlation less than 1, as they do not necessarily have identical healthcare utilisation behaviour.
Acknowledgments
We are grateful to Ana V Diez Roux who provided us with helpful comments on a previous version of the manuscript. We thank Philippe Le Fur from IRDES and Pascule Breuil from the French Ministry of Health who provided valuable advice in the analysis of the data.
REFERENCES
Footnotes
-
Funding: Basile Chaix carried out this work with a grant from the French Ministry of Research (TTT027) and with a grant from the French Foundation for Medical Research (FRM). The project was supported by the “Avenir 2002” programme of INSERM (the French National Institute of Health and Medical Research). Juan Merlo was supported in part by grants from FAS (Swedish Council for Working Life and Social Research) (2003–0580).
-
Conflicts of interest: none declared.
Linked Articles
- In this issue