Article Text

Abstract
Study objective: To assess the strength of the associations between neighbourhood characteristics and mortality, after adjusting for individual characteristics.
Design and setting: 1990 census records of over 25 year old men in the Helsinki Metropolitan area linked to death records in 1991–1995; almost 1.22 million person years and 15 000 deaths. Individual characteristics were education, occupation based social class, housing tenure, housing density, and living arrangements. Proportion of manual workers, proportion of over 60 year olds, and social cohesion were measured for 55 small areas, and SAS Glimmix was used to fit multilevel models.
Main results: Men in areas with high proportion of manual workers and low social cohesion have high mortality, particularly among 25–64 year olds. About 70% of this excess mortality is explained by compositional differences of people living in these areas. Accidents and violence, circulatory diseases, and alcohol related causes contribute most to these area effects. Area characteristics do not consistently modify or mediate the effects of individual socioeconomic characteristics on mortality.
Conclusions: As compared with individual characteristics neighbourhood characteristics have modest independent effects on male mortality. Furthermore, individual socioeconomic characteristics are associated with mortality independently of area characteristics. Rather than the characteristics of areas, other social contexts, such as peer groups and family settings may be more fruitful targets for further research and policy on contextual effects on mortality.
- neighbourhood
- mortality
Statistics from Altmetric.com
Mortality and morbidity levels are determined by individual characteristics and behaviours, but the social contexts in which people live also have an effect. Recently, strong interest has focused on contexts that are related to the characteristics of geographical areas. The contribution of area context to health and mortality of people has also policy relevance as it has been suggested that interventions to improve health should focus on efforts to improve neighbourhoods in socially disadvantaged areas.1
Multilevel analyses of the effects of area characteristics on the health of people seem to indicate that area based measures of social cohesion and integration, civic community, and material disadvantage have the largest effect on self reported health outcomes rather than more “objective” measures of physical illness.1–3 Analyses of mortality give somewhat conflicting results; some studies show an area effect after adjusting for individual characteristics,4–7 while other studies show more modest independent effects or effects only in specific population subgroups.8–12 This is perhaps not surprising, as the effects of area are likely to depend on the particular area characteristic, adjusted individual characteristics and the area unit. It is also likely that the effects of areas are not equally strong in all societies and urban areas.
Further analyses are needed to establish whether the effects of area characteristics on mortality are specific to certain causes of death, for example those related to immediate behavioural causes such as accidents and violence or alcohol related causes of death. In addition, very little is known about whether the effects of individual socioeconomic characteristics on mortality are modified by the type of areas people live in. Individual social disadvantage may put people at a particularly high risk of ill health and mortality in socially disadvantaged areas. Furthermore, most multilevel studies on the effects of characteristics of areas on mortality have focused on socioeconomic structure and deprivation; thus more analyses are needed on other characteristics of geographical areas.
We analyse area differences in mortality among men in the Helsinki Metropolitan area. High age adjusted mortality has been observed among men in the central northern areas of Helsinki and low mortality among residents in the western suburbs and coastal residential areas.13,14 However, very little is known about the particular area characteristics that may underlie these mortality differences. We use individual data on personal sociodemographic characteristics and mortality from census and registration data, and contextual information for 55 small areas. Three aspects of areal differentiation are considered; socioeconomic structure, demographic structure, and social cohesion.
The specific aims of this study are:
To test whether area characteristics are associated with mortality, while individual characteristics are adjusted for.
To test whether the associations between area characteristics and mortality are particularly strong for some causes of death, especially accidents and violence and alcohol related causes.
To test whether the associations between individual socioeconomic characteristics and mortality are particularly strong in socioeconomically disadvantaged areas.
METHODS
Study population and mortality follow up
We used the 1990 census records of all men aged 25 and over (n=251 509) living in the Helsinki Metropolitan area (cities of Helsinki, Espoo, Kauniainen, and Vantaa) linked to death records in 1991–1995. Altogether our study population lived about 1.22 million person years, and experienced 14 878 deaths. Overall 11.5% of the study participants were aged over 64 years, 36.5% had primary education, and 14.1% were unskilled manual workers.
Statistics Finland has carried out the linkage of datasets by means of personal identification codes. Only about 0.5% of deaths could not be linked to census records. For cause specific analyses we distinguish (on the basis of the Finnish edition of the 9th version of the International Classification of Diseases and Causes of Death) the following mutually exclusive broad groups of causes of death: (1) lung cancer, (2) other cancers, (3) diseases of the circulatory system, (4) other diseases, and (5) accidents and violence. In addition to these five groups of causes of death we use a category that combines all causes of death that are related to alcohol. In Finland alcohol related causes are a major factor contributing to socioeconomic differences in mortality and their changes.15,16 These alcohol related causes fully overlap with the five main categories and are defined as: alcohol related diseases (alcoholic psychoses, alcohol dependence syndrome, alcoholic epilepsy, alcoholic cardiomyopathy, alcoholic diseases of the liver, alcoholic diseases of the pancreas, alcoholic beriberi disease, alcoholic polyneuropathy, and alcoholic gastritis), alcohol poisoning, suicide by alcohol, and all causes for which at least one of the contributory causes of death is related to alcohol. For more detail see Mäkelä et al.17
Individual level variables
The following individual level sociodemographic variables were obtained from the census data: education, occupation based social class, housing tenure, housing density, and living arrangements. Educational categories were based on the highest completed educational degree or certificate. The four categories were primary, lower and higher secondary, and tertiary education. Five occupation based social classes were used: upper white collar, lower white collar, skilled manual, unskilled manual, other (including farmers, other self employed, and those whose social class was not known). Unemployed and retired persons were classified according to their previous occupations; persons taking care of the household were categorised according to the occupation of the head of the household.
Housing tenure was classified as owner occupied or other, and housing density was assessed in terms of living space and categorised as spacious, intermediate, and crowded. Living arrangements were measured as living with a partner (married/cohabiting) or living without a partner. For some of the individual level variables information was missing for 2%–3% of the total study population. For social class and housing tenure missing observations were allocated into the category “others”, and for housing density into the category “intermediate”. Because of the small share of missing values, choice of treatment of missing values has a negligible effect on the results.
Area level variables
The division of the study region of Helsinki Metropolitan area was based on the administrative area division of the municipalities. Some smaller areas were merged to obtain areas of roughly comparable size and obtain adequate numbers of deaths in each area for descriptive purposes. Areas that were geographically and physically different or diverse in their sociodemographic structure were nor merged. Small areas that did not have comparable neighbouring areas and military and campus areas were excluded from this study (five areas). The final area division used in this study consists of 55 areas, with a population varying from 3699 to 26401 (mean=14 635).
The area variables represent three dimensions of areal differentiation; socioeconomic structure, demographic structure, and social cohesion. We experimented with several variables for each dimension and selected those that had the strongest associations to age adjusted mortality at the area level. In addition, for further analyses we selected area variables that gave the most parsimonious explanation of the area level variation in mortality—that is, we chose a set of area variables that best explained area differences in mortality, and at the same time made sure that inclusion of any additional area variable was not associated with area mortality in a statistically significant way.
Proportion of manual 15–64 year old men and proportion of over 60 year old men and women represented the socioeconomic and demographic dimensions. Social cohesion was measured by a standardised score calculated from the proportion of over 15 year old men living with a partner in 1990, the voting percentage in the previous municipal elections in 1988, and the proportion of over 15 year old men in 1990 who did not live in the same area in 1985. These three components measure adherence to traditional forms of living arrangements, participation in politics and residential stability.18,19 In an exploratory factor analysis of the data, these three components loaded strongly on the same factor. All area variables were measured as categorical variables in four quartiles. For social cohesion the two middle quartiles were combined. The data were obtained from the municipal statistical authorities and census data aggregated over areas.
Statistical methods
We used SAS macro GLIMMIX to fit multilevel models.20 A random intercept model with varying area level intercepts was used. In the models we used a Poisson distribution assumption, a log link and the logarithm of person years as an offset. In these data maximum likelihood and restricted maximum likelihood estimation led to substantively similar parameter estimates and confidence intervals; we thus used maximum likelihood methods that allow for deviance tests of fixed effects.21 The analyses are carried out separately for 25–64 year old and over 64 year old men because these age groups vary considerably in their attachment to the labour market and cause of death structure. Within the two broad age groups, age is adjusted for in five year age groups.
The parameters of the models are presented as “mortality risk ratios”, with those in the reference group having a mortality risk ratio of 1. The mortality risk ratio has a straightforward percentage interpretation, for example, a group with a ratio of 1.25 has a 25% higher mortality than the reference group. We also calculated average relative deviations to summarise differences in mortality between the 55 areas. The average relative deviation shows how many per cent on average the mortality rate of a given area differs from the total mortality rate (for more detail see footnote for table 2).

RESULTS
Total mortality
In our data, mortality risk ratio for the area of highest mortality in relation to the area of lowest mortality is 2.88 among 25–64 year old men. Table 1 shows the effects of all our area and individual variables on total mortality for 25–64 year olds and over 64 year olds. For the 25–64 year age group high mortality is observed in areas that are characterised by high proportion of over 60 year olds, high proportion of manual workers, and low social cohesion. Of the individual characteristics analysed in this study low education, low occupation based social class, non-ownership of housing, living in crowded accommodation, and not living with a partner are related to high mortality. Overall the associations of individual characteristics on total mortality are much larger than those of area based measures.
Age adjusted mortality and mortality risk ratios by area level and individual level explanatory variables
When all area characteristics are entered to the model simultaneously (model 2) the proportion of manual workers has the strongest effects on mortality, while the effect of social cohesion is most strongly attenuated. When entering all individual characteristics to the model simultaneously (model 3) all effects are attenuated. However, those with low education, low occupation based social class, and non-ownership of housing have mortality risk ratios in the region of about 1.5, and those living without a partner have a mortality risk ratio of almost 2.
When both area and individual characteristics are entered to the multilevel model simultaneously, the effects of area characteristics are further attenuated, while the effects of individual characteristics remain almost unchanged. Of the area characteristics the strongest relation with total mortality is with high proportion of manual workers (mortality risk ratio 1.19).
Among the over 64 year olds all the effects of area and individual characteristics on mortality are weaker than among 25–64 year olds, with the exception of housing density. Furthermore, in the full multilevel model almost all the area effects are insignificant, with the exception of a weak effect of the proportion of manual workers. Individual effects of living arrangements and housing density remain the strongest.
The total area variation in age adjusted mortality for the 25–64 year olds, measured in terms of the average relative deviation for all the 55 areas is 16.6%—that is, on average the age adjusted mortality rate of an area differs by 16.6% from the age adjusted total mortality rate. The corresponding figure is 8.1% for the over 64 year olds (table 2). In both broad age groups about 80% of the average deviation is accounted for by our three area variables, or about 70% by all our individual level measures, and more than 90% of the average deviation is accounted for by area and individual variables simultaneously.
The effects of adjustments for area and individual level variables on the average relative deviation* in area level mortality
Cause of death
Table 3 shows the effects of area characteristics on six broad groups of causes of death. We have not estimated the effects for the proportion of over 60 year olds, as the main effect of this variable was already quite weak. For the 25–64 year olds the effects of the proportion of manual workers on total mortality mainly reflect accidental and violent causes of death, alcohol related causes as well as cardiovascular diseases; and the effects of social cohesion mainly reflect accidental and violent causes and alcohol related causes (with the contribution from other cancers being U shaped). Among the over 64 year olds the effects of area social cohesion are very small for all specific causes of death; high proportion of manual workers is significantly associated with increased mortality from cardiovascular diseases.
Age adjusted cause specific mortality risk ratios by area level explanatory variables
Interactions between area and individual characteristics
We studied interactions between area and individual level characteristics to assess whether the effects of individual level socioeconomic characteristics on mortality are different in areas with different socioeconomic structure and social cohesion (figs 1 and 2). The interactions are presented in terms of age adjusted death rates, but similar results are obtained with mortality risk ratios. Individual social class and education are collapsed into two groups to guarantee adequate numbers of deaths for each combination of the interaction; for occupation based social class we have further excluded the category “others”. Within the confines of random variation, the age adjusted curves are parallel among the 25–64 year olds and thus indicate little additive interaction between area and individual characteristics. For the over 64 year olds, interactions between education and area characteristics are quite strong, but inconsistent for the proportion of manual workers; those with low education have high mortality in areas of both high and low proportion of manual workers, but in areas with average levels of manual workers the effect of education is small. With regards to social cohesion, those with low education have increased mortality in areas of high cohesion, but this excess progressively disappears in areas of lesser cohesion.
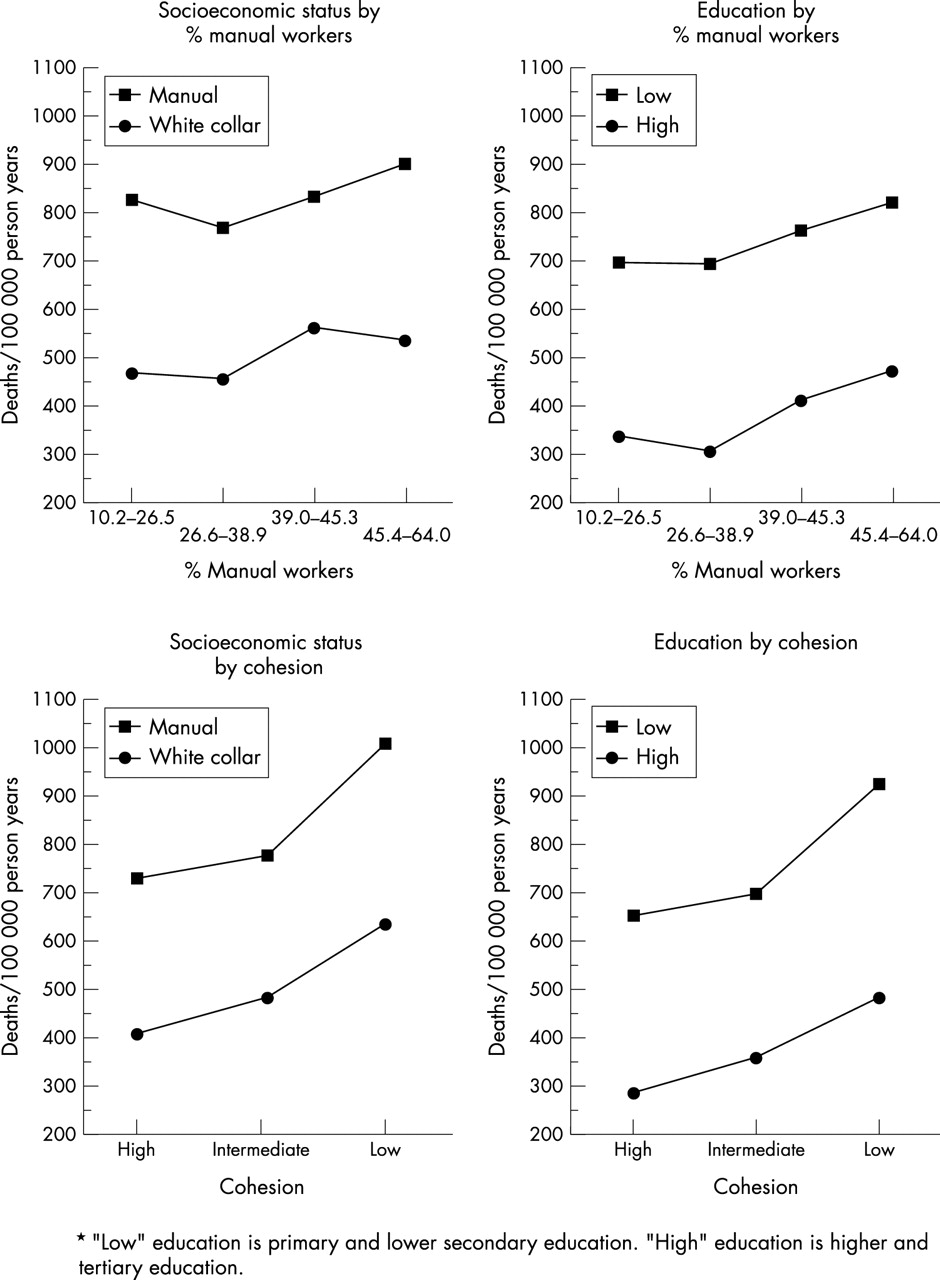
Age adjusted mortality rates by individual socioeconomic status and education* by area proportion (%) of manual workers and social cohesion, 25–64 year old men.

Age adjusted mortality rates by individual socioeconomic status and education* by area proportion (%) of manual workers and social cohesion, over 64 year old men.
DISCUSSION
This study has shown that in the Helsinki metropolitan area men living in socioeconomically disadvantaged areas and areas of low social cohesion have higher mortality than men living in other areas. Most of this variability can be explained by compositional differences of individuals living in these areas. However, we observe modest independent effects of low area level socioeconomic structure and social cohesion on total mortality, particularly between 25 and 64 years of age. Accidental and violent causes, alcohol related causes, and diseases of the circulatory system contribute most to this independent effect. Area characteristics do not consistently modify the effects of individual sociodemographic characteristics on mortality in this study. In addition, the effects of individual socioeconomic status on mortality were not attenuated by adjustment for characteristics of areas.22
Key points
-
Accumulated evidence gives conflicting results on the strength of the association between area characteristics and mortality
-
In our study, which covers all men aged 25 and over (n=251 509) living in 55 neighbourhoods in the Helsinki Metropolitan area, neighbourhood characteristics have modest independent effects on mortality as compared with individual characteristics.
-
However, low area level socioeconomic status and social cohesion have a small effect on accidental and violent causes, alcohol related causes and diseases of the circulatory system, particularly between 25 and 64 years of age.
-
Individual socioeconomic characteristics are associated with mortality independently of area characteristics.
Socioeconomic disadvantage of areas
Partly conflicting results of the strength of the effects of area deprivation or socioeconomic disadvantage on mortality have been obtained in previous studies. Some multilevel studies seem to demonstrate an effect of area deprivation on mortality independent of individual level confounders, while other studies show that these effects are more modest or almost non-existent.3 Variability in the results is perhaps not surprising, as the effects of areas can be expected to vary from time to time, and between societies, as well as depending on the adjusted individual characteristics and the area unit. However, it seems likely that in study populations where geographical socioeconomic differentiation is strong, where inner city poverty is prevalent, and where metropolitan segregation has been well established, area effects are more likely to occur. Accordingly, the studies that include a federally designated poverty area in Oakland,4 the most deprived area in Scotland,5 and a study of different indices of the depth of area poverty11 provide best evidence that the “risk of mortality is particularly sensitive to more intensive concentrations of poverty”.11 The very modest area effects observed in this study may reflect the absence of extreme areal polarisation in the Finnish cities.
In the studies that have carried out stratified analyses by sex and/or age a rather consistent pattern arises. Firstly, the effects of area deprivation on mortality seem to be stronger for men than women,4,5,9 with only the British ONS Longitudinal Study showing a slightly stronger effect of area deprivation on mortality among women.8 Secondly, the relative effects of area deprivation on mortality are stronger among younger (younger than 55 or 65 years) rather than older study participants.4,9,11,12 The results of our study are in accordance with these earlier results by showing the strongest relative effect of area level socioeconomic characteristics on mortality among young and middle aged men. The analyses of our data further show that the effects at younger ages are partly attributable to accidental and violent causes of death, as well as causes related to the excessive use of alcohol. These cause specific results may be in accordance with a stronger relation between area characteristics and self assessments of health and minor mental outcomes.1,2 For accidental, violent and alcohol related causes these effects are partly mediated through associations with excessive use of alcohol as well as violent and accident prone behaviour. However, more distal pathways related to access to amenities and services, direct material factors (for example, inadequate housing) and psychosocial disadvantage may also play a part. These causal pathways are mutually not exclusive.
Age structure and social cohesion
Of the other area measures that were used age structure was only very moderately associated with mortality. However, our measure of social cohesion—a summary measure of living alone, voting turnout and migration—was associated with mortality, and although this association was strongly attenuated when individual characteristics were adjusted for it was not fully explained. The fully adjusted effect of social cohesion on total mortality is weaker than that of socioeconomic structure (% manual workers); among 25–64 year old men the effect is somewhat U shaped and the mortality ratio between intermediate and low cohesion was 1.11, among over 64 year old men the effects are non-existent. One explanation for the relatively modest effects of social cohesion on mortality in these data is that social cohesion may exert both beneficial and harmful effects on health and mortality.19,23 The potential harmful effects may relate to the coercive and conservative aspects of cohesive societies that overburden people with obligations, discourage health promoting behaviour, for example restrict use of contraceptives and slow down beneficial change in dietary habits, as well as bring unwanted rigidity in social structure.
Methodological considerations
All analyses of the relative contribution of area characteristics and individual characteristics on morbidity and mortality may be compromised by inadequate measurement at both levels. In particular, unaccounted individual variability and selective residential migration cannot be excluded as an explanation for the area effects that are observed. This possibility is particularly potent for the several studies that have only been able to adjust for a single socioeconomic confounder at the individual level. However, in our study with good adjustment for several individual sociodemographic factors, the observed effects of characteristics of areas on mortality may be taken as good evidence for a modest causal relation of area characteristics on mortality.
In addition, it could be argued that it is difficult to observe robust area effects, because measures of area characteristics are inadequate. In this study we have only used compositional area measures (area characteristics that can be obtained by aggregating individual characteristics over areas), rather than integral area measures (area characteristics that can only be measured at the area level and have no meaningful parallel at the individual level, for example, quality of roads) However, our compositional measures are not aggregated within the study population, but are aggregates of the total population or of the population of men aged 15 years and over living in the study areas. Nevertheless, it is unlikely that inadequate measurement is a major problem with these data, because of the total observed area variation between the 55 areas about 80% can be accounted for by our area measures (about 90% of area variation is accounted for by area and individual characteristics). Thus, unaccounted area variation is small. However, a possible drawback of our analyses—and ultimately any analyses of the effects of area characteristics on health—may be that we use areas units that do not capture the right level of areal differentiation. Further assessment of different area units, both larger and smaller than we have used here, is worthwhile. It is probable that such analyses will lead to a better understanding of the causal processes involved, with for example amenities and services being more relevant at a higher level of regional aggregation and control of deviant behaviour being more relevant in smaller area units. However, analyses of nationwide Finnish data indicate that stronger independent effects of area on mortality from alcohol related causes of death can be found at the municipal level24 than was found in this study of neighbourhoods. These results may be in accordance with alcohol consumption and consequently alcohol related harm being determined by broad regional cultural traditions.
Conclusion
Most studies to date show that the effects of area characteristics on mortality are small in comparison with the effects of individual socioeconomic characteristics, and that the effects of area based measures of socioeconomic structure and social cohesion are strongly attenuated by adjustment for individual socioeconomic characteristics. These results thus seem to indicate that interventions to promote health do not necessarily have to focus on efforts to improve neighbourhoods and small communities, but on efforts to upgrade the living conditions of socially disadvantaged people. We further show that area characteristics do not consistently mediate or modify the effects of individual socioeconomic characteristics on mortality. However, a full understanding of the interplay of individual and area characteristics will ultimately benefit from longitudinal analyses of change in geographical socioeconomic differentiation.
The relatively modest independent effects of area characteristics on mortality may not be all that surprising in residentially mobile modern societies. For example, in these data 36% of the over 15 year old male population in 1990 did not live in the same area in 1985. The decay of the local community may, in fact, have compelled people to seek for relevant social exchange elsewhere and hence undermine the importance of the area altogether. Thus, the structure of peer groups, work place settings, and other geographically diffuse social context in which people live their lives may have a more profound impact on mortality than the characteristics of areas.
Acknowledgments
We are grateful to the Central Statistical Office of Finland for the permission (TK-53–1783–96) to use the data.
REFERENCES
Footnotes
-
Funding: the study has been supported by the Academy of Finland (grant 41498, 70631 and 48600) and the Signe and Ane Gyllenberg Foundation.
-
Conflicts of interest: none.
Linked Articles
- In this issue