Article Text

Abstract
Study objective: To determine whether measures of income and wealth are associated with poor self rated health and GHQ depression.
Design: Whitehall II study of London based civil servants re-interviewed between 1997–1999; 7162 participants.
Main results: A twofold age adjusted difference in morbidity was observed between the top and bottom of the personal income hierarchy for both sexes. For household income and particularly for wealth these associations are stronger. After adjusting for health at baseline the associations between personal income and both health outcomes are reduced by about 40%–60%. For household income the attenuation is somewhat smaller and for wealth is about 30%. Adjusting for other sociodemographic factors leads to further attenuation of the effects.
Conclusions: The associations between income, particularly personal income, and morbidity can be largely accounted for by pre-existing health and other measures of social position. The strong independent association between household wealth—a measure of income earned over decades and across generations—and morbidity are likely to be related to a set of early and current material and psychosocial benefits.
- health
- income
- wealth
- white collar
- cross sectional
Statistics from Altmetric.com
In comparison with studies of the effects of education and occupation based social class on health and mortality, comparatively few analyses of the effects of income and wealth on health at the individual level are available. The evidence so far indicates that personal income is strongly associated with several measures of morbidity.1–15 However, interpretation of these relations is hampered by inadequate understanding of both what determines income and what income “buys”—that is, what are the benefits of high income.
Personal income is partly determined by previously achieved educational qualifications and occupational status, and these factors may be more fundamental determinants of health than income as such. At one extreme one can imagine a situation where the association of income and health is fully accounted for by these preceding measures of social position. If this were the case, income would be either mediating the effects of education and social class on mortality, or be only spuriously related to mortality. Any attempts to reduce income differences in mortality would be best achieved by intervening in these preceding aspects of social position, for example, by guaranteeing more equal educational outcomes. Furthermore, income, more than occupational class and particularly education, may be partly determined by pre-existing ill health. Particularly among those of working age, poor health may lead to early retirement and a consequent loss of income, and simultaneously also predict future poor health. Attempts to assess the independent effects of income on health should aim to take account of both of these factors.
Even after allowing for pre-existing ill health and other measures of social position, the interpretation of any independent effect of income and health is not easy. At one extreme, it could be hypothesised that this independent effect only reflects the material necessities of life, for example, ability to purchase good nutrition and adequate housing. However, it is also likely that income is a marker of, or leads to, other factors, for example, health related behaviours and psychosocial wellbeing,9 that influence health.
In this paper we use data from the Whitehall II study of London based civil servants,16 a cohort that excludes the poorest and richest in society, to assess the effect of baseline ill health and other measures of social position on the association of income and health. We try to minimise the effects of preceding social position and ill health in three different ways. Firstly, we use measures of income, for example household disposable income per consumption unit, that can partly overcome these limitations, and more accurately measure consumption possibilities, purchasing power, and poverty. Measures of wealth are also likely to be less determined by pre-existing ill health than other indicators of social position. However, research evidence on the effects of wealth on morbidity is almost non-existent, with the exception of analyses on indirect indicators such as car access and housing tenure; current research indicates that these indirect measures of wealth are related to health not only “because they are markers for income and psychological traits”, but because “they may also have some directly health promoting or damaging effects”.17
Secondly, we aim to adjust statistically for preceding health status and several other dimensions of socioeconomic position, household structure, and economic activity status. Previous analyses indicate that excess mortality and morbidity by income is greatly reduced after such adjustments are made, but it is by no means completely abolished.6,10–15
Thirdly, the shape of the relation between income and health is used to assess the nature of the relationship. For our purposes two main shapes can be examined: (1) A curvilinear relation where health declines throughout the income range, but particularly rapidly at lower levels of income; (2) a linear relation where health declines at a constant rate with declining income. A curvilinear relation is most consistent with current poverty and material circumstances being a major determinant of poor health, and improving the incomes of the poorest would lead to the greatest improvements in health. A linear relation (that is, a continuous social gradient in health) is more consistent with accumulation of factors—possibly a combination of material, behavioural, and psychosocial—that increase morbidity over the whole range of incomes, and reflect findings of a gradient between occupation based social class, education, and poor health. Previous research evidence on the shape of the income-morbidity relation is not consistent,6,10–15 and it is possible that the shape varies in different sections of the population, from country to country, and by health outcome.
Thus the specific aims of this study are to:
-
analyse whether current personal income, current household income, and household wealth form continuous linear gradients or curvilinear associations with poor self rated health and GHQ depression, and
-
assess how much of this relation is attenuated after adjusting for baseline health, other measures of socioeconomic position, household structure and economic activity.
METHODS
Participants
The target population for the Whitehall II study was all London based office staff, aged 35–55, working in 20 civil service departments. With a response rate of 73%, the final cohort consisted of 10 308 participants at baseline (Phase 1 in 1985–88): 6895 men and 3413 women.16 The true response rate is higher, however, because around 4% of those invited were not eligible for inclusion. Although white collar, respondents covered a wide range of grades from office support to permanent secretary.
Baseline screening (Phase 1) took place between late 1985 and early 1988. This entailed a clinical examination and a self administered questionnaire containing sections on demographic characteristics, health, lifestyle factors, work characteristics, social support, and life events. Since baseline screening four further data collection rounds have been completed. Successive phases alternate between collecting data by self administered questionnaire only and collecting data via a clinical screening in addition to questionnaire completion. The most recent phase (Phase 5) was completed between 1997–1999.
The subjects for these analyses are drawn from Phase 5 of the Whitehall II study, altogether 7824 men and women. Response at Phase 5 was 76% of those who participated in the baseline screening. Of these 7264 completed the Phase 5 questionnaire, the rest completed a shortened version of the questionnaire via telephone interview (an interview that did not include questions on income and wealth). In addition to those who failed to respond to invitations to participate, non-responders include participants who had died and those who could not be traced. A total of 7162 participants provided data for the analyses presented in this paper, 5038 men and 2124 women.
Measures
We used two health outcome measures from Phase 5 in these analyses. Self rated health was based on the question “In general, would you say your health is”, with five response alternatives ranging from excellent to poor. For the purposes of this study participants reporting three poorest levels of health were categorised as having “poor” self rated health. GHQ depression was measured using four items—”thinking of yourself as a worthless person”, “felt life is entirely hopeless”, “felt life isn’t worth living”, “found at times you couldn’t do anything because your nerves were too bad”—from the 30-item General Health Questionnaire (GHQ). Depression was assessed by summing all items scored on a Likert scale from 0–3. Respondents scoring 0–2 were considered “non-cases” and those scoring 3 or more, “GHQ depression cases”. GHQ depression is best considered to be a measure of depressive symptoms, and should not be equated with clinically diagnosed depression.18
Financial measures come from the phase 5 questionnaire in 1997–99. They were: annual personal income (“amount received annually from salary or wages, pensions, benefits and allowances before deduction of tax”), annual household income (“total annual household income from any source, including personal income”), and household wealth (“amount of money the respondent would have if s/he cashed in all household assets and paid off all debts”). For more information on question wording see appendix 1 (available to view on the journal web site, www.jech.com/supplemental). For the purpose of analysis the two highest personal income categories were collapsed to leave seven categories, the five lowest and the two highest household income categories were collapsed to leave six categories, and the two lowest and two highest wealth categories were collapsed to form four categories. About 6% of the respondents who had provided data on household income had selected categories that were lower than their personal income. These respondents have been included in the analyses as results were little changed by their exclusion. Information on income and wealth was not available from previous phases.
We measured Phase 5 age in single years. Baseline (Phase 1) civil service employment grade was categorised as (1) administrative, (2) professional and executive, and (3) clerical and office support staff. Education was measured as number of years of education at Phase 5, but in this cohort it is likely to refer to educational qualifications received several decade before. We also measure employment status as in paid employment or not in paid employment and number of economically active adults in the household. Household composition at Phase 5 was measured with number of children and number of all persons in the household, and marital status as married or not married.
In addition, we assessed health at baseline (Phase 1) using survey data on a single question on longstanding illness (“Do you have any longstanding illness, disability or infirmity?”, with response alternatives “yes”, “no”), a five category self rated health variable (“Over the past 12 months would you say your health has been”, with response alternatives ranging from “very good” to “very poor”), the 30-item GHQ score and its squared value at baseline (to account for non-linear effects).
Statistical analysis
The association between two Phase 5 measures of health and three financial measures; personal income, household income, and household wealth were analysed using logistic regression in STATA,19 with the lowest category of income or wealth as the reference category. Results are presented in terms of odds ratios (ORs) for the variable of interest, together with 95% confidence intervals (95% CI). All the analyses were adjusted for age. Additional adjustment for health at baseline, as well as employment status, number of economically active adults, number of children and number of all persons in the household, marital status, education, and employment grade were also carried out. Analyses were conducted separately in men and women.
In descriptive analyses and graphical presentations income and wealth categories were represented by category midpoints. For the open-ended highest categories we used a midpoint that was the lower cut off point of the category multiplied by 1.25. For the categories that were obtained by combining two or more categories of the original variable a population size weighted average midpoint was used.
As a summary index—the relative index of inequality (RII)—we estimated a continuous logistic regression coefficient for income with each category being represented by its midpoint centile. This method gives a more stable estimate for the odds ratio as data for all income and wealth categories are used, and it has a intuitive interpretation as the increase in morbidity from the top to the bottom of the income hierarchy.20 RII is a measure of total effect, as it takes into account both the strength of the morbidity differences between groups as well as the distribution of the population into these groups.
RESULTS
Table 1 shows the age adjusted prevalence of GHQ depression caseness and poor self rated health by income category and wealth for men and women. Both depression and poor self rated health are more common among the lowest personal and household income and household wealth categories. About 20%–30% of people suffer from depression in the lowest income and wealth categories, as compared with only 10%–15% in the highest categories. For self rated health there is also an apparent gradient, with 60%–70% of people in poor health in the lower categories and around 40% in the highest categories.
Age adjusted prevalence (%) of GHQ depression and poor self rated health by income and wealth among men and women
Table 2 displays the RIIs of the health-income (or wealth) relation before and after adjusting for baseline health and other sociodemographic factors. In these analyses the RII is the odds ratio of poor health among those with the lowest income as compared with those with the highest income. The age adjusted RIIs for GHQ depression and poor self rated health vary between two and four for the different income measures.
Relative index of inequality (RII) * and 95 % confidence intervals (in parentheses) of income and wealth on GHQ depression and poor self rated health among men and women
When only age is adjusted for, the RII is always smallest for personal income. This is true for both health measures and for men and women. Furthermore, the RII for household income is smaller than that for household wealth, except for GHQ depression among women. Differences in RIIs between men and women are small or inconsistent. Restricting the analyses to a sample that included participants with full information on personal income, household income and wealth did not drastically influence the results (see footnote † in table 2).
Among men and women adjusting for health at baseline reduces the effects of both income measures and wealth on GHQ depression and poor self rated health. This is especially true for personal income; the associations are reduced by about 40%–60%. For household income the attenuation is somewhat smaller and for wealth is about 30%. Adjusting for other sociodemographic factors leads to further attenuation of the effects. The associations between personal income and both health outcomes among men and women become small and not statistically significant, while the effects of household wealth remain strong. Further analyses not presented here (available from the authors on request), indicate that this attenuation is mainly attributable to the adjustment for education and employment grade.
Figures 1, 2, and 3 display the odds ratios for categorical income and wealth on both poor self rated health and GHQ depression in men. Given the comparatively small number of women in the dataset, the odds ratios cannot be estimated with any precision, and for this reason are not shown. For men the y axes have the same scale in all figures for easy comparability.
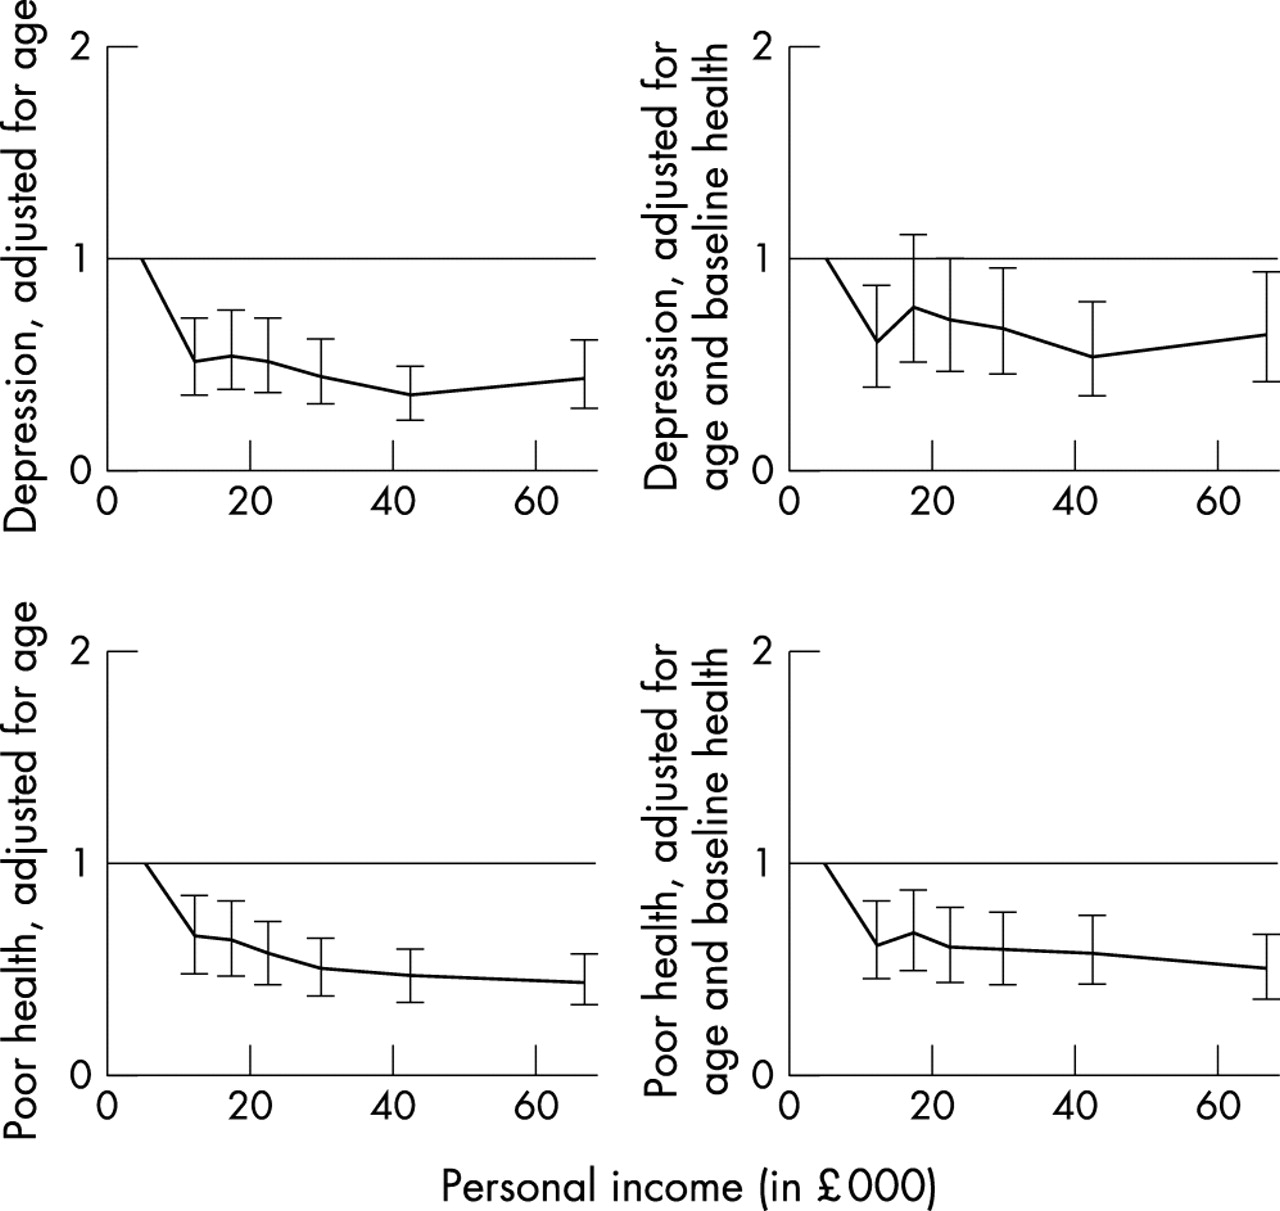
Odds ratios and 95% confidence intervals of personal income on GHQ depression and poor self rated health among men.

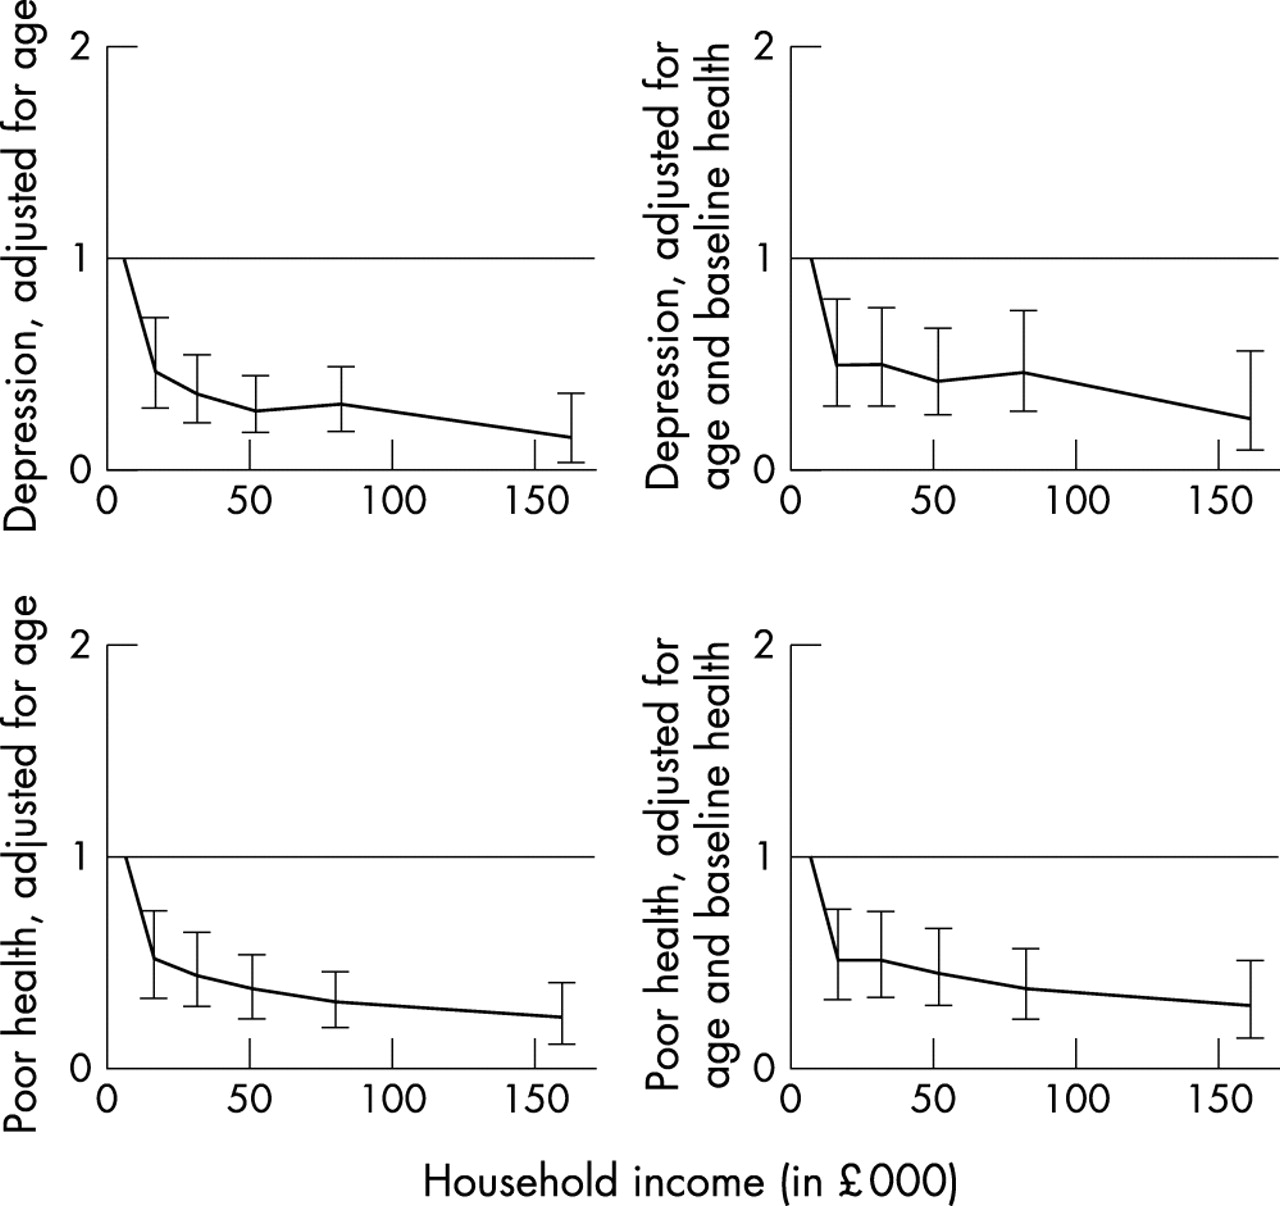
Odds ratios and 95% confidence intervals of household income on GHQ depression and poor self rated health among men.
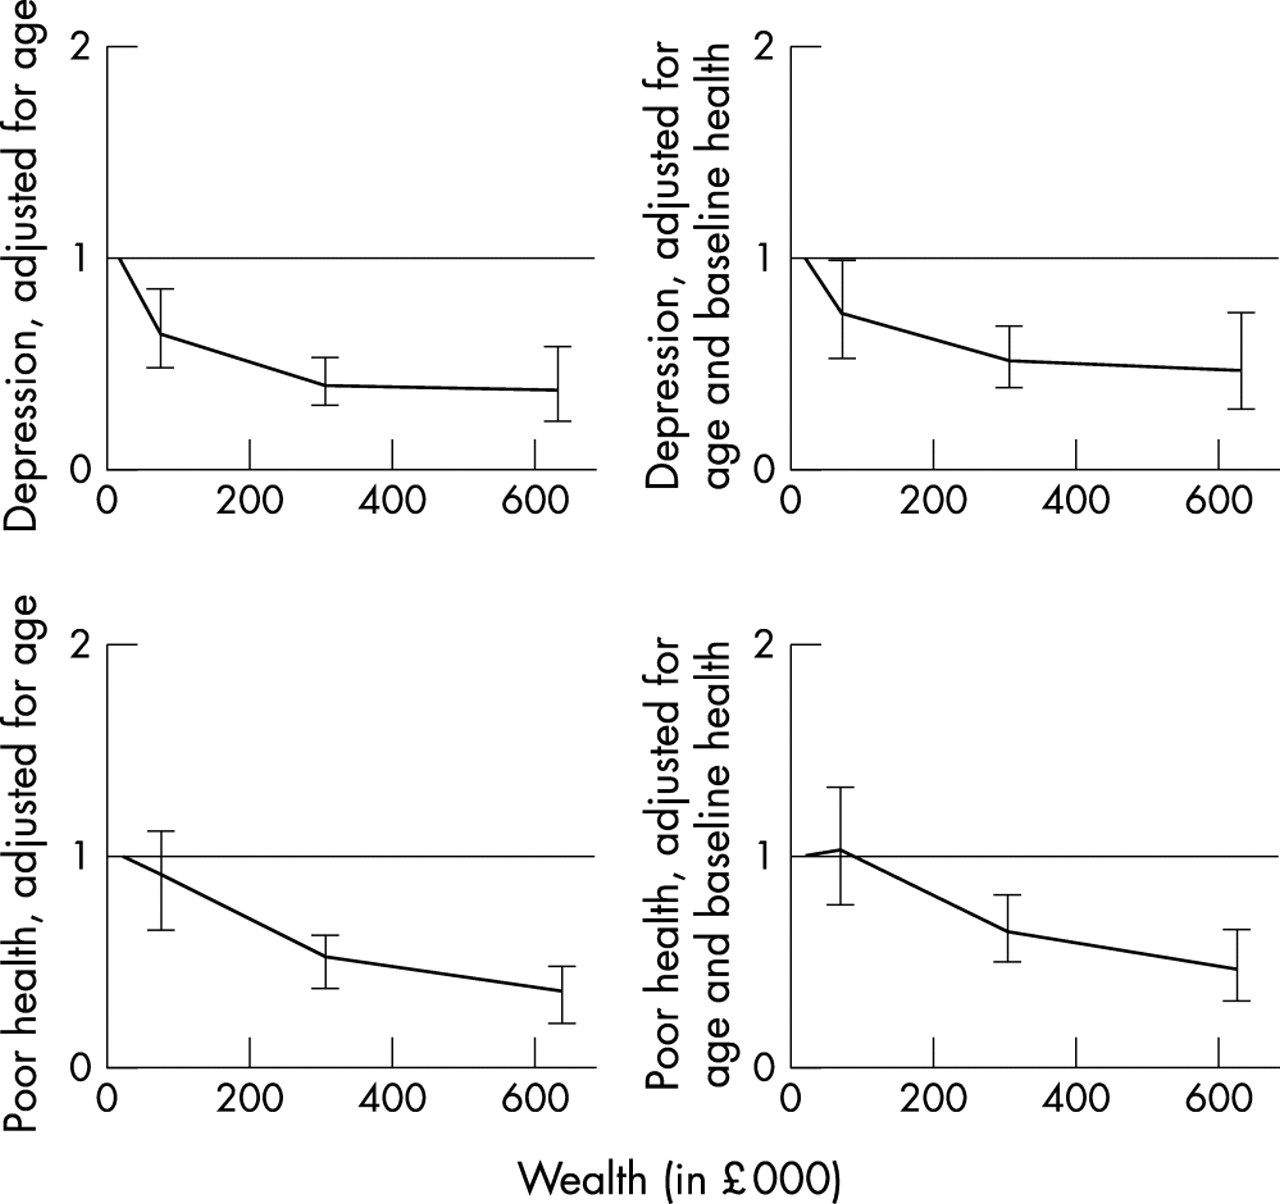
Odds ratios and 95% confidence intervals of wealth on GHQ depression and poor self rated health among men.
Personal income has a significant monotonic effect on health. The odds ratio for both depression and poor self rated health decrease rapidly as one goes from the lowest income category to higher ones. However, the rate of decrease is not uniform and only slight improvements in health are noticeable for higher income categories. When adjustments are done for baseline health, the same pattern remains, although it becomes somewhat more mixed for depression. The patterns for household income and household wealth are essentially the same with the exception that the association between poor self rated health and wealth is more linear.
In a series of further analyses we tested explicitly for the shape of the effect of income and wealth on health among men from models that adjust for baseline health (results not presented here, but available from the authors on request). Given the previous results, it is not surprising that we reject the null hypothesis of no overall effect of income or wealth on both health outcomes. Next, we tested for a linear relation, but no consistent pattern emerged. However, linearity was clearly accepted for the effect of wealth on poor self rated health. We also accepted an equal effect beyond the poorest category for personal income on both health outcomes and for household income on GHQ depression. The effect of household income on poor self rated and wealth on GHQ depression is neither characterised by a linear relation nor an equal one beyond the poorest category. From figure 1 and from the test we performed, the relation can be probably best characterised by a linear effect beyond the first category.
DISCUSSION
This study has reported on the effects of personal income, household income, and household wealth on GHQ depression and poor self rated health in a cohort of white collar men and women. Until recently, little research evidence on income and health has been available after adjusting for baseline ill health and other sociodemographic factors. This is due to the frequent omission of income from surveys on the determinants of health. The results of this study parallel the numerous earlier studies on the social class and education gradient in ill health and mortality.
However, different indicators of socioeconomic position are not simply interchangeable, because each measure reflects a partly different aspect of social stratification. The choice of measure is not without implications for the interpretation of empirical observations and our understanding of inequalities in health. Accordingly, the associations of different measures of income and wealth on health that are observed in this study may have partly different explanations and implications for health policy.
Our analyses suggest that the association between household wealth and morbidity is less affected by adjustment for ill health at baseline than is the relation between income, particularly personal income, and morbidity. For household wealth the attenuation is about 30% and for personal income about 40%–60%. These results are consistent with selection out of the labour force or to lower paid employment because of poor health being a partial explanation for health differences by personal income. Among men the association of household income and health is also strongly attenuated after adjustment for baseline health, while the association is more independent of baseline health among women. However, household wealth—a measure of accumulated income over the lifetime of the members of the household and inherited wealth—is less associated with baseline health. Furthermore, results not presented here (available from the authors on request) also show that the association between employment grade and health is only modestly attenuated by adjustment for baseline health.
Adjustment for household structure and particularly other measures of socioeconomic position further attenuated the effects of income and wealth on health. In the case of income it is plausible to argue that other aspects of socioeconomic position that causally precede income, such as previously achieved educational qualifications and occupational status, are important determinants of income levels, and that these factors may be more fundamental determinants of morbidity than income as such. If this were the case, attempts to reduce income differences in mortality are best achieved, for example, by guaranteeing more equal educational outcomes, rather than redistribution of income.
Because data were sparse for women, we were only able to assess the form of the relation between income and health among men. Even for men 95% confidence intervals were quite large and firm conclusions should be drawn with some caution. In most, but not all, instances the association is monotonic; health improves or remains the same with increasing income or wealth. Beyond that, no simple form for the relation seems to exist. We tested specifically for linearity, and equality as well as linearity of effect beyond the lowest category, but found no consistent pattern across health outcomes or income and wealth measures.
The analyses that we have presented adjust for ill health and two other measures of socioeconomic position (employment grade and education). All these variables have been measured at the baseline of the study about 10 years before the measurement of income and wealth, or in the case of education is acquired in youth for the vast majority of the cohort. We further adjust for household composition measured at the same time as income. However, although current personal income in adulthood does not seem to be a powerful independent predictor of ill health in adulthood we cannot, even with longitudinal data in middle age, determine the dynamics of income history and onset of illness beyond doubt. We have comparatively little information on what has happened to the study participants before the baseline of the study, and we do not directly measure income at baseline. In the case of wealth other measures of socioeconomic position, for example education, may in part be determined by wealth. The influence of adjusting for education in such circumstances may lead to an under-estimation of the degree to which wealth influences health status.
Key points
-
Observational studies have established a positive association between various measures of income and health at the individual level.
-
Causal interpretation of these relation is hampered by the dichotomy between determinants of income, such as education and pre-existing ill health, and the access to material and psychosocial benefits provided by that income.
-
The association between personal income, and to a lesser extent household income, and GHQ depression and poor self rated health can be to a large extent accounted for by pre-existing poor health and other measures of social position.
-
Household wealth is strongly associated with GHQ depression and poor self rated health after adjustment for pre-existing poor health and other measures of social position.
-
The association between household wealth—a measure of income earned over decades and across generations—and morbidity indicates that the causes of these associations are likely to be related to a set of early and current material and psychosocial benefits.
Furthermore, it should be acknowledged that comparing the magnitude of different measures of income and wealth on health is always compromised by data quality. Firstly, short term variability in personal income may influence the results that we observe. Secondly, asking participants to estimate the “amount of money the respondent would have if s/he cashed in all assets and paid off all their debts” may give biased estimates of household wealth. Furthermore, some participants may feel socially desirable to report higher than actual incomes and wealth. Thirdly, the response categories provided for the respondents in the Phase 5 questionnaire may not capture sufficient detail for some respondents, and this is likely to vary for the particular income measure that we use. Finally, any ranking of income and wealth measures obtained in a cohort of white collar civil servants may not reflect their relative importance in a general population.
For the analyses presented here we chose two health measures that have previously been shown to be related to grade of employment in these data. Further analyses need better assessment of the strength of the effects of income and particularly wealth on an array of different health measures; ranging from minor psychiatric morbidity to severe physical disease. Although we would expect to observe an association for many, but not all, health outcomes, those with particularly strong associations will further improve our understanding of the causal pathways involved. In addition, the different advantages with regards to health that wealth can bring deserve further study.
In summary, we have shown current personal income, household income, and household wealth to be associated with GHQ depression and poor self rated health. The association between personal income, and to a lesser extent household income, and morbidity can to a large extent be accounted for by pre-existing poor health and other measures of social position. These findings indicate that as a measure of social position income should be used cautiously in these data and possibly in health research in general. However, for household wealth, the associations are not fully understood in terms of baseline ill health or other sociodemographic factors, but an independent effect can also be observed. The independent association between household wealth—a measure of income earned over decades and across generations—and morbidity indicates that the causes of these associations are likely to be related to a set of early and current material and psychosocial benefits. Furthermore, because in modern Britain a large part of household wealth is tied up in the ownership of housing,21 household wealth may also accurately reflect the desirability and other characteristics of areas in which people live.
Acknowledgments
We thank all participating civil service departments and their welfare, personnel, and establishment officers; the Occupational Health and Safety Agency; the Council of Civil Service Unions; all participating civil servants in the Whitehall II study; and all members of the Whitehall II study team. We are grateful for Geoff Der for useful comments on an earlier draft and Petteri Sipilä for help in preparing the manuscript.
REFERENCES
Supplementary materials
. Web-only Questionnaire
The Questionnaire is available as a downloadable PDF (printer friendly file).If you do not have Adobe Reader installed on your computer,
you can download this free-of-charge, please Click hereFiles in this Data Supplement:
- [View PDF] - Questionnaire Whitehall II phase 5 questions on income and wealth that are relevant for the purposes of this study.
Footnotes
-
Funding: the Whitehall II study has been supported by grants from the Medical Research Council; British Heart Foundation; Health and Safety Executive; Department of Health; National Heart Lung and Blood Institute (HL36319), US, NIH; National Institute on Aging (AG13196), US, NIH; Agency for Health Care Policy Research (HS06516); and the John D and Catherine T MacArthur Foundation Research Networks on Successful Midlife Development and Socio-economic Status and Health. PM is supported by Academy of Finland (grant 70631, 48600) and the Gyllenberg Foundation. JF was supported by the Economic and Social Research Council (L128251046) during the preparation of this paper. MM is supported by a MRC Research Professorship.