Article Text

Abstract
Study objective: It is possible that circumstances over the lifecourse contribute to social inequalities in mortality in adulthood. The aim of this study is to assess the cumulative effect of social class at childhood and adulthood on mortality from various causes of death in young adult men.
Design: The data consist of census records for all Finnish men born in 1956–60 (112 735 persons and 895 001 person years), and death records (1834 deaths) by cause of death for 1991–98.
Main results: Mortality from each cause of death increased from the stable non-manual group to mobile groups, and further to the stable manual group. However, mortality in the downwardly mobile group was 150% higher than in the upwardly mobile group. Furthermore, analyses show that mortality was mainly related to current adult social class, though, within each adult social class men with a manual parental background showed slightly increased mortality from cardiovascular disease and from alcohol related causes.
Conclusions: In these data the effects of adult social class were stronger than childhood class for all causes of death. It is more useful to differentiate between childhood and adulthood effects than to use a combined measure of social class to assess the contribution of social class at different stages of life on mortality.
- mortality
- lifecourse
- social class
Statistics from Altmetric.com
The association between adult social class and mortality is well established.1–3 It is quite obvious that if at any given moment a person’s risk to die is associated with factors related to low (high) social class, longer exposure to these factors will increase (decrease) the risk of death. Accordingly, this kind of lifetime accumulation of social position may be an important factor behind social class mortality4 as well as health differences in adulthood.5
A typical approach to the accumulation of social class or “lifetime social class” is simply to sum up social class scores at different stages of the lifecourse. In principle, this combined measure expresses “the cumulative exposure to poor socio-economic conditions”6 more accurately than any single measure from some part of the life cycle, and it is also likely to produce larger social class differences in health. However, as analyses based on combined measures do not take into account upward and downward social mobility, it is difficult to assess the relative contribution of social class at different stages of life. Nevertheless, in the study on men employed at the beginning of the follow up, the cumulative effect of social class on mortality was observed when the direction of mobility was taken into account.7
Research on the effects of cumulative social class on health needs first of all to have a reliable measure of class at different stages of life. For this reason there has been a tendency to focus on the economically active (employed) population, a subgroup of the total population for whom social class is readily available. However, if unemployed and economically inactive persons are excluded the social class differences in mortality tend to be smaller than when information for the whole population is available.8,9 This underestimation of social class differences in mortality is explained by the poor health of the economically inactive population, and the greater probability that they come from lower occupational categories. It is probable that the exclusion of economically inactive men bias the results of studies with a lifecourse perspective.
Most research on the effects of accumulation of social class on health and mortality have analysed older adult populations. In studies concerning young adults, the accumulation perspective has been earlier used with self rated health as outcome variable5 but not with mortality. However, research results on self rated health cannot be assumed to apply to mortality, even though the first does predict the second.10
We have access to census based data on Finnish men born in 1956–60. Information on their social mobility from childhood social class to adult class covers the period from 1970 to 1990. This is somewhat later than in earlier studies4,7 and therefore reflects different economic conditions and occupational opportunities. In addition, the adverse early socioeconomic conditions faced by this younger cohort have been very different to those observed in older cohorts.11,12 Given these disparities in mortality and mobility chances between countries and birth cohorts, it is interesting to see whether social class has a cumulative effect in the context of our study as well. Furthermore, we will be able to see whether inter-generational mobility has any effect on social class differences in mortality, and whether this effect constrains7,13 or increases14,15 the social gradient in mortality.
The specific objective of the study is to assess the cumulative effect of social class at childhood and adulthood on mortality from various causes of death in the period 1991–98. We are mainly interested in the effects of the direction of inter-generational mobility on mortality.
METHODS
Data
Compiled by Statistics Finland, the data are based on 1990 census records for men who were born in 1956–60 and who were living in Finland at the time of the 1970 and 1990 censuses. Death records for 1991–98 and information concerning social class from the 1970, 1975, 1980, and 1985 censuses were linked to the 1990 census records by means of personal identification numbers. The share of deaths that cannot be linked to the census records is less than 1%.
The cohort born in 1956–60 was chosen for these analyses, because at the time of the 1970 census—when the cohort members were aged 10–14—childhood social class was available on the basis of the occupation of the head of the household (usually the father). Accurate information on parents’ occupation was not available for persons aged 15–19 because almost half of them were not living with their parents or they were working.
We excluded those born in 1956–60 whom we were not able to assign to an adult social class (4%). In addition, we excluded those who were farmers or entrepreneurs by adult or childhood social class. This exclusion was based on the recognition that it would be extremely difficult to establish how entrepreneurs and farmers compare hierarchically with non-manual and manual classes in the social class structure and therefore to say whether shifts between non-manual/manual and farmer/entrepreneur positions are ascending or descending. After these exclusions the actual study cohort consisted of 62% of all those born in 1956–60 and numerated in the 1990 census.
For the actual study cohort adult non-manual and manual social class was determined on the basis of own occupation in the 1990 census for those who were employed (91% of the cohort) or unemployed but had information on their last held occupation (6%). If a person had no occupation (2%) or occupational information was lacking (1%), information on previous occupation was searched from the 1985 census. Childhood social class was determined by occupational information on the head of household in the same manner. The social class coding at childhood and adulthood is based on Statistics Finland’s classification.16
Mortality follow up covers the period from 1991 to 1998. Altogether 1834 men died at ages 30–42. Causes of death for 1991–95 are coded according to the 1987 Finnish Classification of Diseases, which is based on the Ninth Revision of the International Classification of Diseases (ICD9).17 The codes for 1996–98 are based on the Tenth Revision of the International Classification of Diseases (ICD10).18 This change of classification has no effect on the results. The following broad groups of death are used (number of deaths in table 1):
Number of deaths and age standardised mortality rates (with 95% confidence intervals) per 100,000 person years for various causes of death in 1991–98 according to adult and childhood social class, men aged 30–34 in 1990
-
all causes
-
all diseases (that is, all causes excluding external causes)
-
cardiovascular diseases (ICD9: 390–459, ICD10:i00-i99)
-
neoplasm (ICD9:140–239, ICD10:c00-d48)
-
external causes (that is, all causes excluding diseases)
-
suicides (ICD9:E95,ICD10:x60-x84,Y870) (the single most common cause of death)
In addition to these causes of death we have distinguished alcohol related mortality as a separate cause of death because of its importance in young adults (see table 1). For the same reason we have used contributory causes of death to distinguish all deaths related to alcohol. Of the 874 deaths attributable to alcohol, alcohol is the underlying cause for 185 deaths due to disease and for 159 deaths caused by alcohol poisonings. It is a contributory cause in 71 deaths in the disease category and in 459 deaths in the external cause category. Causes included in this category are those in which alcoholic disease, such as alcoholic psychoses (ICD9:291, ICD10:F10.5), alcoholic diseases of the liver (ICD9:571.0–571.3, ICD10:K70.0-K70.9), and alcoholic diseases of pancreas (ICD9:577.0D-F,577.1C-D, ICD10:K86.00-K86.08) or poisoning (ICD9:E851, ICD10:X45) are mentioned as underlying or contributory causes of death. The classification of alcoholic causes is discussed in closer detail elsewhere.19
Study design
Person years and deaths by cause of death were tabulated by age, period, and childhood and adult social class. From these tables we have indirectly calculated age standardised mortality rates (with 95% confidence intervals),20 with mortality in the whole cohort as the standard. Approximate p values for the difference between two mortality rates are based on the Gaussian log likelihood approximation.21
We also calculated relative mortality rates (and their 95% confidence intervals) by means of Poisson regression analyses, with the cell in cross tabulation taken as the unit of analysis. The relation between mortality and the childhood and adult social classes is based on the following model:

Where E(di) is the expected number of deaths and Vi is the number of person years lived in the ith cell, x1 is age, x2 is the variable describing adult and childhood social class, and a,b1,b2 are the parameters to be estimated. The Glim statistical package was used in fitting the models.22
RESULTS
Mortality according to adult and childhood social class
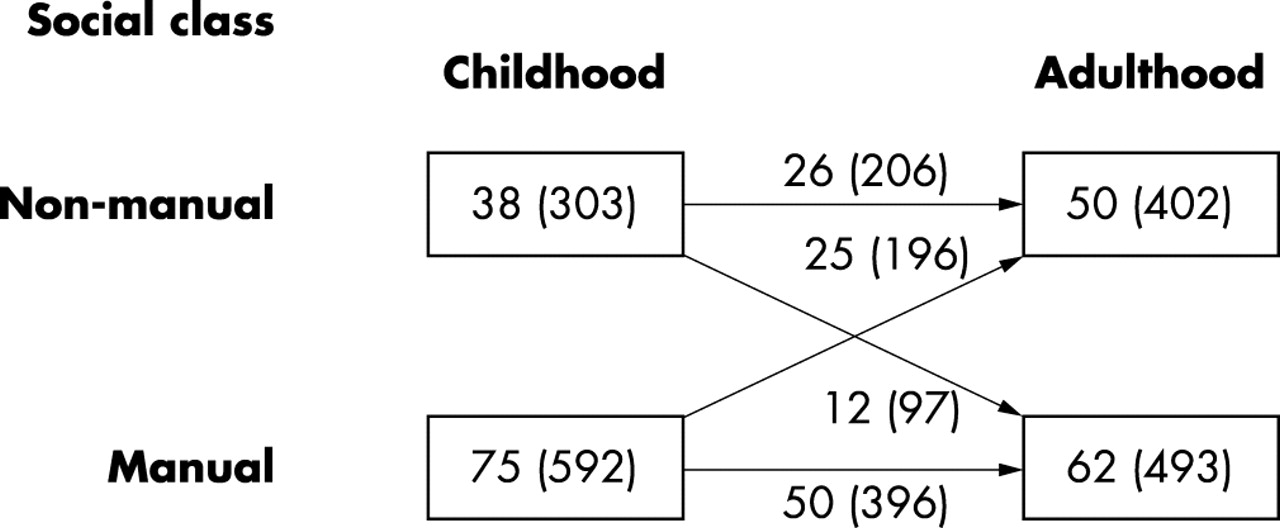
In our cohort, 23% of all men had a non-manual background and belonged themselves to the non-manual class. We call this group stable non-manual. Correspondingly, 44% of all men belonged to the manual class in childhood and adulthood—that is, to the stable manual group. Movement between social classes from childhood to adulthood was recorded for one in three men: 22% of all men moved upwards and 11% downwards. The proportion of men in the non-manual class is considerably higher for adult social class (45%) than for childhood social class (33%). In the non-manual class, 49% of the men had a manual background, while 20% of manual men had a non-manual background (fig 1).

Number of person and person years (in thousands) in 1991–98 according to childhood and adulthood social class, men aged 30–34 in 1990.
In figure 2 all cause mortality rates are first presented for the stable non-manual class, for mobile groups combined, and for the stable manual class. This highlights the accumulative effects of social class on mortality. The first bar illustrates the mortality of men who have not experienced low social class, the second bar represents the mortality of men who have experienced low social class to a lesser extent than men whose mortality is expressed in the third bar. The all cause mortality pattern alludes to a cumulative effect of social classes: there is a statistically significant trend for these three groups. However, when the socially mobile group is divided into the upwardly and downwardly mobile groups (on the right hand side in fig 2), men who have descended from the non-manual to manual class show significantly higher mortality than men moving in the opposite direction. Figure 2 shows that total mortality is clearly related to adult class. Within the adult non-manual class there is only a minor difference (20%) and within the adult manual class there is very little difference in all cause mortality between the stable and mobile groups (table 1).

Age standardised mortality rates (with 95% confidence intervals) per 100 000 person years for all cause mortality by adult and childhood social class in period 1991–98, men aged 30–34 in 1990. N-M, non-manual; M, manual. The width of the bar is directly proportional to the size of the group it refers to.
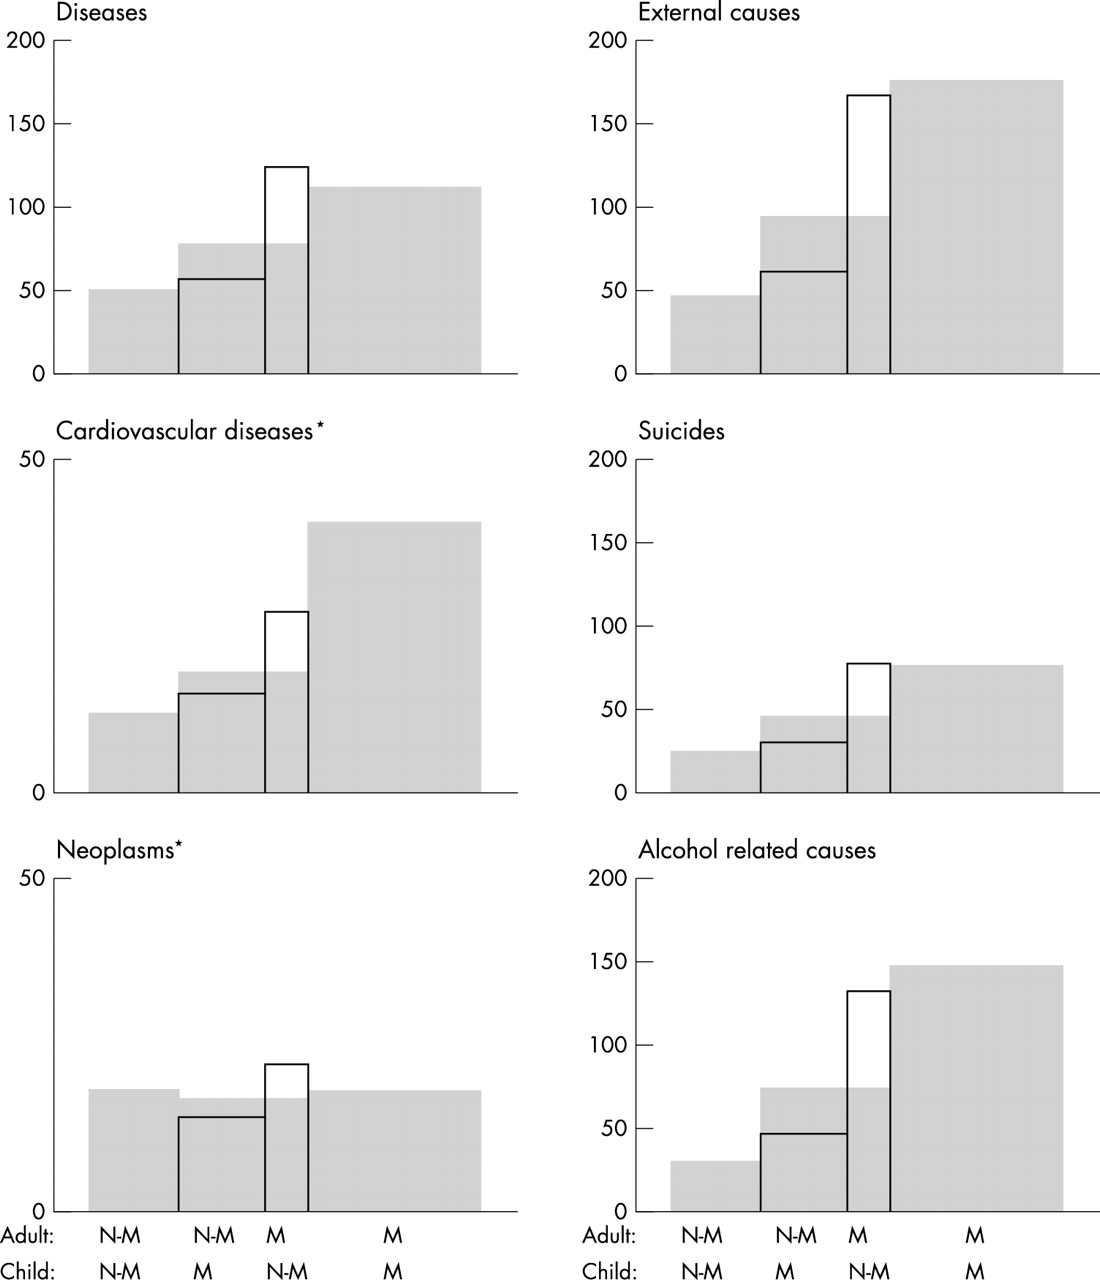
For all other specific causes of death except neoplasms, mortality increases with number of times in the manual class (shaded bars in fig 3). For neoplasms mortality differences according to childhood and adult social class are very small. For other causes of death, as above in the case of all cause mortality, the accumulative effect of social class either disappears or is attenuated when the mobility group is divided. For cardiovascular diseases and alcohol related causes the accumulative effect of social class was decreased, but we still observe a small mortality difference according to childhood class within both adult social classes. Men with a manual background show excess mortality in comparison with men with a non-manual background for cardiovascular diseases in the adult manual class (p=0.017 for the difference between the rates), and for alcohol related causes in the adult non-manual class (p=0.009) (table 1).
Age standardised mortality rates per 100 000 person years for broad causes of death by adult and childhood social class in 1991–98, men aged 30–34 in 1990. Grey bars show mortality rates when mobile groups are not divided, bars with solid line show mortality rates separately for upwardly and downwardly mobile men (see fig 2). The width of the bar is directly proportional to the size of the group it refers to. The confidence intervals are given in table 1. *Notice the different scaling.
We carried out further analyses in which we measured social class at three different time points: in childhood (in 1970, as above), at age 20–24 (in 1980), and at age 30–34 (in 1990). The number of times in the manual class (0, 1, 2, or 3) showed a clearly increasing trend for age standardised mortality rates (all cause mortality rates were: 81, 117, 175, and 235, respectively). However, when the mobility groups were separated as in the previous analyses, mortality was observed to be much more strongly associated with adult social class than childhood class. This is consistent in the results presented in the figure 2. For instance, in the non-manual social class at age 30–34, the age standardised mortality rate was only somewhat higher for those who had been twice or once in the manual class as compared with those who had never been in the manual class (mortality rates were 102, 119 (once),102 (twice) 81 (never)).
Bias related to missing occupational information among economically inactive people
The exclusion of economically inactive persons may underestimate social class inequalities in mortality. To estimate the effects of this bias on the accumulation of social class on mortality, we analysed separately all men belonging to the actual study cohort and the subgroup of employed men in 1990. In the study cohort the proportion who were employed stood at 91%, but the figure varied from 96% in the non-manual class to 86% in the manual class (table 2). The distribution of childhood social class is similar in the both groups. The results for mortality are shown for all causes and for causes for which a cumulative effect of social class was found.
Relative age standardised mortality rates for selected causes of death according to adult and childhood social class for employed men and for the whole cohort in 1991–98
The pattern of association between mortality and social class is different in these two groups, albeit we do not observe uniform differences for different causes of death. The effect of childhood class is greater for cardiovascular diseases than for alcohol related causes. In employed men, there is no difference between the socially mobile groups in cardiovascular disease mortality. For alcohol related causes mortality is greater in the downwardly than upwardly mobile group, but among manual men parental class is not associated with mortality.
For all specific causes of death, mortality differences are greater in the whole cohort than in employed men. These results indicate that the effect of childhood class in comparison with the effect of adult class may be greater in employed men than in the whole cohort, and therefore analyses of employed men may overestimate the effects of cumulative social class on mortality from cardiovascular diseases.
DISCUSSION
Our results showed a clear association between the number of times in low social class and increased mortality among Finnish men aged 30–42 at death. However, when the socially mobile group was further divided into the downwardly and upwardly mobile, mortality appeared to be almost entirely related to current adult class. In all causes of death, the relative mortality ratio between non-manual and manual men was about 3.0 irrespective of childhood social class, while within the non-manual class mortality for men with a manual background was 1.2 times higher than for men with a non-manual background. However, for alcohol related causes and particularly for cardiovascular diseases, a somewhat greater effect was observed for childhood class. It also became clear that analyses, which exclude economically inactive persons, may overestimate the cumulative effect of social class on mortality.
Key points
-
It is more useful to differentiate between childhood and adult social class than to combine them into a single measure.
-
The exclusion of economically inactive persons may overestimate the effect of childhood social class on mortality.
-
Among Finnish men the effect of adult social class on mortality was considerably stronger than that of childhood social class.
-
Childhood class had a persisting effect on mortality from alcohol related causes and particularly from cardiovascular diseases.
Reliability of the results and comparisons with other studies
In some respect the results of this register based study are more reliable than those obtained earlier. Firstly, loss to follow up and non-linkage of deaths is very small (less than 1%). Secondly, social class is determined on the basis of the same coding scheme in different phases of life. In addition, this information is always based on a contemporary register and never inquired from a person retrospectively. Thirdly, information on social class from both adulthood and childhood is available for 90% of the birth cohort.
Comparisons with our and earlier studies have to be made with caution. Firstly, studies differ with regard to the age groups they cover. For example, the Scottish cohort in the study by Hart et al7 consisted of men in the latter part of their working careers being aged 35–64 at the baseline of a 21 year follow up. Because of this age difference, compared with our study, the distribution of causes of death is not the same. Whereas in the Scottish cohort 83% of deaths were attributable to cardiovascular disease and cancer, the corresponding figure in our study was 22%. The association between all cause mortality and cumulative social class is therefore probably different in these studies as well.
Secondly, studies differ with regard to their coverage of economically inactive people. In our study, which comprised both unemployed and other economically inactive men, the most recent social circumstances had the strongest impact on mortality and the effect of accumulation was weaker. By contrast studies of employed men in Sweden23 and Scotland4,24 showed a weaker association between the most recent adult class and mortality. Our results indicate that studies confined to the economically active population may partly overestimate the effects of childhood class within the manual adult class.
Finally, social structure and social mobility also differ between countries and study periods. There were no important differences in the social structure between our study and the Scottish study mentioned above (with the non-manual class accounting for 45% of the population in our study and for 50% in the Scottish study), but even so, there were clear differences in social mobility. The figure for upward mobility in our study was 20% and in Scotland 30%, for downward mobility they were 11% and 4%, respectively. Comparison of inter-generational mobility is complicated by the use of different selection criteria of participants at baseline. The Scottish cohort was in the active labour force and in the latter part of its working career and was therefore a more selected group than ours.
Malignant neoplasms and cardiovascular disease
Our finding of no association between adult and childhood social class and mortality from neoplasms was in accordance with another Finnish study on men aged 35–49.25 However, at older ages mortality from neoplasms is more related to adult social class,4,25 partly because of an increasing incidence of lung cancer. There are some cancers such as liver, testis, prostate, and stomach cancer that may have their origin in very early life,26–28 but these cancers are rare in our cohort.
There was some indication in our data that lifetime social class could have an accumulative effect on cardiovascular disease. In these causes men with a manual background had excess mortality in both the non-manual and the manual adult social class. Only 13% of all deaths were attributable to cardiovascular disease, but by age 65 this proportion will increase to almost 50%. Therefore, if the mortality pattern found for cardiovascular disease holds with age, it will probably also be established for mortality from all causes of death combined.
Social circumstances in different stages of the lifecourse probably have different effects on different specific cardiovascular diseases.29–31 However, the age groups we are studying are too young for us to study various cardiovascular diseases such as stroke and coronary heat disease separately.32 In several earlier studies cardiovascular diseases have been analysed as one category, and their results have confirmed that living conditions in childhood and youth have an effect on mortality from this cause of death.4,23,24 Our results further showed that adult social class had a much greater effect on total cardiovascular disease mortality than childhood class. This is consistent with the findings showing that adult socioeconomic position and lifestyle are more important characteristics of cardiovascular disease and cardiovascular risk factors than childhood socioeconomic position or other childhood circumstances.11,33,34
In a Scottish cohort there was less divergence in the mortality risks associated with childhood and adulthood social class.7 However, when we excluded economically inactive and unemployed men from our analyses the results were in line with the Scottish findings,7 indicating that the different mortality patterns in these two studies may be partly attributable to differences in data compositions. In older cohorts where larger numbers tend to drift out of the labour force, there may be more intense bias related to the exclusion of the economically inactive population than in our study.
Alcohol related and external causes
In this Finnish male cohort we found that childhood social class was associated with mortality from alcohol related causes within the non-manual and manual class in adulthood. Furthermore, if alcohol related causes were excluded from all causes of death, the excess mortality of those with a manual background in the non-manual class disappeared.
Among young Finnish men alcohol related causes account for a large proportion of all deaths, and they are an important factor behind socioeconomic differences in mortality.35,36 Furthermore, social background has an independent effect on alcohol related mortality.32
Studies of cumulative lifetime exposure to adverse environments have usually been concerned with their effects on adult chronic disease.12,37,38 However, not only biological but also social, behavioural, and psychosocial chains of risk operate during the life span affecting besides biological embedding,39 but purportedly also external risks.40,41 Cumulative or pathway effects may thus be seen not only for mortality from diseases, but for mortality from external and alcohol related causes, especially at young ages when people may take more risks, for example on the road.42,43
Social mobility and its association with social class differences in mortality
In our study men entering the non-manual class had substantially lower mortality than men in the manual class, and slightly higher mortality than stable non-manual men. The mortality of manual class men originating from the non-manual class was substantially higher than the mortality of men in the non-manual class (with the exception of neoplasms) but their mortality was clearly lower than mortality of stable manual men in cardiovascular diseases, slightly lower in external and alcohol related causes, and slightly higher in all diseases combined. In all diseases the mortality differences between the mobile groups point in the direction of health related or selective social mobility.
In general, however, social mobility marginally constrained the mortality differences by social class in adulthood. Particularly for cardiovascular diseases and alcohol related causes, the excess mortality of the adult manual class including a downwardly mobile group compared with the non-manual class including an upwardly mobile group, is substantially smaller than the excess mortality of the stable manual class compared with the stable non-manual class (by 24% and 28%, respectively). In earlier studies it has been shown that social mobility either constrains7,13 or enlarges,44 albeit moderately, social class differences in mortality. Very small effects have also been found in studies using other outcomes than mortality, for instance self reported health in young adulthood.45 These results thus indicate that social mobility has both selective (persons with, for example, poorer health or some other unfavourable characteristic46 are somewhat more likely to move downwards in the social hierarchy) and accumulative effects (upwardly mobile persons are carrying some exposures from their past), but they have only very limited impact on social class differences in mortality.
In summary, the research evidence on the accumulative effects of social disadvantage on health and mortality is inconclusive. It is likely that the extent of accumulation differs for different health outcomes and age groups. Furthermore, national differences and differences in the experiences of successive birth cohorts, for example in the degree of social mobility, may modify the accumulative effects of social disadvantage on health.
The attraction of a composite lifetime indicator of social class is that it yields larger socioeconomic differences in mortality than any single measure of social class of at any particular time point. On the other hand, this kind of combined measure does cause difficulties in assessing the contribution of social class at different stages of life. In our study the conclusions changed essentially when the direction of social mobility was taken into account. These analyses showed that it is more useful to differentiate between childhood and adulthood effects than to use a combined measure of social class.
In conclusion, these data on 30–34 year old Finnish men at the beginning of an eight year follow up show that adverse social circumstances as measured by social class in childhood and early adulthood, have only a weak cumulative effect on total mortality. A modest cumulative association was observed in mortality from alcohol related causes and cardiovascular diseases. However, even in these causes of death the effects of adult class were much stronger than those of childhood class.
Acknowledgments
We thank Clyde Herzman and Tapani Valkonen for commenting on the manuscript.
REFERENCES
Footnotes
-
Funding: Doctoral programme “Population, Health, and Living conditions”, the Academy of Finland (grant 41498, 48600,70631) have funded the study and Statistics Finland have granted access to the dataset (permission TK 53–1783–96).
-
Conflicts of interest: none declared.