Article Text

Abstract
Objective: To describe new measures of risk from case-control and cohort studies, which are simple to understand and relate to numbers of the population at risk.
Design: Theoretical development of new measures of risk.
Setting: Review of literature and previously described measures.
Main results: The new measures are: (1) the population impact number (PIN), the number of those in the whole population among whom one case is attributable to the exposure or risk factor (this is equivalent to the reciprocal of the population attributable risk); (2) the case impact number (CIN) the number of people with the disease or outcome for whom one case will be attributable to the exposure or risk factor (this is equivalent to the reciprocal of the population attributable fraction); (3) the exposure impact number (EIN) the number of people with the exposure among whom one excess case is attributable to the exposure (this is equivalent to the reciprocal of the attributable risk); (4) the exposed cases impact number (ECIN) the number of exposed cases among whom one case is attributable to the exposure (this is equivalent to the reciprocal of the aetiological fraction). The impact number reflects the number of people in each population (the whole population, the cases, all those exposed, and the exposed cases) among whom one case is attributable to the particular risk factor.
Conclusions: These new measures should help communicate the impact on a population, of estimates of risk derived from cohort or case-control studies.
- impact numbers
- risk
- aetiology
- PIN, population impact number
- CIN, case impact number
- EIN, exposure impact number
- ECIN, exposed cases impact number
- NNT, number needed to treat
- CHD, coronary heart disease
- PAF, population attributable fraction
- AF, aetological fraction
Statistics from Altmetric.com
- PIN, population impact number
- CIN, case impact number
- EIN, exposure impact number
- ECIN, exposed cases impact number
- NNT, number needed to treat
- CHD, coronary heart disease
- PAF, population attributable fraction
- AF, aetological fraction
We have previously described the disease impact number (DIN) and the population impact number (PIN) to provide a population focus to the interpretation of the results of a randomised controlled trial (RCT).1 The DIN is defined as “the number of those with the disease in question amongst whom one event will be prevented by the intervention”, and the PIN is defined as “the number of those in the whole population amongst whom one event will be prevented by the intervention”. The PIN and DIN were derived as measures that extend the idea of the number needed to treat (NNT), a measure that permits the clinician and consumer to understand easily the impact of an intervention. The DIN and PIN were devised to give a population health perspective to the impact that an intervention can have on disease treatment in a given setting. Smeeth and Ebrahim have described the steps in the chain from trial efficacy to community effectiveness.2
There is a similar need for measures that reflect the impact of a risk factor on a population. For example, what is the impact of hypertension on the incidence of coronary heart disease (CHD) in the entire community? How many deaths from CHD among smokers are directly attributable to smoking? To answer these sorts of questions, we now extend the PIN to the interpretation of cohort or case-control studies of disease aetiology. The impact of specific risk factors can be described in a given population, using measures like DIN and PIN, in a way that is likely to be easily understood by policy makers, health care providers, and consumers. In addition we introduce the case impact number (CIN), the exposure impact number (EIN), and the exposed cases impact number (ECIN), which relate the impact of a risk factor to all those with the outcome (cases), all those exposed, and all those who are both exposed and have the outcome, respectively, in a population.
METHODS AND RESULTS
PIN, CIN, EIN, and ECIN in cohort studies
For a RCT the reduction in risk attributable to the intervention is the absolute difference between the incidence proportion of events in the group exposed to the treatment, Ie, and the incidence proportion of events in the control, or unexposed, group, Iu. This can also be expressed as Iu × (RR-1). The NNT is the reciprocal of this attributable risk. The NNT provides a measure of the impact of treatment. In the same way, we have defined these new impact measures as reciprocals of the excess risk at a population level.
We can define our population in at least four different ways, and each measure shows the impact of a risk factor in each of those populations. The derivation of these measures is shown in the appendix. We describe the measures in terms of numbers of cases within a specified period that are attributable to the risk factor (assuming that causation is well established).
1 The entire community from which people with and without disease are drawn
The PIN, is “the number of those in the whole population amongst whom one case is attributable to exposure to the risk factor”. For studies of disease aetiology, the excess risk attributable to the risk factor for this population is defined as the population attributable risk.3 The PIN is the reciprocal of this population attributable risk. This can be written as where Pe is the proportion of the population who are exposed to the risk factor and Iu is the incidence proportion of disease in those not exposed to the risk factor.
2 All those people with the disease, that is, cases
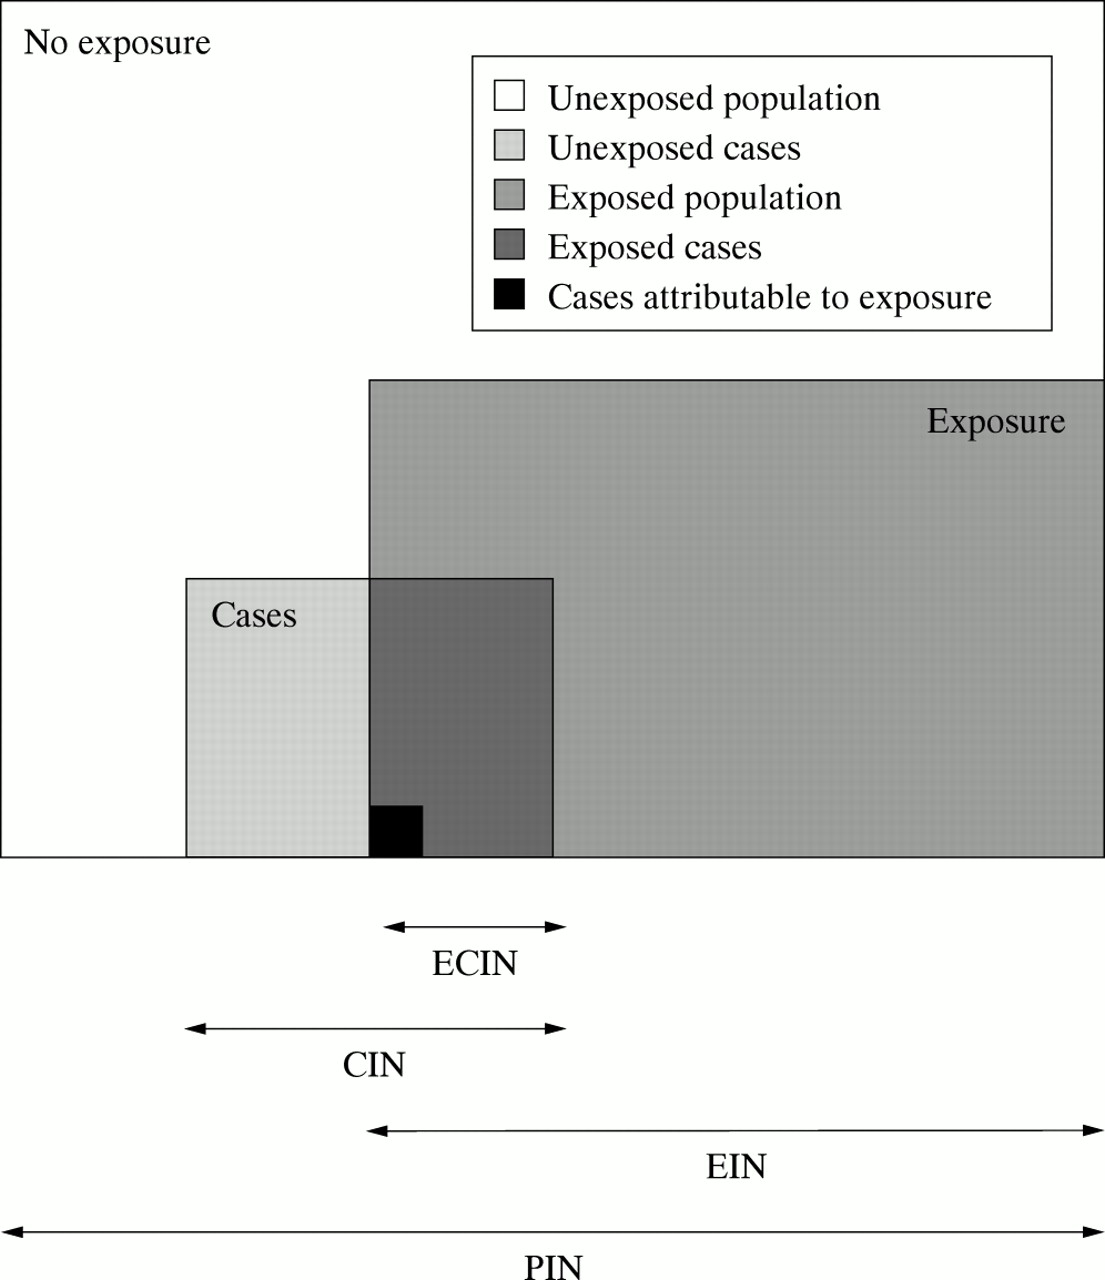
This is a subset of the entire population, see figure 1. The CIN, is “the number of people with the disease for whom one case will be attributable to the exposure or risk factor”. The excess risk attributable to the risk factor for this population is the population attributable fraction (PAF),3 the fraction of disease in a population attributable to the particular exposure. The CIN is the reciprocal of the PAF and can be written as

Visual representation of the respective population to which each impact number relates. PIN, population impact number (relates to the total population); EIN, exposure impact number (relates to the exposed population); CIN, case impact number (relates to total cases); ECIN, exposed cases impact number (relates to exposed cases).
3 All those with the risk factor or exposure
This represents a different subset of the entire population (see fig 1). The EIN, is “the number of individuals with the exposure amongst whom one excess case is due to the exposure”. This is the reciprocal of the absolute risk difference or attributable risk and can thus be written as: This measure has been previously defined in the context of therapeutic interventions as the NNTH, the number of patients needed to be treated for one additional patient to be harmed.4
4 The population with both the risk factor or exposure and the disease
This represents the cases who have been exposed (see fig 1). The ECIN, is “the number of exposed cases amongst whom one case is due to the exposure”. The excess risk attributable to the risk factor in this population is the aetiological fraction (AF).5 The ECIN is the reciprocal of the AF and can thus be written as:
These measures should be qualified by an appropriate timeframe; for example, number of cases per year.
Examples of the ECIN, EIN, CIN, and PIN in cohort studies
As an example, let us look at the risk from cigarette smoking on two outcomes, CHD, and lung cancer.6 In this study, about 30% of the population were smokers (table 1).
Illustration of impact numbers estimated from a cohort study6
For coronary heart disease, the numbers are interpreted as follows:
PIN: for every 1302 people in the community, there is on average one CHD death attributable to smoking per year.
EIN: For every 391 people who smoke, there is on average one death from CHD attributable to the smoking per year.
CIN: For every 6.4 people who die from CHD, on average one is attributable to smoking.
ECIN: For every 2.6 smokers who die from CHD, on average one is attributable to their smoking, or for about every five smokers who die from CHD, two are attributable to their smoking.
For lung cancer, the numbers are interpreted as follows:
PIN: for every 2564 people in the community, there is on average one lung cancer death attributable to smoking per year.
EIN: For every 769 people who smoke, there is on average one death from lung cancer attributable to the smoking per year.
CIN: For every 1.26 people who die from lung cancer, on average one death is attributable to smoking, or for about every five people who die from lung cancer, four are attributable to smoking.
ECIN: For every 1.08 smokers who die from lung cancer, on average one death is attributable to smoking, or for every 14 smokers who die from lung cancer, 13 are attributable to smoking.
Extending the ECIN, EIN, CIN, and PIN to case-control studies
In using data from case-control studies, it is necessary to approximate the relative risk, RR, in the formulas by the odds ratio, OR (with the usual assumption that the outcome is rare). In population based case-control studies, Pe and Iu in the formulas described above, can be calculated exactly. However, to obtain Pe and Iu for usual case-control studies, two assumptions need to be made: that controls are representative of the general population, and that the prevalence of exposure is low. Under these conditions, the proportion of the total population who are exposed to the risk factor Pe can be approximated by the proportion of the control group who are exposed to the risk factor, and the incidence proportion in the unexposed group, Iu, can be approximated by the incidence proportion in the total population. This latter incidence proportion, It, is usually not included in typical case-control studies, and may need to be obtained from other sources. We have used as an example, the risks of atrial fibrillation and cigarette smoking for stroke in a population based case-control study, where there were 267 cases of first stroke in a year among a population of 388 821 aged under 80 years (the rate being 68.6691 per 100 000 per year).7
Despite the greater risk associated with atrial fibrillation than heavy smoking, suggested by the odds ratios, these new measures indicate that in the total population (PIN), and the population with stroke (CIN), the numbers of people among whom one stroke is attributable to the risk factor are fairly similar; this is because the lower odds ratio for smoking is counter-balanced by the higher prevalence of exposure (table 2). The impact numbers for the exposed populations (EIN) however differ substantially reflecting the differences in odds ratios. The impact numbers for populations with stroke and exposure to each of the risk factors (ECIN) are unaffected by incidence of disease or prevalence of exposure and do not strongly reflect the differences in odds ratios because the odds ratios occur in both the numerator and the denominator.
Impact numbers for stroke in a case-control study7
Applying the ECIN, EIN, CIN, and PIN to another population
You may wish to use estimates of risk from an observational study to apply to your own setting. Provided that the generalisation is appropriate, you may use the relative risk or odds ratio estimate from the study, with the disease incidence and risk factor prevalence for your own population of interest to calculate the various impact numbers.
To use the example of smoking and CHD mortality given above: assume that in your population of interest, the CHD death rate among non-smokers is 300 per 100 000 per year (instead of 413) and the prevalence of smokers is 20% (instead of 30%). We can use the same RR of 1.62 from the previous study. When we calculate the impact numbers using the formulas given above, PIN becomes 2689 (instead of 1302), CIN becomes 9.06 (instead of 6.38), EIN becomes 538 (instead of 390.6), and the ECIN remains at 2.6 (as it depends solely on the RR, and not on the incidence of the disease or risk factor in the population of interest).
Extension to continuous risk factors
Although we have considered only dichotomous risk factors (present/absent) the method can easily be extended to risk factors with multiple levels of exposure. If, for example, you wanted to look at the public health impact of homocysteine on CHD deaths, one could use the same formulas and the information for Pe and RR in the highest quintile of homocysteine relative to the lowest quintile.
Statistical characteristics
The NNT is a way of reporting benefit (or risk). As a statistic it has rather poor properties; in particular confidence intervals may be difficult to interpret when the difference in effectiveness between treatments is small.8–10 The numbers described here have the same limitations. For example, because the formulas use reciprocals if the estimate of excess risk is near zero the impact number will be very large and can be affected strongly even by rounding in the calculations. Also, if the “risk” factor is protective so that the estimate of excess risk is negative, the impact number should be interpreted in terms of outcomes prevented. Confidence limits for impact numbers also have these problems. When the risk estimate is large and positive, it is possible in principle to obtain easily interpretable confidence limits for the impact number. This would entail the calculation of standard errors, taking into account the variability in risk factor prevalence, disease incidence proportions, and relative risks, and use of an appropriate transformation so that the statistic is approximately normally distributed. Thus the calculation of confidence limits entails many assumptions and approximations so that the nominal probability levels may be misleading.
From a public health perspective interval estimates of impact obtained from sensitivity analyses are likely to be more useful than confidence intervals. For instance, various plausible values for the prevalence of exposure and disease incidence in the study population could be used with published estimates of relative risk or odds ratios (and possibly the confidence limits of these parameters) to calculate estimates of excess risk. Provided the estimates are positive and not very small they can be inverted to produce valid impact numbers. If they are negative then the impact numbers describe protective effects. If they are very small then the impact numbers will be very large. The range of impact numbers calculated in this way illustrates the impact of the risk factor under plausible scenarios.
DISCUSSION
We have proposed four measures, based conceptually on the NNT, to express the impact of a risk factor on the incidence of disease, each measure reflecting the impact on a different population. The nomenclature was chosen to indicate the relevant population: PIN refers to the entire population, CIN to those who are cases with the disease, EIN to people with the exposure, and ECIN to exposed cases. The impact number reflects the number of people in each of those populations among whom one outcome is attributable to the particular risk factor.
The advantages of these measures are the same as those of the NNT; they are intuitively easier to understand than their reciprocals. We anticipate that they will be useful in communicating the population impact of various risk factors to public health professionals, administrators, those involved in public policy, and the lay public.
Key points
-
We describe new measures of risk from case-control and cohort studies, which relate to numbers of the population at risk and likely to be easily understood by policy makers, health care provides, and consumers.
-
The population impact number (PIN) is the number of those in the whole population among whom one case is attributable to the exposure of risk factor (this is equivalent to the reciprocal of the population attributable risk).
-
The case impact number (CIN) is the number of people with the outcome for whom one case will be attributable to the exposure of risk factor (this is equivalent to the reciprocal of the population attributable fraction).
-
The exposure impact number (EIN) is the number of people with the exposure among whom one excess case is attributable to the exposure (this is equivalent to the reciprocal of the attributable risk).
-
The exposed cases impact number (ECIN) is the number of exposed cases among whom one event is attributable to the exposure (this is equivalent to the reciprocal of the aetiological fraction).
The measures only make sense when causality between exposure and outcome has been shown, with causality judged according to the usual criteria. The choice of which of these measures should be used, will depend on the purpose. Taking as an example the development of an antismoking education programme, the PIN and the EIN could help the policy maker decide on funding the project from the viewpoint of the potential benefit to the whole population and the numbers of smokers to be targeted to potentially prevent one death respectively. The CIN and ECIN could comprise part of the message given to cigarette smokers to express the risks they run.
These measures are linked to the incidence of disease and the proportion of the population with exposure to a specific risk factor. Therefore, they are not transportable from one population to another, in the same way that the RR or the OR are. Rather than being a drawback, this is an advantage, as users can tailor their estimates to reflect their population of interest. Estimating these numbers reliably depends on local population based registers. This highlights the type of information required to implement these aids.
In an environment of limited financial resources, it is even more important that policy makers have access to tools that will allow them to assess the relative impact of risk factors in their population. This will permit more appropriate allocation of resources to identifying those factors that are most important in the given setting.
APPENDIX
In the same way that NNT is the reciprocal of the attributable risk, we have defined our new measures as the reciprocals of the excess risk at a population level. As discussed in the paper we can define the population in at least four ways:
(1) The entire community from which those with and without disease are drawn. For cohort studies, the excess risk attributable to the risk factor for this population is the PAR or population attributable risk, and the reciprocal of this value is the population impact number, PIN. where AR is the attributable risk, defined as (Ie-Iu), where Ie is the incidence proportion in the exposed group, Iu is the incidence proportion in the unexposed group and Pe is the proportion of the population that is exposed to the risk factor. Therefore,
  where RR = Ie/Iu is the relative risk. The PAR is the proportion of people with disease attributable to the risk factor and its reciprocal, the PIN, is “the number of those in the whole population amongst whom one case is attributable to the exposure”.
(2) All those with disease; that is, cases. For cohort studies, the excess risk attributable to the risk factor for this population is the population attributable fraction (PAF), and the reciprocal of this is the case impact number, CIN. where PAR is the population attributable risk, defined above, and It is the total incidence proportion of the outcome in the entire cohort—that is, both exposed and unexposed groups
  Therefore,
 If both the numerator and denominator are divided by Iu we obtain
 The PAF is the proportion of people with the disease in the population in whom the disease attributable to the particular exposure and so its reciprocal, the CIN, is “the number of people with the disease for whom one case will be attributable to exposure to the risk factor.”
(3) All those with the risk factor or exposure. The excess risk for this population is the absolute risk difference (AR), and the reciprocal of this is the exposure impact number, EIN.
Therefore, The AR is the excess incidence proportion of cases among those with the exposure, and its reciprocal, the EIN, is “the number of people with the exposure among whom one excess case is attributable to the exposure or risk factor”.
(4) All those with the both the risk factor or exposure and the disease (the exposed cases). The excess risk attributable to the risk factor in this population is the aetiological fraction, and its reciprocal is the exposed case impact number, ECIN.
 and
and Divide both the numerator and denominator by Iu to obtain
 The aetiological fraction is the proportion of all cases in the exposed group that is attributable to the exposure, and its reciprocal, the ECIN, is “the number of exposed subjects with disease among whom one case is attributable to the exposure”.
To highlight the relation between these various measures, we can see that:

Footnotes
-
Funding: none.
-
Conflicts of interest: none.
Linked Articles
- In this issue