Article Text

Abstract
Study objective: Several studies have reported an association between income inequality and increased mortality, but few have used net income data, controlled for individual income, or evaluated sensitivity to the choice of inequality measure. The study tested the hypotheses that people in regions of Britain with the greatest income inequality would report worse health than those in other regions, after adjusting for individual socioeconomic circumstances.
Design: Cross sectional survey.
Setting: England, Wales, and Scotland.
Participants: 8366 people living in private households
Main results: Regional income inequality, measured using the Gini index, was associated with worse self rated health, especially among those with the lowest incomes (adjusted OR 1.55, 95% CI 1.24 to 1.92) (p<0.001). This association was not robust to the choice of income inequality measure, being maximal for the Gini coefficient and weakest when using indices that are more sensitive to income differences among those at the top or bottom of the income distribution.
Conclusions: The study found limited evidence of an association between income inequality and worse self rated health in Britain, which was greatest among those with the lowest individual income levels. As regions with the highest income inequality were also the most urban, these findings may be attributable to characteristics of cities rather than income inequality. The variation in this association with the choice of income inequality measure also highlights the difficulty of studying income distributions using summary measures of income inequality.
- inequalities
- income
- self rated health
Statistics from Altmetric.com
Although people with the poorest material standard of living experience the highest mortality, independent of occupational social class,1 it is not yet known to what extent health is determined by the characteristics of places where people live.2,3 This question is thrown into sharp relief by the study of the effects of income inequality.4
An association between income inequality and higher mortality has been found in most,5–10 but not all,11 studies in developed economies. Two recent studies have also demonstrated an association between income inequality and mortality in Taiwan and Russia, countries undergoing rapid economic change.12,13 A similar association has been reported in the US with (worse) self rated health,14 a robust predictor of mortality across the age span.15 However, as associations between individual income level and these health outcomes are generally non-linear,16 it has been argued that the reported associations with income inequality may have arisen because areas of high inequality have more poor people.17 Three recent studies that controlled for household income7,14,18 produced conflicting findings. These studies used differing outcomes (namely mortality,7 self rated health,14 and risk factors for cardiovascular disease18). Interestingly, the one study to employ mortality as an outcome7 failed to detect an association with income inequality independent of individual income. Many previous studies are also limited by the use of gross household income data, unadjusted for household composition or taxation. Inconsistencies have also been noted between findings based on different measures of income inequality, which treat income differences among different parts of the income distribution in different ways.19,20
While the mechanisms underlying any association between income inequality and mortality continue to be hotly debated,3,4,21,22 two questions remain: are there area level socioeconomic risk factors for mortality and morbidity that are independent of the characteristics of individuals, and if so, do the two types of risk factor interact with one another in their effects on individual health? The aim of this study was to test the hypotheses that (1) people living in regions of Britain with the most unequal income distribution would report worse health than those in other regions, after adjusting for age, sex, and individual socioeconomic characteristics, and (2) the association between income inequality and worse self rated health would extend across all socioeconomic strata.
METHODS
Data were gathered as part of the first wave of the British Household Panel Survey (BHPS), in Autumn 1991.23,24 The BHPS is an annual survey of a representative sample of people in private households in England, Wales, and Scotland. Households were selected for the BHPS using a two stage, implicitly stratified clustered probability design, with postcode sectors as primary sampling units.23 The population of postcode sectors was first ordered into 18 regions (16 standard regions in England, distinguishing former Metropolitan Counties and Inner and Outer London in England, plus Wales and Scotland) (see table 1), resulting in a sample broadly representative of regional populations. Interviews were conducted with all members of selected households aged 16 and over. Individual BHPS participants aged 16–75 who completed the question about self rated health (see below) were included in this analysis. The BHPS investigators complied, in full, with the Ethical Guidelines of the Social Research Association.23 Specific ethical approval was not sought for this secondary analysis, which was based on anonymous data supplied by the Economic and Social Research Council (ESRC) Data Archive, in concordance with its regulations.
Number of participants, prevalence of poor self rated health, median net current equivalised income (to the nearest £), and Gini coefficients, in descending order of the latter
Health status
Self rated health was assessed using the question “Compared to people of your own age, would you say that your health over the past 12 months has on the whole been excellent, good, fair, poor or very poor?”. In our analyses, “poor health” refers to responses “fair”, “poor” or “very poor”, which were compared with “excellent” and “good”. We evaluated the sensitivity of our findings by repeating our analyses with responses coded as 1 for “poor” or “very poor” (referred to as “very poor health”), and 0 otherwise.
Measures of income
Gross income data expressed as pounds per week were collected by source for each BHPS respondent, and aggregated to derive measures of household income. Gross income includes earnings from employment, self employment, savings, investments, private and occupational pensions, and from cash social security and social assistance benefits. Net household income is equal to gross household income less income tax payments, National Insurance contributions, and local taxes. These data were constructed for all persons in the survey by means of a simulation model of the tax system.25 The BHPS net income definition is the same as used by the DSS when compiling the official UK income distribution statistics.26 Our BHPS data have been validated against the 1991 DSS figures derived for the Family Expenditure Survey.25
Wherever possible, BHPS interviewers sought documentary confirmation of income data. The BHPS investigators imputed missing gross income data.23,27 These values were used to reduce potential bias arising from the exclusion of missing data. Net income data could not be estimated for the small number of households in which one or more adults refused to be interviewed, because imputed values for missing income components are not available.
All income data in this study were adjusted using the McClements (before housing costs) Equivalence Scale,23 to take account of differences in household size and composition. In keeping with standard practice,25 each person was attributed with the equivalent (net or gross) income of the household to which they belong. Participants were then classified in two ways, according to their income. Firstly, participants were allocated to one of 11 bands, starting at <£100 per week and increasing in increments of £50 per week. Secondly, participants were classified by income rank, by decile group within region.24,27
Measure of income inequality, by region
Our primary index of income inequality was the Gini coefficient, a measure that ranges from 0.0 when everyone has the same income (perfect equality) to 1.0 when one person has all the income (perfect inequality). We chose the Gini coefficient because it is the most widely used summary measure of income inequality, has a neat relation with the Lorenz curve for incomes, and is also relatively insensitive to the presence of outlier incomes at the top and bottom of the income distribution. To further minimise contamination by outlying income values, income inequality indices were calculated after omitting negative values and those in the remaining top 1% and bottom 1% of the income distribution.28 As income was not normally distributed, median income was chosen as the indicator of the central tendency of income distribution in each region.
We evaluated the sensitivity of our findings to the choice of inequality measure by repeating our analyses using four other inequality indices, namely members of the generalised entropy class of inequality indices, GE(α), for α = –1, 0, 1 and 2.29 GE(0) is the mean log deviation, GE(1) is the Theil index, and GE(2) is half the squared coefficient of variation. These measures differ in their sensitivities to differences in different parts of the income distribution. The more positive α is, the more sensitive GE(α) is to income differences among the rich; the more negative α is, the more sensitive GE(α) is to income differences among those at the bottom of the distribution. Estimates of indices for values of α outside the range −1 to 2 are unduly affected by outlier incomes, and are therefore rarely used. All income inequality indices were estimated using a programme written by one of the authors (SPJ).29
The distributions of scores on all five inequality indices were skewed to the right. To remove this, scores were transformed logarithmically (Gini, GE(0), GE(1) and GE(2)), or by reciprocal transformation (GE(-1)). Post-transformation scores on each inequality index were divided into four categories.14 Category 1 (“low inequality coefficient”) included regions with inequality coefficients less than one standard deviation below the sample mean; category 2 included regions with coefficients within one standard deviation below the mean; category 3 included regions with coefficients within one standard deviation above the mean; and category 4 (“high inequality coefficient”) included regions with coefficients more than one standard deviation above the mean.
Potential confounders
Age, sex, housing tenure, registrar general's social class by head of household, marital status, education, employment, and ethnicity were included as potential individual level confounders of any association between income inequality and self rated health.
Statistical analysis
Unadjusted and adjusted odds ratios with 95% confidence intervals, and likelihood ratio tests (LRTs) to assess departure from linear trends, confounding and effect modification were calculated by means of logistic regression, using Stata.30 Wherever regional exposures were included, regression analyses were conducted using the Huber-White sandwich estimator of variance to control for the clustering of respondents within regions.31
RESULTS
After excluding “deadwood” addresses, 73.6% of households (n=5511) participated in the first BHPS wave, comprising 9612 individuals aged 16–75. Estimates of current gross income were available for the entire sample. Net income data were available for 4826 (87.6%) households, and 8371 people aged 16–75. In total, 8366 participants were included in the present analyses, amounting to 87.0% of those aged 16–75 who were interviewed at wave 1 of the BHPS, or approximately 64% of the non-deadwood issued sample for this survey (assuming similarity in the age distributions of participants and non-participants). The prevalence of poor health was 25.3% (95% CI 24.4 to 26.2), and very poor health 7.8% (95% CI 7.3 to 8.3).
The overall Gini coefficient was 0.290, with a regional range of 0.258 to 0.324 (table 1). Five regions (Inner and Outer London, West Midlands Conurbation, Greater Manchester, and Merseyside) were classified as “high Gini” regions, and three as “low Gini” regions (South Yorkshire, Rest of Yorkshire and Humberside, and Southwest). Statistically significant associations were found between higher Gini coefficient and greater proportions of participants who were unemployed (κ2=28.1, df=3, p<0.001), living in rented accommodation (κ2=56.4, df=3, p<0.001), and of younger age (55 and under) (κ2=20.7, df=2, p=0.002). A statistically significant positive correlation was also found between Gini coefficient and median regional income (Spearman's r=+0.43, p<0.0001). Similar associations were found with all of the other income inequality indices.
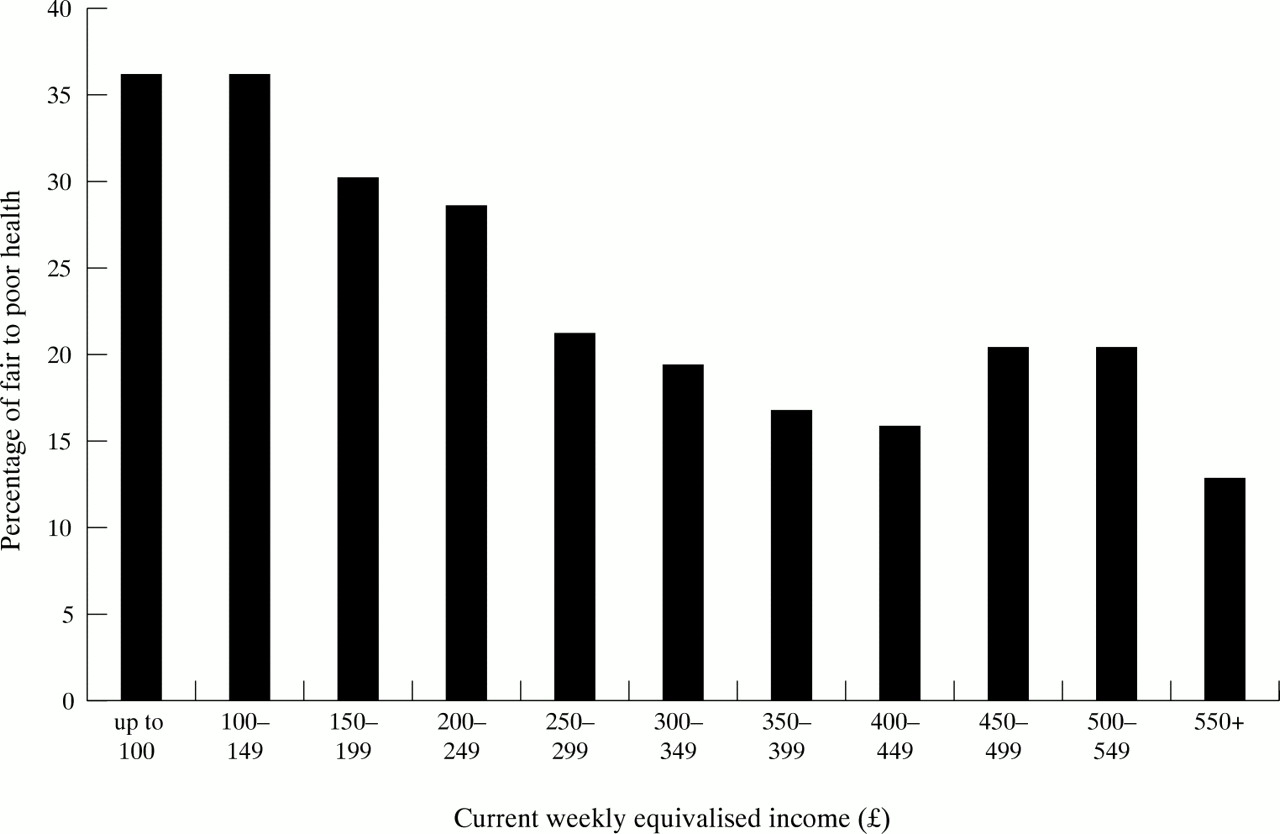
A statistically significant association was found between the prevalence of poor health and current net income, which departed from linearity to a statistically significant degree (LRT κ2=30.7, df=9, p=0.0003) (fig 1). When net income was used as a continuous term, an additional quadratic term provided a significantly better description of the data than a linear term alone (LRT κ2=14.64, df=1, p<0.0001). There was no evidence of a statistically significant association between the prevalence of either poor or very poor health and median regional income, whether treated as a continuous or a categorical measure.
Prevalence of poor self rated health by net current weekly equivalised income.
All income inequality indices were highly correlated with one another, at the p<0.0001 level of significance. Correlation coefficients varied slightly in size, however, and ranged from 0.89 for GE(0) and GE(2), to 0.98 for GE(0) and GE(-1). The association between income inequality and self rated health varied with the choice of inequality measure, as shown in table 2. A statistically significant independent association with the prevalence of poor health was found for (high) Gini score, but not for any of the other indices of income inequality (table 2). These findings did not vary substantially when adjustment for income was made using a continuous rather than a categorical term, or when the former was used along with a quadratic term.
Association between self rated health and regional income inequality, measured using five different indices. Unadjusted odds ratio (95% CI) for the prevalence of (a) poor health, and (b) very poor health, comparing those living in regions with the highest income inequality (category four) with those in regions with the lowest income inequality (category one), and adjusted for individual socioeconomic status*
The association between income inequality and poor health also varied with individual income level. For all five inequality indices, the association with self rated health was greatest among those with the lowest incomes, although none of the interactions between individual income and regional income inequality reached statistical significance (for example, LRT κ2 using Gini coefficient =5.3, df=6, p=0.50). Using the Gini index, the odds ratio for poor self rated health comparing people living in regions with the highest (category 4) and lowest (category 1) income inequality increased from 1.26 (95% CI 0.93 to 1.71) (p=0.13) among those with incomes in the top fifth for their region, to 1.55 (1.24 to 1.92) (p<0.001) for those with incomes in the bottom fifth, after adjusting for potential confounders (table 3).4
Association between regional income inequality and self rated health in those with low incomes. Unadjusted odds ratio (95% CI) for the prevalence of (a) poor self rated health, and (b) very poor self rated health, among people with incomes in the bottom fifth for their region of residence, comparing those living in regions with the highest income inequality (category four) with those in regions with the lowest income inequality (category one), and adjusted for individual socioeconomic status*
Though smaller than that for the Gini index, unadjusted associations between regional income inequality and poor health were statistically significant among those with the lowest incomes for all indices except GE(-1) (table 3). After adjusting for individual socioeconomic circumstances, these associations remained statistically significant only for the Gini index and GE(1). A similar pattern of results was found on repeating these analyses for very poor health. Associations between regional income inequality and very poor health were larger than those for poor health, and were again maximal using the Gini index. These associations, like those with poor health, varied with individual income. Unlike poor health, interactions between income inequality and individual income (by fifths within region) in their associations with very poor health reached statistical significance for three indices (Gini, GE(0) and GE(2)) (LRT κ2 for interaction between income and Gini category =11.8, df=5, p=0.04).
DISCUSSION
When the Gini index was used to calculate income inequality, people living in regions of Britain with the highest income inequality reported higher rates of poor and very poor health than those living in regions with the lowest income inequality. These associations were greatest among those with the lowest incomes, and remained statistically significant after adjusting for individual socioeconomic circumstances. While similar patterns of associations were found using four other indices of income inequality, few of these reached statistical significance, even among those with the lowest incomes. At best, these findings provide limited empirical support for our first hypothesis, which must therefore remain unproven. We found slightly more evidence against our second hypothesis, namely that the association between worse health and income inequality would not vary with individual income.
The present findings are consistent with those of Kennedy et al14 and Diez-Roux et al,18 who also found that the size of the association between income inequality and (worse) self rated health and cardiovascular risk factors (including obesity and hypertension), respectively, increased with lower individual income. Although the point estimates of associations between worse self rated health and income inequality reported by Kennedy et al 14 were smaller than those found in this study, they were more likely to have been statistically significant. This may reflect the much larger sample size, or the less precise measurement of household income in the study by Kennedy et al.14 Other methodological differences, such as use of telephone interviews (which exclude the least well off) in the study by Kennedy et al, may also account in part for the striking difference in the prevalence of self rated poor health. Although the same question was used to elicit this information as in the present study, a much higher prevalence was found among the BHPS sample (25%) than reported by Kennedy et al (14%).14
Among the most salient features of any study of this nature are the size of the area over which income data are aggregated, and the geographical and socioeconomic variation across these clusters.14,32 Many previous studies that have reported statistically significant associations between income inequality and different health outcomes have used data aggregated at the level of countries or US states. While lack of variation in income inequality between UK regions might be a problem, it might also be that these regions were too small to permit income inequality to exert an independent effect on health, after adjusting for individual income. Wilkinson 22 suggests that people in deprived neighbourhoods do not have bad health because of inequalities within neighbourhoods, but because these neighbourhoods are deprived in relation to the wider society. He argues that in moving from larger to smaller areas, median income becomes a more important predictor, and income inequality a weaker predictor, of mortality. The absence of an association between regional median income and the prevalence of common mental disorders may perhaps be viewed as further evidence against an area level effect on individual health.22 Our measures of inequality were derived at the regional level mainly for pragmatic reasons, in keeping with the structure and organisation of the BHPS dataset. The BHPS dataset contains insufficient observations per district to derive sufficiently reliable estimates of income inequality at levels below regions. A focus on regions is also potentially a limitation because of the somewhat artificial nature of the boundaries and because, arguably, people compare themselves with others within smaller areas.
Key points
-
People with lower incomes in regions of Britain with relatively unequal income distributions had worse self rated health than people living in regions where income was more equally distributed.
-
The association between income inequality and self rated health was not robust to the choice of income inequality measure.
-
The association between individual income and self rated poor health was non-linear, and followed a reverse J shape.
-
The places where people live may affect their health, independent of their individual characteristics, although the size of this effect is smaller than for individual income level.
-
Interventions to alleviate the effects of poverty on health are likely to be of greatest benefit if targeted at those on the lowest incomes.
The range of Gini coefficients in this study was quite a large spread for this index. It was at least as large as the change in the overall Gini coefficient for UK from the mid-1970s to the 1990s— a change that is considered by most to have been very large.3 The range of regional Gini scores in this study was also similar to that observed across US states in the study by Kennedy et al. 14
The choice of inequality measure
There were clear differences between findings using the Gini index, and those based on the other measures of income inequality. This finding contrasts with the conclusions of Kawachi and Kennedy,19 who found that the choice of income inequality measure had little effect on the size of the ecological association between income inequality and mortality. These divergent findings may be partly methodological in origin. Important differences include the ecological design of the study by Kawachi and Kennedy,19 their choice of mortality as an outcome, and their use of gross income data (from the US census) collapsed into 25 income intervals. Again, it is probably germane to note the larger geographical areas over which the effects of income inequality were studied by Kawachi and Kennedy.19 Interestingly, the findings of both studies differ from those of Daly et al,20 who found that the association between mortality and state level income inequality was greatest for indices that were most sensitive to differences in the share of total income going to those at the bottom of the income distribution. By contract, in this study the associations with worse health tended to be weakest for the most “bottom sensitive” index, GE(-1).
Methodological limitations
One limitation of this study was the reliance on a single question about participants' global assessment of their own health. Although this provides no information about specific types of morbidity, there is consistent, robust evidence from studies in diverse settings that this measure is predictive of both mortality and subsequent functional limitation, across the age span.15,33–36 It is possible that the association between self rated health and mortality is confounded by respondents' knowledge of their own socioeconomic status and health behaviours (particularly smoking and diet), their family history of illness and longevity, and the presence of any existing clinical or sub-clinical symptoms.33 However, three recent large, prospective studies have found that this association is independent of all of these.33–36 Although the associations with future mortality and functional impairment may be slightly weaker for women than men,35 there is no evidence to date that these vary with ethnicity.37
The present findings are based on cross sectional data, which precludes causal inference. Bias in the recall of income was possible but unlikely given the reliance on documentation wherever possible. Similarly, reverse causality seems unlikely to explain the study findings. Although those who report poor health may contribute to income inequality through economic inactivity or unemployment, this was unlikely to have explained the study findings. It should be noted that the measures of income inequality were based on the entire BHPS sample, and not just those who completed the GHQ. Furthermore, the characteristics of income distribution in this sample were validated against the 1991 DSS figures derived for the Family Expenditure Survey.25
It is likely that the effects of income inequality on health operate over many years, involving processes that cannot be captured by cross sectional investigation alone.38 Indeed, a recent study (using BHPS data) found that self rated health was more closely associated with average income over five years than with current income, or with income in the previous year.38 Although many previous studies have concluded that health selection (reverse causality) is unlikely to explain health inequalities,5 the possibility of selective migration of those predisposed to ill health by virtue of their socioeconomic circumstances has been less well studied. A recent study (also based on the BHPS) concluded that geographical variation in mortality rates at the district level was associated with differential migration by men.39 While this study was based on a small number of deaths, it found that those who migrated from high to low mortality districts had greater early life advantage than those “left behind” in high mortality areas. Thus, there may be common socioeconomic processes that affect both the income distribution of an area and the health of individuals who live there. It may be, for example, that cities become polarised in both health and income distribution because those with moderate incomes move away, leaving behind people who are unable to do so for financial reasons, and others who are sufficiently well off to live in highly affluent neighbourhoods.
It is notable, therefore, that the five regions that were classified as having the highest income inequality using the Gini index comprised the largest urban areas covered by the BHPS. It is notable also that (with the exception of Glasgow), the areas identified in the present study as having the highest income inequality in Britain are, broadly, those with the highest mortality.40 We cannot exclude the possibility that the increased prevalence of poor self rated health in these regions, especially among those with the lowest incomes, was attributable to characteristics of these cities other than income inequality. For example, other aspects of urban life, such as overcrowding, poor schools, traffic or high crime rates may contribute to worse health among those living in these regions. It is also possible, though unlikely, that those living in these urban areas (and especially those on the lowest incomes) are less stoical when assessing their health compared with their counterparts elsewhere.
Conclusions
Although there have been several studies of income and health,38 we are not aware of any previous studies that have examined the effects of income inequality within Britain. Our findings provide limited evidence of an independent association between regional income inequality and worse self rated health that is not explained by individual socioeconomic circumstances. In contrast with our hypothesis, associations between regional income inequality and worse health seemed greatest among those with the lowest incomes. While this indicates a “double jeopardy” for those with the lowest incomes, our findings also show that the greatest proportion of the association with poor health is accounted for by individual income level. Further research is now needed to determine whether the effects of income inequality are wholly attributable to regional composition (that is, the aggregated characteristics of the people who live in particular places), or whether there is also an independent contextual effect.2,41,42 Moreover, as regions with the highest income inequality coefficients were also the most urban, confounding by other contextual factors cannot be excluded. Chief among these are noise, traffic, poor schools, crime, lack of access to open space, and impaired social relationships of the type often subsumed under the rubric of “social capital”.43,44 We conclude, therefore, that in the first instance interventions to reduce socioeconomic inequalities in health are needed most urgently to alleviate poverty among individuals.
Our results emphasise how dependent the evidence base is in this field on the choice of methodology. Sensitivity analyses indicated that our findings varied substantially when different income inequality measures were used. These findings emphasise the difficulty of studying the effects of subtle differences in income distribution using summary measures. Although income inequality is undoubtedly an important heuristic, it may be as misleading to reduce the complexity of an income distribution to a single number as it is to conceptualise “social capital” as a universal `good'.21
Acknowledgments
The data used in this manuscript were made available through the Economic and Social Research Council (ESRC) Data Archive, based at the University of Essex. The data were collected by the ESRC Research Centre on Micro-Social Change at the University of Essex. Neither the original collectors of the data nor the Archive bear any responsibility for the analyses or interpretations presented here. The Institute for Social and Economic Research receives core funding from the ESRC and the University of Essex.
REFERENCES
Linked Articles
- In this issue