Article Text

Abstract
OBJECTIVE To establish the relation between socioeconomic status and the age-sex specific prevalence of type 1 and type 2 diabetes mellitus. The hypothesis was that prevalence of type 2 diabetes would be inversely related to socioeconomic status but there would be no association with the prevalence of type 1 diabetes and socioeconomic status.
SETTING Middlesbrough and East Cleveland, United Kingdom, district population 287 157.
PATIENTS 4313 persons with diabetes identified from primary care and hospital records.
RESULTS The overall age adjusted prevalence was 15.60 per 1000 population. There was a significant trend between the prevalence of type 2 diabetes and quintile of deprivation score in men and women (χ2 for linear trend, p<0.001). In men the prevalence in the least deprived quintile was 13.4 per 1000 (95% confidence intervals (95% CI) 11.44, 15.36) compared with 17.22 per 1000 (95% CI 15.51, 18.92) in the most deprived. For women the prevalence was 10.84 per 1000 (95% CI 9.00, 12.69) compared with 15.48 per 1000 (95% CI 13.84, 17.11) in the most deprived. The increased prevalence of diabetes in the most deprived areas was accounted for by increased prevalence of type 2 diabetes in the age band 40–69 years. There was no association between the prevalence of type 1 diabetes and socioeconomic status.
CONCLUSION These data confirm an inverse association between socioeconomic status and the prevalence of type 2 diabetes in the middle years of life. This finding suggests that exposure to factors that are implicated in the causation of diabetes is more common in deprived areas.
- socioeconomic status
- prevalence
- type 2 diabetes mellitus
- type 1 diabetes mellitus
Statistics from Altmetric.com
The association of many vascular diseases and their risk factors with socioeconomic status has been well described.1-4 Certain risk factors implicated in the development of diabetes are also known to be associated with socioeconomic status. Obesity, physical inactivity, smoking, and low birth weight have all been described as risk factors for type 2 diabetes. In Western societies these factors are associated with low socioeconomic status.5 Thus an inverse relation would be expected between the prevalence of type 2 diabetes and socioeconomic status. However, few published studies have investigated this relation. The Whitehall study1 described a significant inverse relation between glucose intolerance and grade of employment. A study of nine English towns, an ecological study, described an inverse relation between the incidence of type 2 diabetes and relative affluence of the towns.6 However, a study from Bangladesh describes an increased prevalence of type 2 diabetes in an affluent population when corrected for other major diabetes risk factors.7 Studies investigating the relation between the incidence of type 1 diabetes and socioeconomic status have generally found little evidence of a relation.
In this paper we present population based data, from a north of England health district, of the relation between known diabetes and socioeconomic status. We tested the hypothesis that the prevalence of known type 2 diabetes but not type 1 diabetes was inversely associated with socioeconomic status.
Methods
REGISTER
A community based diabetes register for the calendar year of 1994 recorded all known cases of diabetes in the South Tees Health Authority (population 285 157). The ethnic population within the district is small, 2.5% non-Europid of which 68% are South Asian (people whose ancestral origins are from the Indian subcontinent). Ethnicity was derived from patients names.8
AREA
South Tees is a geographically well defined area comprising the industrial town of Middlesbrough with natural boundaries; the North Sea to the east, the North York moors to the south and the river Tees to the north and west. There is relatively little cross boundary transfer of patients. Patients attending the hospital clinic or primary care facilities from outwith the district of South Tees were excluded from the study.
DATA COLLECTION
A research sister who visited 49 general practices collected patient information in the community. The diagnosis of diabetes was based on WHO criteria for hospital based patients and on the finding of a random blood glucose > 11 mmol/l for those in primary care. Data were also collected from the hospital diabetes register compiled by the physicians using the same data collection form at each visit. Lists of patients in general practice with diabetes were generated by computerised searches of diagnostic lists and of prescriptions for diabetic medication or monitoring equipment. The individual case records were then analysed by the research sister to confirm or refute the diagnosis of diabetes and record the patient characteristics. Within the hospital a computerised register has been held since 1987. The register includes patient details and is updated at each patient visit. The files were merged and analysed by hospital number, name and date of birth to avoid double counting. Data abstracted for each patient included current, sex, age at diagnosis, current diabetes treatment, address, and six figure postcode. Field limits were set to prevent entry of erroneous data. An audit clerk at the Diabetes Care Centre, Middlesbrough General Hospital, entered the data.
CASE DEFINITIONS AND SOCIOECONOMIC STATUS
The definition used for type 1 diabetes was age at diagnosis less than 31 and currently being treated with insulin. All other patients were classified as type 2 diabetes.
Socioeconomic status was based on ward of residence—an administrative unit of around 12 000 residents. A deprivation score was calculated for each ward using variables derived from the 1991 census. The variables used in the score within each ward were the proportion of: male unemployment, manual workers, one parent households, self reported chronic health and disability, pensioners living alone, no car households, overcrowded households (> 1 person per room), living in local authority rented accommodation and living in privately rented property. Variables were Z transformed to give each an equal weighting in the score.
The ward deprivation scores ranged from −9 to +13 (least deprived to most deprived). The population was divided into fifths on the basis of the deprivation score. The denominator population for each fifth was based on 1991 census data and diabetes prevalence rates were calculated by 10 year age and sex bands. All data are age adjusted to the 1991 England and Wales population.
Results
key points
-
The prevalence of type 2 diabetes is increased in areas of low socioeconomic status.
-
Increased prevalence of type 2 diabetes in deprived areas is most pronounced in the 40–69 year age band.
-
Several risk factors for the development of type 2 diabetes are more prevalent in deprived areas and may account for our observations.
-
Type 2 diabetes is more prevalent in men than women.
-
The prevalence of type 1 diabetes was not associated with high or low socioeconomic status.
There were 4313 persons with diabetes identified. The crude prevalence of diabetes was 15.0 per 1000 population (95% confidence intervals (95%CI) 14.5, 15.4) age adjusted 15.6 per 1000 population (95%CI 15.2, 16.1); there was a significantly higher prevalence in men 17.5 per 1000 population (16.8, 18.2) compared with women 13.9 per 1000 population (95%CI 13.2, 14.5). The age adjusted prevalence rates for all known diabetes and rates for type 1 and type 2 diabetes for men and women from each of the socioeconomic groups are described in table 1. The prevalence of insulin treated diabetes (all type 1 diabetes and type 2 diabetes treated with insulin) was 3.8 per 1000 population, which is similar to previous studies, although the proportion was lower because of the increased numbers of non-insulin treated patients detected. Ethnic minority patients attending hospital constituted 5.4% of the total with diabetes, the distribution within the community was not associated with socioeconomic status. Within the five deprivation categories, the percentage of non-Europids from most affluent to most deprived respectively was 4.17%, 5.01%, 6.40%, 5.83%, 6.01%. There was no linear relation between prevalence of non-Europids with diabetes in the population and socioeconomic status.
Prevalence of diabetes per 1000 population for all known cases of diabetes, type 1 and type 2 diabetes with 95% confidence intervals; highlighting the difference in diabetes prevalence for type 2 diabetes (Dep 1 = most affluent, Dep 5 = most deprived)
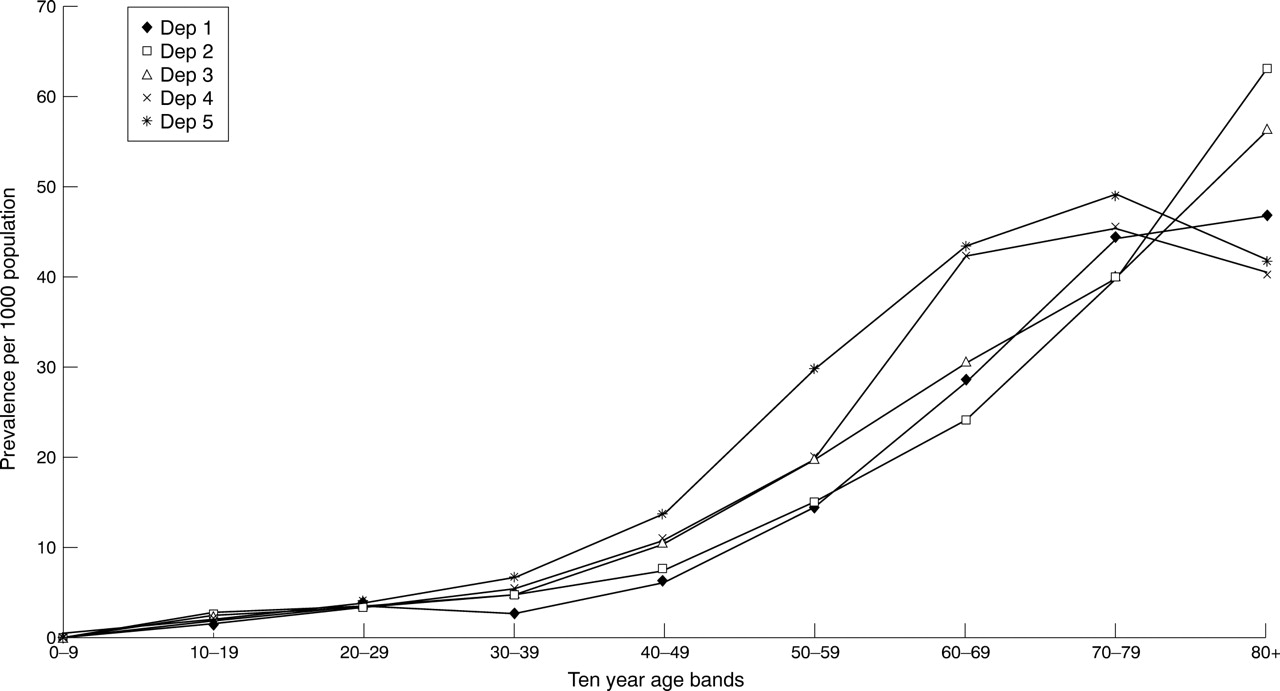
There was a significant trend between the prevalence of type 2 diabetes and categories of deprivation score in both men and women (χ2 for linear trend, p<0.001). In men the prevalence of type 2 diabetes in the least deprived quintile was 13.4 per 1000 population (95% CI 11.5, 15.4) compared with 17.2 per 1000 population (95%CI 15.5, 18.9) in the most deprived; in women the prevalence in the least deprived was 10.8 per 1000 population (95%CI 9.0, 12.7) compared with 15.5 per 1000 population (95%CI 13.8, 17.1) in the most deprived (fig 1). Analysis within 10 year age bands indicated that the steepest gradient of diabetes prevalence across the deprivation quintiles occurred in those aged from 40–69 years (table 2). The 40–69 year age band accounted for most of the difference in diabetes prevalence between the deprivation fifths (table 3). This gradient was present for both men and women in the age band 40–69 years (figs 2 and3). There was no significant trend in the prevalence of type 1 diabetes by quintile of deprivation score (see table 1).

Age adjusted prevalence of known diabetes by fifths of deprivation score.
Prevalence of diabetes per 1000 population within deprivation fifths by 10 year age bands showing the steepest gradient for those aged 40–69 years (1 = most affluent, 5 = most deprived)
Summary of diabetes prevalence (per 1000) population for young, middle aged and elderly persons within deprivation groups (1 = most affluent, 5 = most deprived)
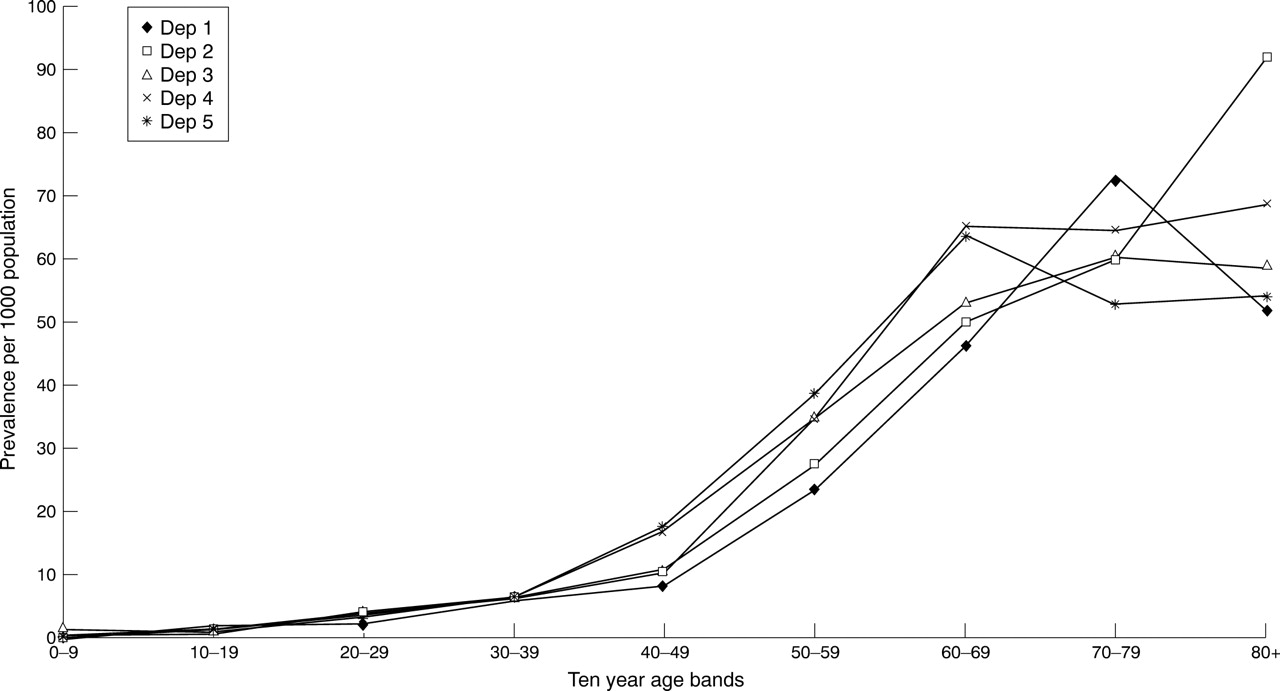
Male diabetes prevalence by age and deprivation group.
Female diabetes prevalence by age and deprivation group.
Discussion
The aim of this study was to test the hypothesis that the prevalence of type 2 diabetes is inversely associated with socioeconomic status. We have found this to be the case. Before considering possible explanations we need to consider whether this finding could be because of bias in ascertainment. If the ascertainment of type 2 diabetes was higher in the more deprived areas relative to the more affluent areas, this could produce the relation. It has been suggested that people in deprived areas make more use, on average, of primary care services than people in more affluent areas but this has not been supported in the recent health survey for England.5 However, it is known that people from social classes IV and V—low social class—are less likely to attend for routine health checks,9 10 at which urine or blood glucose are measured, this would potentially underestimate the strength of the association between type 2 diabetes and socioeconomic status. Recent data from the UK report excess mortality for those who are unemployed or living in council housing.11 These data would suggest an under-ascertainment of people with diabetes in the most deprived areas and explain the lack of a relation in the elderly diabetic population. Therefore these factors would suggest that a bias in ascertainment is unlikely to explain the relation between diabetes prevalence and socioeconomic status, but may if anything tend to underestimate the association.
Another possible source of bias is in the ascertainment of denominator populations. It is known, for example, that the 1991 census for the UK underestimated the size of populations living in inner city areas.12 However, under-ascertainment was mainly in young men, thus there would be little effect in the age bands 40–69 years where the association between diabetes and socioeconomic status is strongest. The steeper gradient for women compared with men argues against this potential source of bias. Thus, although we cannot fully discount ascertainment bias, it seems unlikely to account for our findings.
The higher prevalence of diabetes in the deprived areas could be attributable to a variety of factors. Obesity and physical inactivity are strong risk factors for type 2 diabetes and glucose intolerance.13 The health survey for England has demonstrated strong social class gradients with obesity and physical inactivity, particularly in women, with higher levels of physical inactivity in manual compared with non-manual social classes.14 Thus it is a reasonable hypothesis that these factors may partly or substantially account for our findings. In a population based cross sectional study in Newcastle upon Tyne the prevalence of glucose intolerance (impaired glucose tolerance and diabetes, based on oral glucose tolerance tests) also increased with lower social class. However, in women these differences were not fully accounted for by differences in obesity and physical activity suggesting that other factors may also be important.15Those less consistently identified as markers for diabetes, include smoking16 and dietary constituents, such as amount of fat17 and antioxidant vitamins.18
The relation between low birth weight and subsequent development of diabetes may also be important in relation to our findings.19 Low birth weight and adult obesity are both associated with poverty in the UK. It remains to be proved whether this association is identifying people who will lead a life at low socioeconomic levels resulting in poor nutrition or whether this risk of diabetes is programmed in the fetus. It is clear that a change in socioeconomic circumstances from low to high is associated with a reduction in cardiovascular risk, but in the case of diabetes this is not established.
The strong association between low socioeconomic status and diabetes prevalence in the middle years identifies a population group already at high risk of premature cardiac death. The prevalence of diabetes by age and sex is higher in older age groups than previously reported in UK studies. The increased prevalence of diabetes in men is unexplained but it is consistent with other studies.20 The most striking difference in diabetes prevalence is within the 40–49 year age bands for both men and women where there is a near doubling of diabetes prevalence in the most deprived quintile compared with the most affluent. Over the age of 70 years the association between socioeconomic status and diabetes prevalence became weaker. This could be the result of a survival effect with people with diabetes in lower socioeconomic groups dying prematurely as has recently been reported.21 In the USA, low income was associated with a higher prevalence of diabetes.22 In Israel the incidence of diabetes was inversely related to educational attainment,23 a proxy for socioeconomic status.
The prevalence of type 1 diabetes was similar across the deprivation quintiles and is in contrast with a previous study that suggested an increased prevalence in middle class children.24Environmental factors are important for the development of type 1 diabetes, therefore exposure to any putative environmental agent would seem to be equivalent across the socioeconomic gradient.
In conclusion, this study has described a significant inverse relation between the prevalence of type 2 diabetes and socioeconomic status, which is most marked between the ages of 40–69 years. The explanation for this effect is not clear but probably relates to earlier and increased exposure to lifestyle and environmental risk factors for type 2 diabetes among people from areas of low socioeconomic status.
Acknowledgments
We thank Elaine Sayer, Cleveland County Council, Research and Intelligence Unit for help in measuring socioeconomic status and Rehman Ditta, University of Teesside for managing the computer database.
References
Footnotes
-
Conflicts of interest: none.