Article Text

Abstract
Background: Most previous studies have examined the association between mortality and deprivation at only one point in time. However, risk accumulates over the life course. The design of the study was ecological. Its aims were to explain inequalities in total and cause-specific mortality between geographical areas in relation to the lifestyle and health behaviours of the resident populations and the area levels of deprivation in 1981 and in 1921–40.
Methods: Data on health behaviour from the 1985 Heartbeat Wales Community Survey were evaluated in light of Welsh mortality rates for the period 1981–99, 1981 census data on socioeconomic position and the infant mortality rates in 1921–40. Negative binomial models were carried out to investigate the district-level association of mortality with deprivation (infant mortality in 1921–40, Carstairs score in 1981, combined index of deprivation) independently from the personal habits and characteristics of the resident population.
Results: There was an increased risk of death in deprived areas compared with more wealthy ones. Both infant mortality (a proxy of material deprivation during the time in which the 50–59-year-old individuals were born or were children) and Carstairs scores (a proxy of deprivation during adulthood) were strongly associated with recent mortality. Deprivation had stronger effects in women than in men, the only exception being the effects of later life deprivation on lung cancer.
Conclusions: Area characteristics at different points of time may help to explain geographical inequality in mortality.
Statistics from Altmetric.com
Evidence of an association between mortality and area deprivation was reviewed by Townsend in 1988,1 Curtis and Jones in 1998,2 Picket and Pearl in 20013 and Riva et al in 2007.4 However, part of the association was explained by differences in the social and demographic characteristics of the resident population. Studies included in these reviews have examined the association with area-based measures of deprivation at only one point in time, most frequently the one at which mortality data were available. This may not necessarily coincide with the place in which the subject spent most of his/her life. Furthermore, it has been hypothesised that risk accumulates during the life course5–10 and that exposure to risk factors may occur many years before the development of the outcome.10–13
Few studies have investigated the association between mortality and deprivation at more than one point in time. Curtis et al14 investigated whether the association between all-cause mortality and area type and area deprivation in 1981 (Carstairs score, region of residence) varied according to attributes of area of residence in 1939 (population density in 1931, per cent of classes IV and V, depressed areas in 1934, unemployment in 1931), controlling for individual characteristics of the population resident in each area in 1981 (age, gender, unemployment, home not owner occupied, not married and social classes IV and V). They found that, of the men living in the poorest districts of Wales in 1981, those who had lived in deprived areas in 1939 were at higher risk of death than those who had not. They also found that, after controlling for individual characteristics and area circumstances in 1981, men and women living in areas with high levels of unemployment at ages 0–16 were more likely to die from all causes of death than those living in areas with lower unemployment at the same age. Similar results were obtained by Naess et al, who conducted a retrospective cohort study in Oslo among 128 723 men and women aged 31–50 years in 1990, evaluating the association between the 1960 socioeconomic position (housing standards) and that of 1990 (income) and the total and cause-specific mortality in 1990–415 and in 1990–8.16 17
These studies have also shown that the association between mortality and childhood or adulthood deprivation varies according to the specific cause of death. Similarly, an ecological study that related the Booth Descriptive Map of London Poverty with census data on social class and with standardised mortality ratios for all ages in 1991–5 found that the 1896 poverty index was more strongly associated with deaths from stroke and stomach cancer than the corresponding 1991 index. The reverse was seen for lung cancer and coronary heart disease and for total mortality under the age of 65.18 Furthermore, ecological studies of the association between adult mortality together with area deprivation measured at the time of birth and death suggested that childhood environment is associated with increased risk of death from chronic bronchitis,7 stroke18–20 and stomach cancer18 19 in the adult population, independently of deprivation of the place of death. Further evidence derives from a migration study which showed that 40–59-year-old men born in the south of Great Britain (low mortality from ischaemic heart disease) who moved to other areas in Great Britain (medium–high ischaemic heart disease mortality) had a similar incidence and mortality from ischaemic heart disease, yet they had a lower risk of dying from cardiovascular disease during the 21.8 year follow-up, compared with men of a similar age and social class who were not born in the south of Great Britain and did not migrate.21
The magnitude of the effects of deprivation on health may differ for different subgroups of the population (between-individual variation). For example, very little work has been done on the effect of area deprivation by gender. Studies of mortality and deprivation that did not adjust for individual characteristics of the population have found stronger effects of deprivation in men,22 23 whereas those that adjusted for individual characteristics have found stronger effects in women.11
This article reports on an ecological study which investigates whether information on area characteristics in different periods of time could help to explain geographical differences in mortality. The main objective is to explain inequalities in total and cause-specific mortality between geographical areas in relation to the lifestyle and health behaviours of these resident populations and the area levels of deprivation in 1981 and in 1921–40. The article has a rather innovative look at how neighbourhood deprivation during the life course has an impact on health in later life because it combines several datasets over long time periods including datasets from survey data.
METHODS
We examined the effect on total and cause-specific mortality of deprivation in 1921–40 and in 1981 in Wales. The Carstairs index was used to measure material deprivation at the area level in 1981, and infant mortality was used as a proxy of material deprivation for the period 1921–40. We combined data from the 1985 Heartbeat Wales Community Survey, the 1981 and 1991 national censuses, the Office for National Statistics (ONS), the Registrar General’s Annual Reports for the years 1921–40 and the Vital Statistics of Deaths Registry for the years 1981–99. The 1981 Local Authority districts were used as the units of analysis. Data were merged by birth band and districts.
Data sources
The 1985 Heartbeat Wales Community Survey was part of the Welsh Heart Programme, whose objectives were to collect data on health behaviour, risk factors and current knowledge on health; to promote the uptake of healthy behaviour in the Welsh population; and to monitor changes in cardiovascular risk factors and health behaviours in the Welsh population during the period 1985–90.24 A stratified multistage clustered sample study design was used to ensure that the number of subjects was sufficient for computing a health risk factors profile, regardless of the population size in each health authority. This yielded a total of 20 098 households. The response rate was 59%.
Current smokers were defined as those who smoked every day or occasionally. Ex-smokers were those who reported having smoked in the past but who had stopped smoking at least 1 year earlier. Units of alcohol per week were computed as the sum of the consumption of beer, cider, wine, sherry and spirits in a typical week. The intake was self-assessed by the subject using a formula to convert pints, shorts and glasses into units. Education was expressed as the highest schooling qualification and coded into the following categories: 1, university degree; 2, other technical qualification or diploma obtained after leaving secondary school; and 3, secondary or earlier education. The employment status of the head of the household was defined according to the Registrar General Social Class (RGSC) classification. In accordance with this classification, the head of the household was classified as either economically active (currently in a full- or part-time occupation, unemployed but actively seeking work, temporarily sick, waiting to take up a job already offered) or inactive (permanently sick/disabled, housewives, full-time students, persons not in paid occupations). Married (or equivalent) partners in paid jobs were always classified according to the occupation of the head of the household. Country of birth was categorised as Wales, the UK or elsewhere.
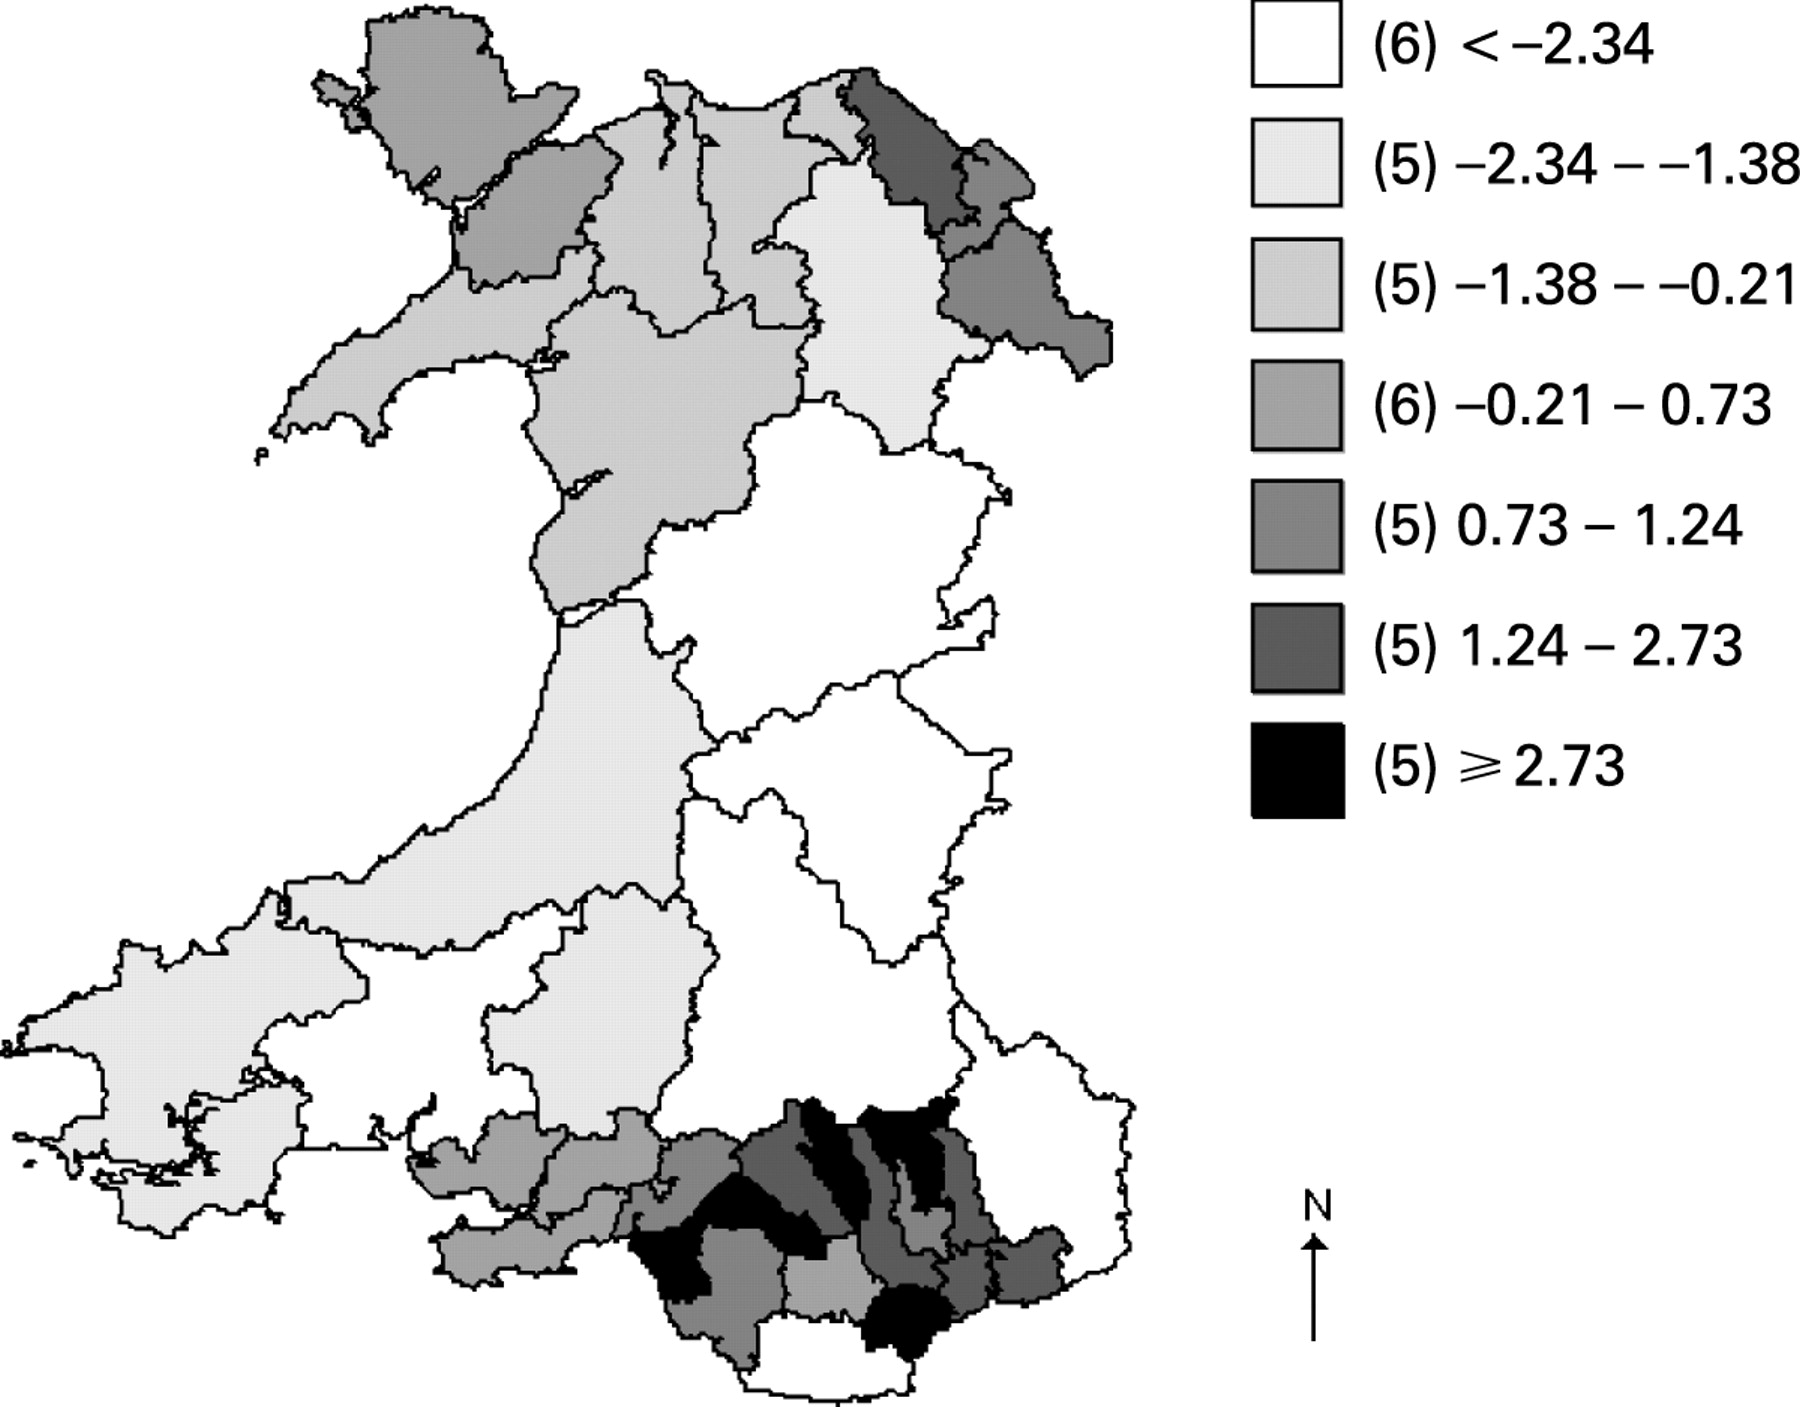
The 1981 Census Small Area and Local Base Statistics (SAS/LBS) were used to compute the Carstairs composite index.25 This was obtained as suggested in the literature by summing the unweighted z-scores for the following variables: unemployment (unemployed male residents over 16 years of age as a proportion of all economically active male residents over 16), overcrowding (persons in households with one or more persons per room as a proportion of all residents in households), non-car ownership (residents in households with no car as a proportion of all residents in households), low social class (residents in households with an economically active head of the household in social class IV or V as a proportion of all residents in households). The Carstairs scores were computed at the ward level, and the median estimates were used to represent deprivation at the district level (fig 1). Carstairs score (range −5.03 to 7.29) was divided into seven categories (cut points defined according to distribution).
Infant mortality data for the years 1921–40 were collected from the Registrar General’s Annual Reports. These have been used as an index of poverty and health26 and have been associated with household income, overcrowding, climate, hygiene and health providers’ performance.27–30 Carstairs scores were positively associated with infant 1921–40 mortality (Spearman ρ 0.64, p<0.001). A combined index of deprivation was obtained as the sum of infant mortality and Carstairs score, to investigate the cumulative effect of material deprivation.
The vital statistics dataset of the Office of Population Censuses and Surveys (OPCS) for the period 1981–99 was available in the form of anonymous records. The data were national mortality data and refer to all deaths within the 50–59 age range among people living in each of the 37 districts in Wales. The data for the age and gender composition of the Welsh population were retrieved from the 1981 and the 1991 censuses. For the period between censuses, the mid-year population estimates of the Office for National Statistics (ONS) Local Authority Districts were used.31 Causes of death for 50–59-year-olds who died in Wales between 1980 and 1999 were classified according to ICD-IX. Deaths for cardiovascular diseases, ischaemic heart diseases, stroke, lung cancer and for smoking-related diseases, which represent the main causes of death for this population, were investigated. Both the 1985 survey and the mortality datasets were provided in anonymous form and it was therefore not possible to investigate the vital status of individuals participating in the 1985 survey.
Unit of analysis
The 1981 Local Authority districts were used as a unit of analysis. The 1981 districts represent large areas, which might be potentially heterogeneous in terms of resident population and social and physical characteristics but with the advantage of having a similar population size.
Wales’s statutory geography has changed over time. A geographic code book (look up table)32 was produced to relate the 1921–71 data to the 1981 geography on the basis of descriptive information on boundary changes. Information on border changes was obtained from Local Government Acts for the years 1921–81, technical documents of the Boundary Commission for Wales and Counties Review Orders. Health authorities were contacted to gain additional information when needed. Then a detailed list of boundary changes was compiled and the proportion of the 1921–40 population to be allocated to each district, according to the 1981 area classification, was estimated.
Data management
Mean, median and percentiles of selected variables from the 1985 Heartbeat Wales Community Survey were computed by strata of social class, gender and district, after having weighted the data by the inverse of the district population. District datasets were derived from the original datasets for adult mortality, deprivation, historical infant mortality and the community survey by computing, for each record, the period of birth based on the information contained in the variables age and time (either at the time of the community survey or at death). Data were then merged by birth band and district to produce a single file for the ecological analyses.
Statistical analyses
Poisson models were carried out to investigate the association between mortality and deprivation. The dependent variable was the number of deaths; the population was included in the model as an offset term. Exposure variables (Carstairs score, infant mortality and the cumulative score) were included in the model as independent variables. Potential confounders (age, population density, smoking habit (current smoking and ex-smoking), alcohol intake, manual class, low educational levels and deprivation (Carstairs score in the analyses of the association between adult mortality and infant mortality and infant mortality in the analyses of the association between adult mortality and Carstairs score)) were included in the model as additional independent variables. Tests for linear trend across strata of relevant independent variables were carried out by treating the ordinal score as a continuous variable. The interaction of gender with exposure variables was investigated. Stratified analyses for urban (areas with a population density—inhabitants per squared kilometre—above the median) and rural area (population density below the median) were carried out. Standardised residuals were plotted against predictors to evaluate the model. Residuals were plotted against the predicted values and against variables that we considered to be relevant, whether they were included in the model or not. Goodness of fit of the model was estimated by the deviance (likelihood ratio) test statistic. Cook’s D statistics, the hat matrix and the standardised residuals were used to detect outliers and influential points. Variance of the residuals was investigated in relation to the number of degrees of freedom, given that large estimates could indicate overdispersion, which could show variation of the true underlying risks across areas, inaccuracies in the numerator or denominator, model misspecification or residual confounding. A negative binomial model with robust standard errors was used in the presence of overdispersion.
RESULTS
All-cause mortality
Districts that were deprived in 1921–40 or in 1981 had higher mortality rates than those that were affluent in the same period (table 1). This association remained after having adjusted for district-level indicators, that is, age, smoking habit (current smoking and ex-smoking), median alcohol intake and the proportion of men and women in the manual class or with lower educational levels. When also adjusting for population density, the association between mortality and deprivation was slightly stronger for the Carstairs score in 1981 (which identifies area characteristics when the study population was 50–59 years old) than for infant mortality in 1921–40 (used as a proxy of area characteristics when the study population was born or were children), although the confidence intervals were wide and overlapping.
The proportion born outside Wales did not affect the association between infant mortality and total mortality or between the Carstairs score and total mortality (results not shown). However, the effects of deprivation on total mortality were of a slightly higher magnitude in areas with a lower prevalence of people born elsewhere, compared with areas with a higher prevalence. Taking population density into account lessened the effect of past and current deprivation on total mortality (results not shown). As also seen for the proportion born outside Wales, the association between mortality and the Carstairs score and that between mortality and the infant mortality score were slightly stronger for both men and women in densely populated areas, compared with sparsely populated areas (results not shown).
Cardiovascular disease mortality
Men and women living in deprived areas were at higher risk of death from ischaemic heart disease than their counterparts of similar age and gender living in affluent areas (table 2). The risk of death from ischaemic heart disease was slightly higher for men and women living in areas that were deprived both in 1921–40 and in 1981 than in those deprived only in 1921–40 or in 1981, although the confidence intervals were wide and overlapping. Having adjusted for mean age, the per cent of manual class and of lower educational level, district-level indicators of health behaviour and population density, the combined score relative risks (RRs) were 1.13 (95% confidence interval (CI) 1.08 to 1.17) in men and 1.31 (95% CI 1.19 to 1.44) in women. In men, the effects of the Carstairs score and the infant mortality score were similar, whereas in women the effect of the Carstairs score was slightly stronger. In a multivariate model, adjusted for mean age, the per cent of manual class and of lower educational level, district-level indicators of health behaviour, population density and Carstairs score, infant mortality was not independently associated with cardiovascular disease mortality (RR 1.08; 95% CI 0.96 to 1.21). Overall, the infant mortality score and combined score had slightly stronger effects in women than in men.
There was no evidence of an association between area deprivation and mortality from stroke in men. Women living in deprived areas were at higher risk of death from stroke than their counterparts of similar age and gender living in affluent areas. Taking population density into account increased the RR of past and current deprivation (table 3). Additional adjustment for the district-level proportion of manual class and of lower educational level and for district-level indicators of health behaviour had little effect on the RRs and CIs. The effect of the infant mortality score was stronger than that of the Carstairs score. The risk of death was slightly higher for women living in areas that were deprived in both 1921–40 and 1981, compared with those deprived in only one of these periods, although the confidence intervals were wide and overlapping.
Mortality from lung cancer
Districts that were deprived in 1921–40 or in 1981 had higher lung cancer mortality rates than those that were affluent during the same period (table 4). Having adjusted for age, population density and health behaviour, mortality from lung cancer was not associated with deprivation in women. In men, the risk of death from lung cancer increased by 25% per unit increase in the Carstairs score. Having adjusted for socioeconomic position, health behaviour, age, year of death and population density, the RR decreased to 1.13 (95% CI 1.03 to 1.23) in men. There was no evidence of an association between the infant mortality score or the combined score and mortality from lung cancer after having taken into account population density, age and health behaviour.
DISCUSSION
In this study, we found an increased risk of death in deprived areas compared with affluent ones. The increased risk seems to be of a slightly higher magnitude for stroke-related mortality in areas which were deprived in 1921–40 than in those deprived in 1981, although the confidence intervals were wide and overlapping. The reverse occurred for all-cause mortality in men and women and for ischaemic heart disease in women.
Material or infrastructural resources such as features of the physical environment, of the home and work environments and of public services and “collective social functioning resources”33 may influence health throughout the life course. In both childhood and adulthood, area-level deprivation may lead to inadequate diet and physical activity, poor education, lower chances of finding a remunerative job, higher risk of unemployment, lower income and lower opportunity to move to a less deprived area. This is reflected in the strong association of both infant mortality (a proxy of material deprivation during the time in which the 50–59-year-old individuals were born or were children) and Carstairs scores (a proxy of deprivation during adulthood) with recent mortality.
Another factor which might explain the strong association of both infant mortality and Carstairs score with recent mortality is that the geography of deprivation has changed relatively little over long time periods. A study that compared patterns of poverty in London between 1896 and 1991 showed that 46% of the wards did not change their poverty ratings between 1896 and 199118 owing to selective migration (ie, rich people move from deprived areas to less deprived areas and poor people move from affluent to deprived areas).34 As a result, areas remain populated by the same type of people and their relative position on the deprivation scale is maintained throughout time.35
Infant mortality in 1921–40 and Carstairs score in 1981 were strongly correlated. For this reason, a combined indicator of deprivation was computed. The combined indicator was slightly more strongly associated with mortality from ischaemic heart disease and stroke than the infant mortality and the Carstairs scores. Similar results were obtained for cardiovascular diseases in men in the Oslo Mortality Study16 and in women in the British Women’s Heart and Health Study.36
After the inclusion of age, height, manual class, low education, smoking habit and alcohol intake there was still evidence of an association between deprivation and total mortality and mortality from ischaemic heart disease in men and women and between deprivation (Carstairs score and infant mortality score) and mortality from stroke in women and between Carstairs score and lung cancer in men.
Although the confidence intervals were very wide and overlapping, deprivation (both in 1981 and in 1921–40) may have slightly stronger effects in women than in men for mortality from ischaemic heart disease and stroke. These results are consistent with those from other studies that showed how features of the resident environment were associated with women’s health while individual socioeconomic factors were more strongly related to men’s health.4 37 These findings may indicate that women are more susceptible than men to the effects of the environment, that exposure to various aspects of the environment varies in men and women, that women have a higher tendency than men to report negatively on the various aspects of their life or that estimates in women are more likely to be affected by underadjustment for individual level confounders than those in men (eg, if individual-level estimates of socioeconomic position are more accurate for men than for women). Other area characteristics such as features of the physical, home and work environments (infrastructural resources) and of the sociocultural environments (collective social functioning resources) may also influence health38 39 and their effects on mortality may be of different magnitude in men and women.
The effect of deprivation in 1921–40 and in 1981 was slightly higher in urban than in rural areas, with the exception of lung cancer, which had stronger effects of deprivation in rural areas. Urban areas also experienced higher rates and greater variability in the rates of total and cause-specific mortality than did rural areas. Studies that have investigated the extent of variability in total mortality and limiting long-term illness by type of setting have found that urban areas were more variable, although some degree of variability was also seen within rural areas, with remote rural areas tending to have a higher occurrence of limiting long-term illness and higher mortality than the more accessible countryside.23 40 41
Limitations
One of the main concerns with the analyses and interpretation of geographical patterns in health is the “modifiable area unit problem” (MAUP),42 which means that results may vary for different levels of aggregation and thus for different units of analysis. Studies that have used a hierarchical approach with individual-level data nested within small areas and small areas nested within larger regions found evidence of an association between mortality and deprivation at more levels.43 The effects were of a somewhat stronger magnitude for wards than for regions in analyses of smoking habit and alcohol intake carried out on the Health and Lifestyle Survey dataset, whereas in analyses of death and deprivation carried out on the same dataset, the effects were smaller for wards or constituencies than for regions.44 The present analysis explored differences at the district level but not at other levels of aggregation. Therefore, the results cannot be generalised to other levels. Neither is it possible to appreciate whether large variability between areas exists for other geographies or settings.
The response rate to the 1985 survey was 59%. Results from the non-response survey conducted in 1986 showed evidence of selection bias, given that non-respondents were more likely to be single, manual workers and less educated than participants. The non-respondents also differed from study participants with regard to smoking, drinking habits and salt consumption.45 The employment status of the head of the household was defined according to the RGSC classification, an official classification of social class.46 Given that the “conventional” approach of assigning the social class to every member of the household was adopted, partner’s occupation was not taken into account,47 which can be considered as a rather archaic approach. Data on smoking, alcohol intake, height and weight were self-reported. Previous analysis of the clinical survey showed that height tended to be overestimated and weight underestimated. Bias was of a higher magnitude in obese women than in overweight women or in men. Personal habits and characteristics were measured in 1985, and may not predict mortality between 1981 and 1999. This may explain the limited effect of these variables as confounders. In addition, we used only district-level variables (mean, median, prevalences) in the multivariate analyses as proxy of the characteristics of the individuals living in the 37 districts. Thus, residual confounding from personal habits and characteristics may still exist.
Records from the Welsh Heart Health Survey and vital statistics were allocated to unit of analysis according to, respectively, residence at the time of the survey and place of death. These may not coincide with the individual’s main residence or with the location in which exposure had taken place. Along the same lines, information on where the individuals in the survey were living in 1921–40 was lacking.
The Carstairs index was used to measure material deprivation in geographical areas in 1981 whereas infant mortality for the period 1921–40 was used as a proxy of material deprivation during the time in which the 50–59-year-old individuals were born or were children. However, we have no information on where the individuals in the survey were living in 1921–40, which means that infant mortality may not describe conditions in childhood place of residence for those who have died. Another issue is that other area characteristics such as features of the physical, home and work environments and of the sociocultural environments may also influence health,38 39 but these have not been investigated in our work. In addition, Carstairs score may not index rural disadvantage, which therefore may remain hidden.
Using a conversion table to obtain constant boundaries may cause bias in some of the data (eg, historical data on infant mortality), owing to the misallocation of areas from pre-1972 districts, which were split into 1981 districts.
Geographical inequalities in health can in part be attributed to migration.48 49 Brimblecombe et al49 observed that the same factors that influence the dynamics of migration, such as age, ethnicity, housing tenure and socioeconomic position, also influence mortality rates. Wales underwent some migration processes in the period under investigation. Major population changes occurred during the expansion of the coal mining market between the end of the 19th century and the first decade of the 20th century and during the economic decline between 1920 and 1939. Areas most affected by the migration processes were the county of Glamorgan (the population was 70 879 at the first census in 1881, reached 795 231 in 1921 and then declined to 766 141 in 1931) and the counties of Brecknock and Monmouth. The Welsh countryside was also a reception area for children evacuated from London and industrial cities in the north of England at the beginning of the Second World War. Migration processes could have biased results if exposure had taken place in areas which did not correspond with the area of residence or the area of death of the population under investigation and if the migrants and the non-migrant population differed in exposure prevalence and disease rate.
Although a multilevel model would have been a more powerful test of area effects because it allows the assessment of different sources of variability, takes the clustering of individuals within higher level units into account and increases the accuracy of the estimated parameters,50 we were not able to carry out such a model because both the 1985 survey and the mortality datasets were provided to us in anonymous form and therefore it was not possible to investigate the vital status of individuals participating in the 1985 survey.51–53
CONCLUSIONS
The results support the argument that area characteristics at different points in time may help to explain geographical inequality in mortality; however, in light of the limitations discussed above, caution is necessary in interpreting the findings. We expect that large-scale cohort studies that collect socioeconomic data on individuals at different points during the life course, together with information on history of migration and characteristics of the area of residence, will be a more powerful way to study the influence of area on mortality.
What is already known on this subject
There is evidence of an association between mortality and deprivation.
Part of the association between mortality and deprivation is explained by differences in the social and demographic characteristics of the resident population.
Most studies of deprivation and mortality have examined the association between mortality and deprivation at only one point in time.
What this study adds
We examined the effect of deprivation at different points in time on total and cause-specific mortality.
Both infant mortality and Carstairs score were strongly associated with recent mortality.
Combining the effects of area deprivation in 1981 and in 1921–40 produces results for ischaemic heart disease and stroke that appear to be slightly stronger than those obtained when considering the two scores separately.
Acknowledgments
We wish to thank Mark Kanieff for his useful comments.
REFERENCES
Footnotes
Competing interests: None.