Article Text

Abstract
STUDY OBJECTIVE To examine the geographical variation in self perceived morbidity in the south west of England, and assess the associations with rurality and social deprivation.
DESIGN A geographically based cross sectional study using 1991 census data on premature Limiting Long Term Illness (LLTI). The urban-rural and intra-rural variation in standardised premature LLTI ratios is described, and correlation and regression analyses explore how well this is explained by generic deprivation indices. Multilevel Poisson modelling investigates whether Customised Deprivation Profiles (CDPs) and area characteristics improve upon the generic indices.
SETTING Nine counties in the south west of England
PARTICIPANTS The population of the south west enumerated in the 1991 census.
MAIN RESULTS Intra-rural variation is apparent, with higher rates of premature LLTI in remoter areas. Together with high rates in urban areas and lower rates in the semi-rural areas this indicates the existence of a U shaped relation with rurality. The generic deprivation indices have strong positive relations with premature LLTI in urban areas, but these are a lot weaker in semi-rural and rural locations. CDPs improve upon the generic indices, especially in the rural settings. A substantial reduction in unexplained variation in rural areas is seen after controlling for the level of local isolation, with higher isolation, at the wider geographical scale, being related to higher levels of LLTI.
CONCLUSIONS This study highlights the need to treat rural areas as heterogeneous, although this has not been the tendency in health research. Generic deprivation indices are unlikely to be a true reflection of levels of deprivation in rural environments. The importance of CDPs that are specific to the area type and health outcome is emphasised. The significance of physical isolation suggests that accessibility to public and health services may be an important issue, and requires further research.
- rural health
- limiting long term illness
- deprivation indices
Statistics from Altmetric.com
The problems of widening inequalities in health and health care need in the UK have been recognised since the Black Report1 first demonstrated them in the 1980s. The Acheson Report2 has confirmed their persistence and the government is now committed to tackling them.3 Most research and policy making has focused on urban deprivation, but there is growing concern about the health and health care problems of deprived rural residents.
It is increasingly recognised that the concept of the rural idyll is a myth and that many rural communities face particular problems that impinge on health including poor employment opportunities, low pay, lack of affordable housing, inaccessible public and health care services exacerbated by the declining availability of rural transport. Moreover, those who have most difficulties accessing health services tend to need them most, for example the elderly, disabled and lone parents.1
Census based deprivation indices are widely used at the area level as proxy measures for the socioeconomic status of the population and hence health care need.4-7 It has been suggested, however, that the components of these indices are biased towards urban areas and therefore poor measures of the extent of rural deprivation.8 For example, one of the core components of a number of indices is car ownership. In rural locations public transport is relatively inaccessible and consequently cars are basic necessities. The cost of running and maintaining these cars may further impoverish poor families. Accessibility difficulties are frequently cited as major concerns for deprived rural dwellers but these are not considered in the generic indices.8 9
There is little empirical research on the relation between deprivation indices and health outcomes in rural areas in the UK. The definitions of rurality, level of analysis and geographical coverage used in the studies that do exist vary greatly, making comparisons and the formation of conclusions difficult. There are indications, however, that the often assumed gradient of increasing health status with decreasing urbanisation may not persist for the remoter rural areas.10 11
This paper first examines urban/rural and intra-rural variations in health in the south west of England using the Limiting Long Term Illness (LLTI) measure. It then analyses the association of LLTI with generic measures of deprivation, custom built deprivation measures and areal characteristics. The relations are examined separately within different geographical settings, in particular exploring the determinants of intra-rural variation.
Methods
POPULATION
Compared with other UK regions, the south west is relatively healthy12 and contains a high proportion of rural areas.13 The nine counties in the region in 1991 were Avon, Cornwall and the Isles of Scilly, Devon, Dorset, Gloucestershire, Hampshire, Isle of Wight, Somerset and Wiltshire. Together, these include a population of just over six million.
DATA
As there is no universally agreed definition of rurality this research considers three alternatives: the Office for National Statistics (ONS) Ward Classification, population density, and distance to nearest neighbour. The first is a classification of wards proposed by ONS that classifies all census wards in England and Wales into one of 14 groups. The rural groups are rural areas and rural fringe and these two groups can subsequently be broken down into six clusters. The second, population density, is defined as population per hectare. Population and area data were obtained from different sources for two different levels of aggregation. First for census enumeration districts (EDs) the areas were computed using a Geographical Information System (GIS)14 and the population was obtained from the Census Small Area Statistics (SAS).15 Second, for census wards the areas were obtained from SAS and the population from the Estimating with Confidence Project, which adjusts for the underenumeration that occurred in the 1991 Census.16 Together these data enable population density to be calculated at both the ward and ED levels. Finally, mean distance to nearest neighbour was used to estimate the level of local isolation. To calculate this the grid references for each postcode in the south west were obtained from the directory of postcodes and enumeration districts at Manchester Information and Associated Services (MIMAS). Distances between each unit postcode location and its nearest postcode, determined in straight line distance, were computed. Subsequently, mean distances were calculated at ED, census ward and District Health Authority (DHA) levels. Our previous paper outlines the advantage and disadvantages of these measures and the relations between them.17
The 1991 ward level SAS provided the input for four widely used deprivation indices: Carstairs4; Jarman UPA85; Townsend6 and Department of the Environment (DoE),7 to be calculated at the ward and ED levels. In addition, the single standardised components are used in the calculation of Customised Deprivation Profiles (CDPs) for the different settings.
The numbers of people resident in households under the age of 65 who reported a LLTI in the 1991 census, were derived from the SASs at both the ED and ward levels. These were indirectly standardised for age and sex. The data exclude those living in communal establishments on the grounds that at the small area level the location of these establishments may artificially boost the prevalence of LLTI in a way that is unrelated to local conditions. LLTI is a nationally available measure of self reported ill health that has been shown to have a positive relation with social deprivation.18 19 These inequalities have been shown to be even greater than for mortality.19 Premature LLTI (0–64) is used here as it tends to have stronger associations with deprivation than when ill health at older age groups is included.20
STUDY DESIGN
The analysis commences with an exploration of urban/rural and intra-rural variation in morbidity. The variation within rural areas is explored by ONS clusters, and nearest neighbour cut off points. The nearest neighbour measure has been ranked and divided into 20 equal groupings. The first 11 groupings, representing the most urbanised areas, are aggregated to form one group, keeping the remaining nine most isolated groups separate. To investigate whether intra-rural variation can be explained by social deprivation, regression and correlation techniques are used. The four deprivation indices were examined, but because of limited space in this paper, results are only shown for the Townsend index.
The most appropriate statistical model for rare events at the small area level is a Poisson model.20 As a hierarchy exists in the dataset a multilevel methodology is used21 to allow variables at different levels of aggregation to be analysed simultaneously, using the MLwiN software package.22Individual level data are not available from SAS. Therefore, at the lowest level of the hierachy (level 1) six counts, reflecting two sexes and three age categories (0–15, 16–44, and 45–64), are produced for each ED. They are nested within EDs (level 2), wards (level 3) and DHAs (level 4). Urban, rural fringe and rural areas, as defined by the ONS Ward Classification, are modelled separately to allow for areal differences in the factors influencing LLTI. The model can be written in standard log linear form as:

where:
Nijkl = the enumeration district population in age-sex group i
λijkl = the expected number of people with LLTI in age-sex group i in EDj in ward k in DHA l
α = constant
β = the vector of parameters of interest
X ijkl = the vector of covariates
Fl = DHA residual term, distributed N(0,ς2 f)
Vkl = Ward residual term, distributed N(0,ς2 v)
Ujkl = ED residual term, distributed N(0,ς2 u)
The term loge(Nijkl) is a (fixed part) known offset. The regression models are estimated systematically with sets of predictors added at each step, avoiding any multicollinearity. Model selection is by a combination of forwards and backwards selection.
To demonstrate the independent effects of the explanatory variables in the final models the parameter estimates are exponentiated and interpreted as relative risks, for which 95% confidence intervals are calculated. The unexplained variation occurring at the ED, ward and DHA levels is reported for a series of models. The regression coefficients produced in the multilevel modelling enable weights to be determined for each significant indicator of deprivation. These are used to compute custom built indices. The customised indices are subsequently used to calculate the relative risks and predicted probabilities of having a premature LLTI for people living in an ED at the upper quartile of deprivation compared with their peers at the lower quartile of deprivation.
Results
key points
-
There is significant intra-rural variation in self reported morbidity (LLTI), though average levels are less than in urban areas
-
There is a J shaped relation between LLTI and urbanisation, within rural areas levels are highest in isolated areas.
-
Generic deprivation indices are good explanatory variables for LLTI in urban areas but not in rural areas.
-
Custom built deprivation measures improve the prediction of LLTI in rural areas.
-
Accessibility to public services maybe associated with LLTI in rural areas but more research is needed.
URBAN/RURAL AND INTRA-RURAL VARIATION IN PREMATURE LLTI
Figures 1 and 2 illustrates the geographical distribution of age sex standardised ward level premature LLTI ratios and the distribution of rural areas, rural fringe and urban wards as classified by the ONS Ward Classification. A comparison of the two maps indicates high rates in the most rural parts of the south west region as well as in the main urban centres. One must bear in mind that the maps are visually biased, emphasising the larger rural wards.

The ONS Ward Classification.

Standardised Limiting Long Term Illness ratios (0–64).
As in other studies,18 greater variation in LLTI exists in urban areas. However, significant rural variation does exist. Figure 3shows the intra-rural variation in mean premature LLTI for the rural areas and rural fringe ONS clusters. The plot highlights the heterogeneity within rural areas. The remoter coast and country has significantly higher rates of premature LLTI than the accessible countryside.

Ward level inra-rural variation in premature LLTI, by ONS cluster. Number of wards shown in parentheses in the left panel.
Figure 4 shows the mean rates of premature LLTI by the nearest neighbour variable. The graph indicates a U shape relation, with higher rates in the urban and isolated rural areas and lower rates in the semi-rural areas. This supports the findings of figure 3. The relation between population density and LLTI, however, did not reveal a U shape relation.
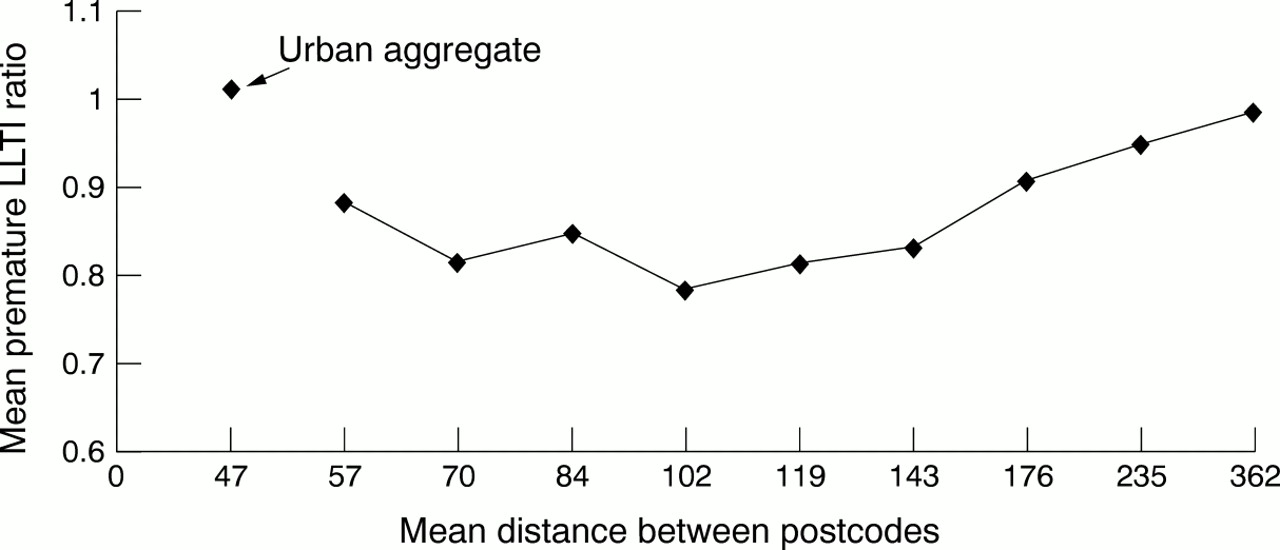
Ward level intra-rural variation in premature LLTI, by distance to nearest neighbour.
THE RELATION BETWEEN SOCIAL DEPRIVATION AND VARIATION IN PREMATURE LLTI
Premature LLTI is positively correlated with all of the deprivation indices. However, the strength of the association varies between area types. The associations are strong in urban areas, but a lot weaker in the rural fringe and rural areas. This is illustrated in figure 5 where the Townsend index explains 67% of the variation in urban areas but only 3% in rural areas. Similar results for the other indices suggest that these generic deprivation indices are not good explanatory variables in rural areas, in contrast with their established effectiveness in urban areas.

Relation between LLTI and the Townsend deprivation index at the ward level, by area type. **p<0.01.
MULTILEVEL MODELLING: ACCOUNTING FOR AGE, SEX, DEPRIVATION AND AREA CHARACTERISTICS
The parameter estimates for the final models for each area type are shown in table 1, with the relative risks for the variables with interactions in table 2. The unexplained residual multilevel variances for five models are in table 3. Initially there is far greater unexplained variation at the ward and ED levels, but not the DHA level, in urban areas than both the rural areas and rural fringe. The unexplained variation in all settings is however, explained to a large extent by the factors that are entered into the final models displayed in table 1.
Final models1-151 for premature LLTI by area type
Relative risks of LLTI by age/sex group for rural fringe and urban areas
Unexplained variation in premature LLTI, at the DHA, ward and ED levels, by area type, for five different models
Although age and sex are important determinants of premature LLTI, model 2 in table 3 shows that unexplained variation remains after these are controlled for. The relative risks for the age/sex interactions in the rural fringe and urban models, displayed in table 2, indicate that the difference between males and females is greater in childhood than adulthood. However it remains greater for males at all ages. In rural areas (table 1), similarly, increasing risks of LLTI are apparent for males and with increasing age, but the difference between the sexes does not change with age.
A significant positive association exists between the Townsend index and premature LLTI in all settings. Supporting the earlier findings, the impact is much stronger in urban areas, as the variance at all three levels is dramatically reduced (model 3 in table 3). In the rural settings a reduction is only demonstrated at the ED level. The relative risks of LLTI for someone living in an ED at the upper quartile of deprivation compared with one at the lower quartile of deprivation, based on the Townsend index, are 1.47 in urban areas, 1.24 in the rural fringe and 1.11 in rural areas.
Table 1 reveals that different deprivation characteristics comprise the CDPs in the different area types. Unemployment is the most significant variable in the urban model. The children in low earning households variable is by far the strongest in the rural models, followed by the lack of basic household amenities and no car variables. In model 4 of table 3 a reasonable reduction is seen at the ED level, especially in the rural areas and rural fringe models, whereas at the ward and DHA levels the CDPs are only a marginal improvement over the generic indices. The relative risks of living in an ED at the upper quartile of deprivation compared with one at the lower quartile, based on the custom built deprivation indices, change slightly from using the Townsend Index to 1.50 in urban areas, 1.27 in the rural fringe and 1.13 in rural areas respectively.
To illustrate how well a model incorporating age, sex and deprivation explains LLTI we have shown the predicted probabilities of having a premature LLTI for men aged 16–44 living in an ED at the upper quartile of deprivation compared with those in one at the lower quartile of deprivation, based on the custom built deprivation indices (table 4). The ED level residual variance is then varied by 1 and 2 standard deviations above and below the mean. The ED level residual variation reflects characteristics of the ED associated with LLTI that were either unobserved (or unobservable). Thus an individual two standard deviations above the mean can be thought of as being at the 95% percentile of LLTI for those at the upper (or lower) quartile of deprivation. The range reflects EDs that have relatively high or low levels of LLTI on these unobserved characteristics. The upper and lower deprivation quartiles do differentiate levels of LLTI in all of the settings. The range of LLTI is lower in the rural settings than urban settings, with higher levels of premature LLTI occurring in urban areas. However, it should be noted that the ranges at the lower and upper quartiles overlap. This indicates that while deprivation is extremely important, other unobserved (or unobservable) factors such as access to services may play a part as the interpretation is that someone in an area with a relatively low LLTI but at the upper quartile of deprivation has the same probability of an LLTI as someone in an area with a relatively high LLTI but at the lower quartile of deprivation.
Predicted probabilities of premature LLTI at the ED level in the different settings by upper and lower quartiles of deprivation, based on the custom built indices
Figure 6 replicates figure 5, replacing the Townsend index with the custom built indices. A distinct improvement can be seen when using the custom built measures over the generic in the rural areas and rural fringe. The Townsend Index explains much less of the variation in premature LLTI in rural areas, than the custom built index.

Rleation between premature LLTI and the custom built deprivation indices at the ward level, by area type. **p<0.01.
The inclusion of ONS clusters in the rural model in table 1 produces similar results to figure 3, with the lowest risk of LLTI occurring in the accessible countryside. When measured at the ward and ED levels the nearest neighbour variable has a weak positive association with premature LLTI in rural areas. However, when the highly significant DHA nearest neighbour variable is entered into the model the ED and ward variables become insignificant. The positive relation indicates increasing levels of LLTI with increasing local isolation. There is no significant independent effect of population density at any level, in any setting once the other factors are controlled for. Until the area characteristics are added to the model the unexplained variation in table 3 for rural areas at the DHA level has only been marginally reduced. This multilevel variance is dramatically reduced by the area characteristics, in particular by the nearest neighbour variable. In contrast, the age, sex and deprivation variables have already had quite an impact on the urban DHA variance, and only a slight reduction is caused by the area characteristics.
Discussion
We have found that generic deprivation indices have different relations with ill health in urban and rural areas. No matter how rurality is defined, they are weakly associated with premature LLTI in rural areas, in contrast with the strong relations observed in urban areas.23 24 Assuming a strong relation between premature ill health and deprivation, these indices are therefore unlikely to be reflecting true levels of deprivation in rural areas. Despite this they are commonly used as proxies for social deprivation in health literature. This may have confounded research that has used these measures to correct for deprivation when making urban and rural health comparisons.25 26 Instead, the method of measuring deprivation needs to be sensitive to the geographical setting.
Customised deprivation profiles have previously been shown to have greater associations with specific health outcomes than generic deprivation indices.27 The prediction of premature LLTI in this paper is improved by the use of the custom built measures, especially in the rural areas and rural fringe. To avoid multicollinearity, many indicators of deprivation are omitted from the urban model due to high correlations between variables. In contrast, the correlations between the indicators in the rural models are very weak, and variables are excluded from models because of their insignificance. This suggests that some of the indicators included in the generic indices are not adequate for measuring rural deprivation. The Townsend deprivation index suggests that the variation in premature LLTI with deprivation in rural areas is not great, with only an 11% greater relative risk of having a LLTI at the upper quartile compared with the lower quartile of deprivation. When this index is replaced with custom built measures of deprivation, which are more appropriate for the area characteristics and health outcome, the impact of deprivation is only slightly greater. Residents living in ED at the upper quartile of deprivation in rural areas are 13% more likely to have a premature LLTI as those living in one at the lower quartile. The greater difference in morbidity, at ED level, between the upper and lower quartiles in urban areas may reflect a greater range of deprivation, or the inability of area based measures to pick up pockets of rural deprivation. The multilevel modelling results indicate that introducing deprivation into the model reduces the ward level unexplained variation in urban areas but not in rural areas, where it only has an impact at the ED level. This provides empirical evidence that at higher levels of aggregation rural areas become too heterogeneous to use an area-based measure of deprivation. The use of individual level data may increase the strength of the relations between deprivation and morbidity in the more heterogeneous rural EDs and wards.
The relative importance of different deprivation characteristics in the different settings indicates the importance of modelling urban and rural areas separately. In urban areas the unemployment variable is of greatest significance. The cost and time taken to travel to register as unemployed may deter job seekers, and it is possible that these figures are underestimates and low pay may be a more accurate measure of rural deprivation. This is supported by the highly significant children in low earning households variable in the rural settings. At present, however, income data are not collected in the census.
This study identifies the existence of intra-rural variation in self reported morbidity. The initial analyses indicate the lowest rates of premature LLTI in the more accessible countryside, and this is later confirmed by the modelling. Together with the high rates in urban areas, this suggests the existence of a U shape relation. Others have also found health problems to occur more frequently in isolated areas.10 11 It is especially demonstrated here using distance to nearest neighbour as the definition of rurality. The nearest neighbour measure has not been used in health related research, but these findings suggest that it may be an important factor, at least for self reported morbidity. Its strong significance at the DHA levels over the ward and ED suggests a greater importance of isolation at the larger geographical scale.
This paper suggests that levels of LLTI may be greater in isolated rural areas. However, it is important to remember that the census LLTI question is self reported and does not reflect any direct medical diagnosis making it less objective than other health measures. There is no precise definition of what constitutes a LLTI leaving respondents to use their own notions of “limiting” and “long term”. It is possible that the answers are culturally conditioned. For example, the perception of the limiting effect of any condition may be greater in isolated areas where inaccessibility to public services is more likely to be a problem. This study cannot distinguish whether the higher levels are true differences or a difference in the perception of the limiting effect of morbidity. Whatever the explanation, LLTI is important to policy makers because of the impact on people's quality of life. There is evidence that LLTI does not correlate well with mortality and tends to be higher than expected in more rural areas such as Wales and the south west.19
Population density did not prove to be a contextual feature associated with ill health. We have discussed in a previous paper the difficulties in defining and measuring rurality.17 This paper shows that local isolation, represented by the nearest neighbour measure, is not a property of population density/sparsity, the measure commonly used as a rurality definition in health research, as they measure different aspects of the population distribution. In general rural health research needs to give greater consideration to the definition of rurality.
Our findings indicate that there is a strong need for better ways of measuring rural deprivation and for understanding the contribution of areal “contextual” factors in relation to health. One approach to the measurement of the multivariate nature of rural deprivation is the construction of bundles of measures; each associated with separate aspects, which may have relevance to different public sector policy contexts. One proposed bundle is access to services and physical isolation.28 The significance of the nearest neighbour measure in our findings indicates this might be important for health policy. More research is needed into the measurement of accessibility to public and health care services and its association with health and health care use in rural areas. Access is complex and includes the supply of local public services, and primary, secondary and tertiary health care and transport availability and travel distance. Also causal directions are hard to establish, while health care provision can influence health, selective migration and inequity of provision to deprived areas might account for any association. Nevertheless, it is still important to ensure equitable health care delivery in relation to health care need in rural areas.
There are some important limitations to this study that must be borne in mind. Firstly, its coverage of only one region may mean the findings are not fully generalisable to other rural areas. The South West Region has a good general health status, it contains few industrial villages, no large metropolitan areas and is atypical in its “peripherality”. A replication of this study in contrasting geographical areas would be useful. Secondly, the relations have only been explored for one self reported measure of health status. The data do not reflect any specific medical diagnosis and perceptions of “limiting” and “long term” will vary. As mentioned above it is possible, for example, that answers are culturally conditioned by expectations about health and that access to services may affect perceptions of “limiting”. However, these are the only nationally available data on morbidity at the small area level and research has shown physicians and patients' ratings of health to be consistent29 and it is used in resource allocation.30 Further work is needed using other measures of health status, such as mortality. A common methodological problem in rural research is the levels of aggregation. Although we used the ward and ED levels even these may be internally heterogeneous with pockets of deprivation and LLTI. The effect is to bias results so that there is no relation between deprivation and health in rural areas. However, this has to be balanced by the statistical instability that would arise from smaller areas because of the rarity of health events.
In conclusion, this study has demonstrated that, in contrast with urban areas, premature LLTI in non-urban areas is poorly characterised by generic deprivation indices. Custom built measures are an improvement. Better measures of rural deprivation, relevant to health policy, are required, using alternative data sources, which can then be validated against health outcomes, possibly incorporating individual level variables or additional contextual factors. The higher levels of LLTI in less accessible rural areas suggest that the contribution of accessibility to public and health care services is one approach that needs exploration.
Acknowledgments
Thanks are due to Steve Clements for very helpful comments on an earlier draft.
Footnotes
-
Funding: Sarah Barnett is supported by Medical Research Council studentship G610/47.
-
Conflicts of interest: none.