Article Text

Abstract
Objective To examine variations in health service expenditures and social services expenditures across Organisation for Economic Co-operation and Development (OECD) countries and assess their association with five population-level health outcomes.
Design A pooled, cross-sectional analysis using data from the 2009 release of the OECD Health Data 2009 Statistics and Indicators and OECD Social Expenditure Database.
Setting OECD countries (n=30) from 1995 to 2005.
Main outcomes Life expectancy at birth, infant mortality, low birth weight, maternal mortality and potential years of life lost.
Results Health services expenditures adjusted for gross domestic product (GDP) per capita were significantly associated with better health outcomes in only two of five health indicators; social services expenditures adjusted for GDP were significantly associated with better health outcomes in three of five indicators. The ratio of social expenditures to health expenditures was significantly associated with better outcomes in infant mortality, life expectancy and increased potential life years lost, after adjusting for the level of health expenditures and GDP.
Conclusion Attention to broader domains of social policy may be helpful in accomplishing improvements in health envisioned by advocates of healthcare reform.
- Health services
- international health
- health spending
- health outcomes
Statistics from Altmetric.com
Many countries are increasingly confronting issues of rising healthcare costs with limited improvement in health outcomes. The issue is particularly acute in the USA, which ranks highest among Organisation for Economic Co-operation and Development (OECD) countries in healthcare spending as a percentage of gross domestic product (GDP) while remaining among the lowest in key health indicators.1–3 As an illustration, in 2005 the USA spent 16% of GDP on healthcare compared with an average of 9% spent by other OECD countries, and in 2006, the USA ranked 25th in life expectancy, 29th in infant mortality and 24th in maternal mortality among the 30 OECD countries.4
Previous efforts to understand the paradox of higher health care spending without necessarily better health outcomes have implicated over-reliance on private financing,5 6 disparities in quality of care,7 8 high medical prices9 and too few primary care providers.3 10–13 What has been less examined is the role of spending on social services, which may be productive for health. Social spending includes such investments as income supplements, housing, unemployment coverage and other social policy targets. Although health professionals have long recognised the importance of socio-economic, environmental and behavioural determinants of health, healthcare reforms have focused largely on spending for health services, with less attention focused on spending in potentially important social policy areas.
Accordingly, we sought to examine the associations between social expenditures and health expenditures, and a set of common health outcomes across the OECD countries. As a measure of relative investment, we also examined the ratio of social expenditures to health expenditures and its association with life expectancy, infant mortality, low birth weight, maternal mortality and potential life years lost using the OECD Health Data 2009 Statistics and Indicators and the OECD Social Expenditure database.4 14 Findings from our analysis can contribute to the current debate in the USA and other countries about how best to direct limited resources to promote population health outcomes.
Methods
Study design and sample
We conducted a pooled, cross-sectional analysis of OECD countries (n=30 countries) using data from the 2009 release of the OECD Health Data 2009 Statistics and Indicators.4 We examined social spending using data from the OECD Social Expenditure Database.14 We examined data from 1995 to 2005, the dates for which complete and reliable data on both health and social expenditures were available. These commonly used data are increasingly standardised to be comparable across countries and years. We excluded Turkey from all analyses owing to missing data in several years. Analyses were completed both including and excluding the USA.
Measures
Health outcomes
We examined five health outcomes measured at the country level over the 11-year study period. We selected measures that spanned the most commonly used and most fundamental measures of population health, including life expectancy, infant mortality, low birth weight, maternal mortality and potential life years lost. Life expectancy was measured as the average number of years that a person at birth is expected to live. Infant mortality measured the number of deaths of children aged less than 1 year per 1000 live births, and low birth weight was the number of live births that weighed less than 2500 g as a percentage of total live births. Maternal mortality was measured as the number of maternal deaths from all causes per 100 000 live births. We used potential life years lost as a summary measure of premature mortality deaths, which occurred at younger ages and were considered preventable. In the OECD Health Data, potential life years lost were calculated by summing up deaths occurring at each age and multiplying the sum by the number of remaining years to live up to age 70, and were reported per 100 000 population aged 0–69 years.
Health service expenditures
Health service expenditures included public and private spending on curative care, rehabilitative care, long-term care, ancillary services such as diagnostic imaging, laboratory tests and patient transport; outpatient medical goods, prevention and public health services, health administration and health insurance and healthcare capital expenditures (ie, the International Classification of Health Accounts codes for healthcare and healthcare related functions, HC.1–9; HC.R.1, in the OECD Health Data). We also included spending on health education and training (code HC.R.2), health research and development (code HC.R.3), and long-term care services for community-living people with functional limitations (code HC.R.6.1).
Social services expenditures
Social services expenditures included public and private spending on old-age pensions and support services for older adults, survivors benefits, disability and sickness cash benefits, family support, employment programmes (eg, public employment services and employment training), unemployment benefits, housing support (eg, rent subsidies) and other social policy areas excluding health expenditures. Both health and social expenditures were expressed as a percentage of the country's GDP in the relevant year. We used the aggregate expenditures on health and social services because the measures were the most complete and most consistently measured variables available across countries and over the 11-year time period of the analysis.
Data analysis
We used standard descriptive analyses to characterise the percentage of GDP in each country that was spent on health services, social services and the ratio of social expenditures to health expenditures, using 2005 data. In addition, we estimated a series of mixed-effects models with the pooled data over 11 years and 29 countries to examine the correlation of health service expenditures and the five outcomes, of social services expenditures and the five outcomes, and of the ratio of social to health service expenditures, adjusted for health expenditures, and the five outcomes. We also examined the interaction of social expenditures and health expenditures. In each model, we included the logarithm of GDP per capita measured in US dollars adjusted for purchasing power parity, and we allowed the intercept and the expenditure variables to vary randomly over countries. To account for heteroskedasticity, we estimated the residual errors independently for each country. In a sensitivity analysis, we re-estimated all the models excluding the US observations to assess how many of our findings were influenced by the unique spending patterns in the USA. All analyses were performed using SAS version 9.1 and Stata 11.1.
Results
Most OECD countries spent between 20% and 35% (mean 26.3%) of their GDP in 2005 on the composite of health service and social services expenditures (figure 1). Nevertheless, the mix of social services spending and health service expenditures varied substantially (figure 2). Compared with other OECD countries, the USA spent a greater proportion of total health and social services expenditures on health services, while peer OECD countries spent a greater proportion on social services (figure 3). The average ratio of social to health service expenditures for OECD countries from 1995 to 2005 was 2.00 (table 1); the ratio in the USA during this period was 0.91.
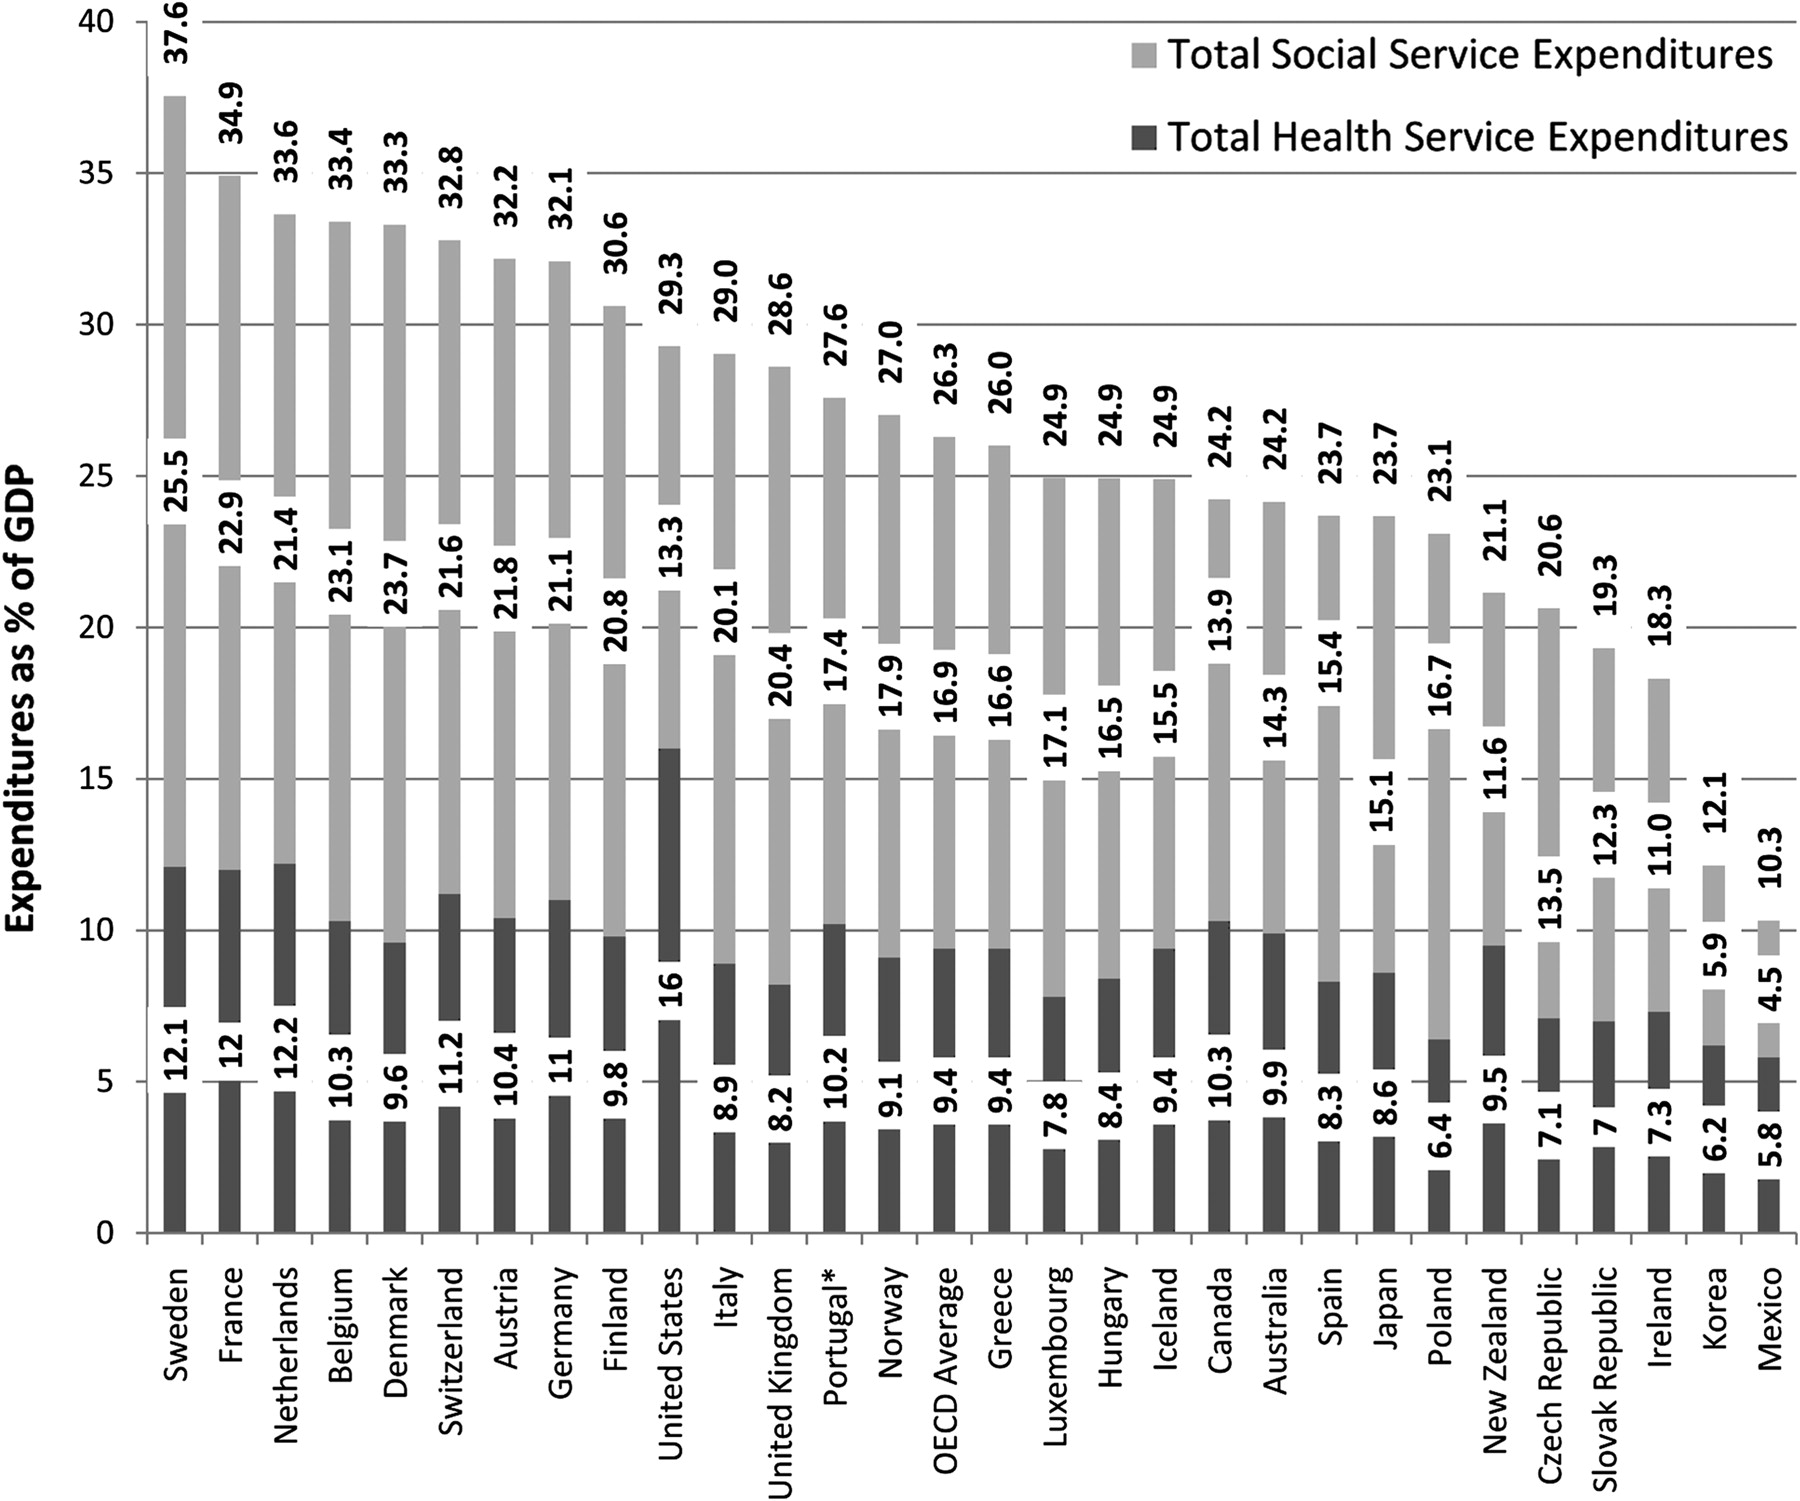
Total health-service and social-services expenditures for Organization for Economic Co-operation and Development (OECD) countries, 2005. *Expenditures for Portugal are from 2004, owing to missing data for 2005. Source: OECD Health Data 2009 (accessed June 2009); OECD Social Expenditure Dataset (accessed December 2009); authors' calculations. GDP, gross domestic product.
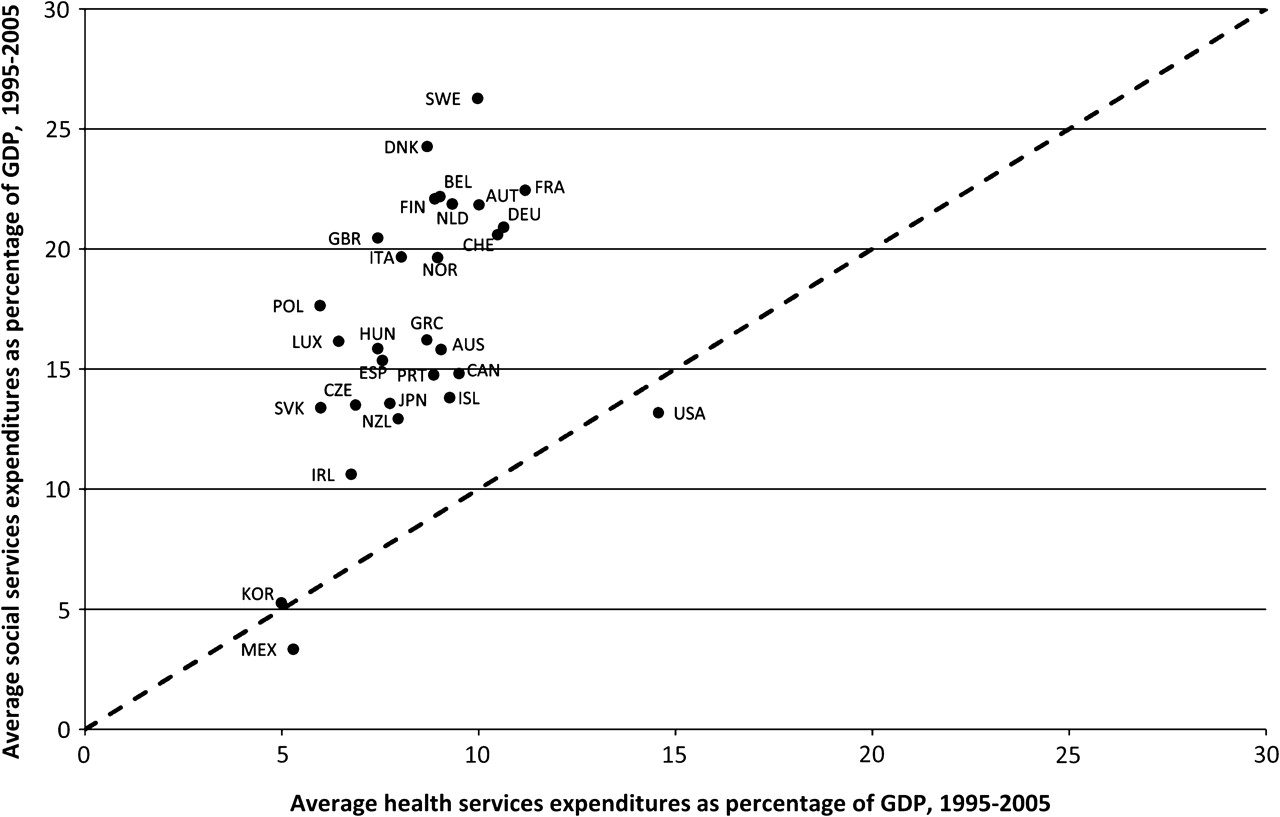
Average social-services expenditures versus average health-services expenditures as percentages of gross domestic product (GDP) from 1995 to 2005, by country. *Social services expenditures Hungary are missing for 1995–1998, and for Portugal for 2005; health-services expenditure data are missing for the Slovak Republic for 1995–1996. Source: OECD Health Data 2009 (accessed June 2009); OECD Social Expenditure Dataset (accessed December 2009); authors' calculations.

Ratio of social to health service expenditures for Organization for Economic Co-operation and Development (OECD) countries, 2005. The ratio is calculated by dividing total expenditures on social services by total expenditures on health services. *The ratio for Portugal is from 2004, owing to missing data for 2005. Source: OECD Health Data 2009 (accessed June 2009); OECD Social Expenditure Dataset (accessed December 2009); authors' calculations.
Summary of health-outcome measures, health service expenditures and social services expenditures for Organization for Economic Co-operation and Development Countries, 1995–2005
In model 1 (table 2), we found that health-service expenditures as a percentage of GDP were significantly associated with better health outcomes in only two of the five indicators (life expectancy and maternal mortality). In model 2 (table 2), social expenditures as a percentage of GDP were significantly associated with better health outcomes in three of the five indicators (life expectancy, infant mortality and potential years of life lost) and with worse health outcomes in one of the indicators (low birth weight). In models with both health expenditures and social expenditures included, results were largely unchanged (results not shown), and their interaction was not significant. In model 3 (table 2), the ratio of social to health expenditures, adjusted for GDP per capita, was significantly associated with greater life expectancy, lower infant mortality and fewer potential years of life lost, although it was also significantly associated with increases in low birth weight. None of the associations regarding the social expenditures or the ratio of social to health expenditures with health outcomes differed markedly in direction or magnitude when the USA was removed from the analysis, although without the USA included, associations of health expenditures and infant mortality and low birth weight remained in the same direction but became significant.
Multivariate analysis of health and social expenditures on health outcomes
Discussion
Our analysis demonstrates that OECD countries differ substantially in how much they spend on social services relative to health services and that the ratio of social expenditures to health-service expenditures, adjusted for overall GDP per capita, is associated with better outcomes in key health indicators. Although experts have suggested that social services may be important in explaining differential health outcomes,6 15 16 our research adds to this literature by demonstrating empirical associations between the ratio of social services expenditures to health service expenditures and health outcomes, even after adjusting for the level of health expenditures and GDP per capita. The implication is that social spending is also productive for health, and for OECD countries, the ratio of social expenditures to health expenditures may influence health outcomes beyond that which results from health spending alone.
Critical to interpreting these data is the understanding that we focused on population-based health outcomes, such as life expectancy, infant mortality and potential years of life lost. Life expectancy and potential years of life lost estimates are central indicators of health in a population or country, for which the OECD has established standardised approaches to measurement, supporting cross-country comparisons as used in our analysis.
Measures that focus on medical services, such as cancer screening and survival rates, have been shown to be linked with health expenditures.3 16 17 Nevertheless, in terms of population health measures, by which the OECD countries are often compared, our work suggests that the link with health spending is limited. Although most health-reform efforts to improve health status focus on health expenditures, it may be that additional attention on social services is also needed. This approach is consistent with public-health frameworks, which have frequently highlighted the social over the biological and medical determinants of health.
Our results should be interpreted in light of some limitations. First, we did not adjust for factors such as a history of public spending and political ideology, which may influence health18–20 and may underlie the empirical associations that we find between social-services spending and population-based health outcomes. Although these factors may be important precursors to country decisions for spending in health services and social services, establishing the roles of historical and ideological factors is beyond the scope of this empirical enquiry. Second, we examined data from OECD countries only, and relationships between the mix of social-services and health-services expenditures and health outcomes may differ substantially in lower-income countries. Third, we did not adjust for national differences in lifestyle such as diet, smoking and physical activity, for which we did not have any reliable cross-country measures for the 11-year period of this study. Fourth, included in our health-service expenditures is spending on health education, and research and development, which may be viewed as a global public good, which potentially could benefit countries other than that financing this expenditure. Nevertheless, even in the USA, which ranks 9th among the OECD in terms of the percentage of GDP spent on health education, and research and development, this component of health-service expenditures accounts for less than a quarter of a per cent of GDP and hence is unlikely to have influenced our findings substantially. Last, the findings remain complex. Although several key health outcomes are positively responsive to increased social-services spending, this trend was not uniform. For instance, low birth weight seemed to increase with higher social-services spending, although the magnitude of the effect was modest. This finding may reflect genetic factors or sociocultural features of the populations that were not controlled for in the analysis owing to data limitations.
Although previous researchers have called for a greater emphasis on the social and behavioural determinants of health in healthcare reform,3 6 15 16 20–23 most health reforms continue to focus on health expenditures, including the mix of public versus private health spending, performance-based financing and efforts to improve evidence about the comparative effectiveness of various medical treatments. Our findings suggest that the paradox of high health spending without improved health outcomes within the OECD countries may be informed by differences in spending in social-services areas. Reforms that target only health expenditures may miss important opportunities. Rather, greater attention and reform in broader domains of social policy, such as unemployment, housing and education, may be necessary to accomplish the improvements in health envisioned by advocates of healthcare reform.
References
Footnotes
Competing interests None.
Provenance and peer review Not commissioned; externally peer reviewed.