Socioeconomic determinants of health: The contribution of nutrition to inequalities in health
BMJ 1997; 314 doi: https://doi.org/10.1136/bmj.314.7093.1545 (Published 24 May 1997) Cite this as: BMJ 1997;314:1545
- W Philip T James, directora,
- Michael Nelson, senior lecturer in nutritionb,
- Ann Ralph, research nutritionista,
- Suzi Leather, consultant to the Food Poverty Networkc
- a Rowett Research Institute, Bucksburn, Aberdeen AB21 9SB
- b Department of Nutrition and Dietetics, King's College London, London W8 7AH
- c National Food Alliance, London EC2A 2BH
- Correspondence to: Dr Ralph
Abstract
Social class differences in health are seen at all ages, with lower socioeconomic groups having greater incidence of premature and low birthweight babies, heart disease, stroke, and some cancers in adults. Risk factors including lack of breast feeding, smoking, physical inactivity, obesity, hypertension, and poor diet are clustered in the lower socioeconomic groups. The diet of the lower socioeconomic groups provides cheap energy from foods such as meat products, full cream milk, fats, sugars, preserves, potatoes, and cereals but has little intake of vegetables, fruit, and wholewheat bread. This type of diet is lower in essential nutrients such as calcium, iron, magnesium, folate, and vitamin C than that of the higher socioeconomic groups. New nutritional knowledge on the protective role of antioxidants and other dietary factors suggests that there is scope for enormous health gain if a diet rich in vegetables, fruit, unrefined cereal, fish, and small quantities of quality vegetable oils could be more accessible to poor people.
Introduction
The poorer health of people in the lower socioeconomic groups in Britain is now well recognised (table 1),1 but its origins are complex. Diet has been considered a possible factor, but this is often seen as unlikely because most of the classic nutritional deficiencies are rare in Britain. Modern nutritional research into the pathophysiological basis of a variety of diseases has presented a new perspective, as shown in table 2). Many of the risk factors are clear, but the dietary contributors are just emerging. Physical activity is included because it determines total dietary intake, affects food choice, and has an independent metabolic effect.
Observed prevalence of disease and risk factors within social class, in men and women of all ages.1 Values are percentage of population; blood pressure is given as mean values
Excess disease rates in lower socioeconomic classes and their relation to diet in Britain
Underlying most of these conditions are genetic factors which probably do not cluster in the lower socioeconomic groups, but any environmental disadvantage will have an impact on people who are genetically vulnerable. Excess smoking is a direct contributor to the clustered pattern of diseases–it operates partly through diet, influencing food choice adversely and reducing the dietary contribution to the antioxidant and DNA repair capacity of the body.2 Table 2) shows the importance of dietary quality and physical inactivity in promoting the wide range of preventable conditions affecting poor people. A high intake of vegetables, fruit, and fish with modest amounts of appropriate fats and limited intakes of foods and drinks rich in fats, salt, and sugars seems, with sustained physical activity and non-smoking, to be capable of promoting substantial health gains.
Dietary and activity patterns
The annual national food survey of 7000 British households shows that, compared with the highest income group (A), low income groups D and E2 consume more milk (but less semiskimmed milk), meat and meat products (of which more is higher fat meat products), fats, sugar and preserves, potatoes, and cereals.3 They consume fewer fresh vegetables, fruit, and higher fibre products such as brown and wholewheat bread. Thus, the intake of nutrients as a percentage of the reference nutrient intake (the level that prevents 97.5% of the population from developing a classic deficiency) is lower in groups D and E2 for all nutrients, and markedly so for calcium, iron, magnesium, folate (and other B vitamins), and especially vitamin C (181% for group A v 118% for D and E2). Although some of these values are above 100% of the reference nutrient intake, this measure does not relate to newer knowledge on the protective role of nutrients as set out in table 2).
Over the past 15 years, food consumption and energy intakes have fallen, reflecting an increasingly sedentary lifestyle–but, as energy intakes decline, diets need to become more nutrient dense to compensate. The data in table 3) suggest that rich people have been better able to compensate than poor people. Moreover, there is a growing disparity in the diet between rich and poor. For every item, the changes between 1980 and 1995 have been worse for groups D and E2 and, except for vitamin C intake, the differences between groups A and D and E2 are greater now than 15 years ago, whether intake is expressed in ounces and grams or in terms of energy density (amount per 1000 kcal/4184 kJ).3
Comparison of food consumption and of nutrient intake or dietary density (per 1000 kcal/4184 kJ) in high (A) and low (D and E2) income groups (from national food survey, 1980-953)
The poverty gradient and the poverty trap
Even within the groups D and E2 there is a consumption gradient. Low income households with earners (group D) report lower levels of home purchases than households without an earner, dependent mainly on income support (E2). This difference is not explained by more food being obtained away from home by group D. The loss of benefits associated with moving off income support (such as free school meals) probably pushes group D households into the poverty trap.4 When food spending is very restricted, as for the 20% of income support claimants with compulsory deductions for rent or fuel, their diet is far below the reference nutrient intake for iron, calcium, dietary fibre, folate, and vitamin C; it is lower still for smokers.5
Food expenditure
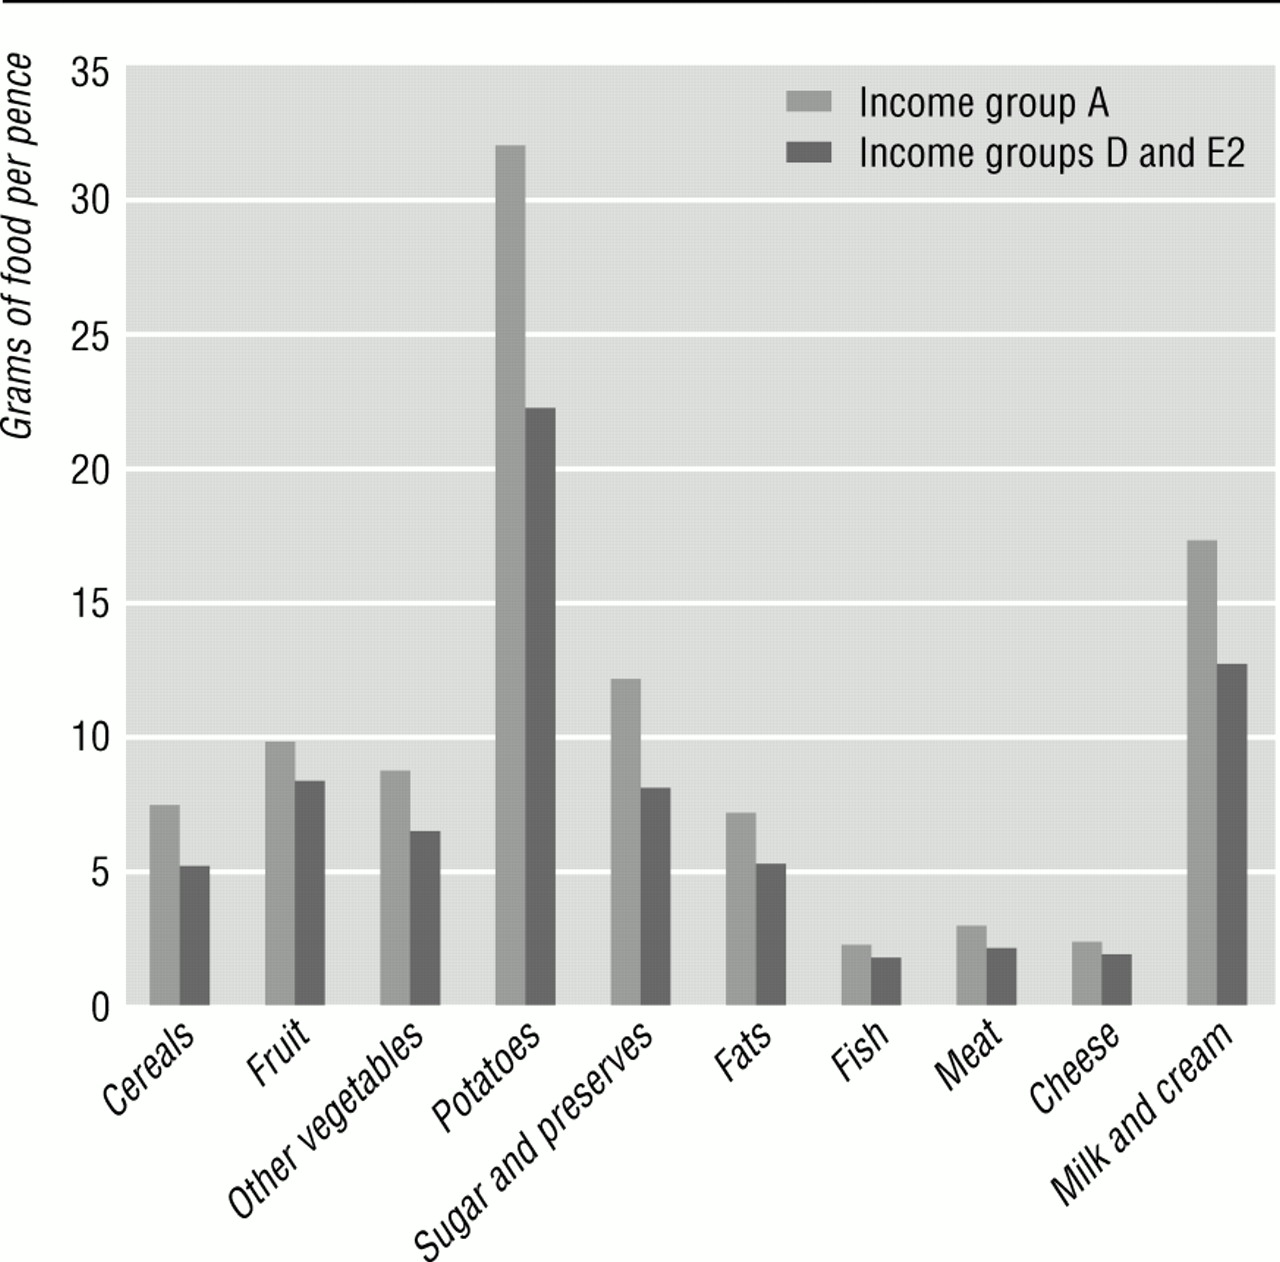
Households in the bottom tenth of the income distribution spend on average 29% of their disposable income on food (after allowance for housing costs); those in the top tenth spend 18% (fig 1). In families with children, expenditure on food per person in the bottom fifth of income is extraordinarily low (£1.64/person/day in lone parent families). Low socioeconomic groups, however, buy more efficiently than high income households (fig 2): the bottom tenth spends far less on alcohol (£1.85/person/week v £7.73 in the top tenth) and sweets (£0.46 v £0.68).6 But these efficiencies lead to the purchase of foods richer in energy (high in fat and sugar) to satisfy hunger, which are much cheaper per unit of energy than foods rich in protective nutrients (like fruits and vegetables).7 The purchase of healthy options within mainstream eating patterns is likely to increase the food bill by 6-13%.8

Percentage of household spending on food after allowance for housing costs and amount spent per person per week, by tenth of income6

Spending efficiency (grams of food/pence), by income group, 19942
How can low income households have healthy diets?
Low income not only restricts the ability to buy foods rich in protective nutrients but also limits the access to food retailers where healthy food can be purchased more cheaply.9 Few of the poorest families have access to a private car, but retailers have been moving out of town, and the total number of retail outlets has declined by 35% since 1980. In only six years (1986-92), a quarter of greengrocers have closed. The spending efficiency in groups D and E2 is achieved in spite of often having to shop locally, where food can be 30% more expensive than in supermarkets.9
Social class differences in diet throughout the life cycle
The data in the national food survey3 are based mainly on food purchases. The picture of increasing social class inequality in diet is confirmed by surveys within special groups.
Pregnancy and birth
A poor diet in pregnancy, and smoking, leads to low birthweight babies.10 A diet low in folate not only predisposes to neural tube defects but also to lower birth weight and a shorter pregnancy.11 Lack of n-3 fatty acids from fish affects brain development, shortens pregnancy, reduces fetal weight gain,12 and limits placental function and fetal growth; this potential predisposes to adult diseases such as hypertension, diabetes, abdominal obesity, and coronary heart disease.10 The lower socioeconomic groups have greater rates of adolescent pregnancy, prematurity, and low birth weight.
Infants
Breast feeding is increasingly recognised as fundamental for long term health, but the breast feeding rate in the lowest socioeconomic groups is only half that in the highest socioeconomic groups.13 Numerous trophic factors, immune cells, polyamines, and long chain n-3 fatty acids that are present in breast milk promote growth and intestinal and brain development; breast feeding also avoids inappropriate dietary antigens–for example, from cows' milk and gluten–thereby limiting the risk of intercurrent infections; diarrhoea (and necrotising colitis); chest infections; virally induced, insulin dependent diabetes; and atopic disease (see table 2) until at least adulthood. Preterm babies who are breast fed show higher IQs at age 8 (but social and educational components of parenting skills also link with maternal social class). It is now urgent to transform breast feeding rates in the low socioeconomic groups in Britain. Infants from lower socioeconomic groups have surprising rates of anaemia because of prematurity, with low iron stores and the inappropriate early feeding with whole cows' milk.14
Preschool children
Inappropriate weaning fails to introduce vegetables and fruits within the critical period needed to establish dietary tastes; instead, early use of sweet and salty foods stimulates the primary taste buds, and persisting demands are amplified by parental reward systems using sweets, biscuits, cakes, soft drinks, sweetened yoghurt, and highly seasoned foods such as crisps. A diet high in these foods induces higher blood pressures within six months; dental erosions of primary teeth begin; and few fresh fruits or vegetables are then consumed.15 Nutrient density is low, so intakes of micronutrients are modest. The effect of suboptimal vitamin and mineral intake on immune function, as shown in elderly people, may also explain the predisposition to recurrent infections of children from lower socioeconomic groups.16
Schoolchildren and adolescents
The poor diet of children from lower socioeconomic groups contributes to high rates of dental caries. The predisposition to anaemia in girls is amplified by inactivity, which reduces total food and therefore iron intakes and, with poor vitamin C intakes, iron absorption. Low intakes of available iron from haem sources (such as red meat) promote anaemia, and low intake of milk limits bone accretion; along with physical inactivity, this may enhance the later risk of osteoporosis. Salted foods high in phosphate and low in calcium and multiple daily intake of cola drinks with refined sugars limit calcium absorption or promote its excretion from bone, thereby amplifying the problem. Thus, the “junk food” habits of adolescents may have long term consequences in addition to atherogenesis.
High smoking rates and low antioxidant intakes also promote DNA damage in young men's sperm17 and may explain the enhanced risk of several cancers in their offspring. Adolescent girls entering pregnancy often have inadequate iron, folate, calcium, and n-3 fatty acids; their greater risk of premature, low birthweight babies (perhaps because they also are still growing) continues the intergenerational cycle of disease and social disadvantage.
Adults and chronic disease
Obesity, hypertension, non-insulin dependent diabetes, heart disease, stroke, and cancer were once known as the diseases of affluence but now particularly affect poor people in Britain. The links between a diet rich in saturated fat, which induces hypercholesterolaemia and coronary heart disease, have long been recognised,18 but the pathophysiology is now more complex.19 Low intakes of antioxidants, which are particularly evident in lower socioeconomic groups and in Scotland, Wales, and Northern Ireland, are now linked to atherogenesis,20 but homocysteinaemia induced by folate intakes below 400 μg/day is also an independent risk factor for coronary heart disease, stroke, and peripheral vascular disease. The low intakes of folate, ß carotene, and vitamin C of the lower socioeconomic groups promote cardiovascular disease, but the trans fatty acids from hydrogenated margarines also contribute to thrombosis and atherogenesis21 and lower birth weights.22 The higher salt intakes of the lower socioeconomic groups amplify blood pressure levels and the risk of stroke, and poor fruit and vegetable consumption reduces potassium intake. The long chain polyunsaturated n-3 fatty acids; fish such as herring, sardines, and salmon; and nuts also limit sudden death from cardiac arrhythmia.23
Chronic diseases of affluence
Abdominal obesity, indicated by waist measurement, is more prevalent in women (but not men) in lower socioeconomic groups in Britain24; elsewhere–Sweden and the United States–there are clear social class differences in men and women.25 This measure is associated with cortisol surges related to stress26 and perhaps to fetally induced changes in the hypothalamic-pituitary-adrenal axis.27 Obesity is also associated with a greater risk of a range of other health problems, including diabetes, hyperlipidaemia, some cancers, breathlessness, menstrual disturbances, pregnancy complications, back pain and arthritis, skin disorder, and varicose veins.28 The causes of obesity are complex and include lack of exercise and a high fat, energy dense diet.
Mortality from all cancers is higher in lower socioeconomic groups, though breast cancer and bowel cancer are more prevalent in higher socioeconomic groups.29 While a diet high in fibre, vegetables, and fruit and low in meat and fat seems to be protective, other factors affecting risk are smoking, alcohol, and exercise. There is also clear evidence that survival from breast and colon cancer is positively related to socioeconomic status, but the relation to diet remains uncertain.
Elderly people
Old people at home are particularly vulnerable to a poor diet, and they are also at risk in hospitals and residential homes, where a lack of resources and staff time means that they do not always get well fed. Malnutrition leads to lower physical strength, greater inactivity, a higher risk of accidents, a weaker immune system,30 and osteoporosis. Poor vision, macular degeneration, and cataracts are all also now being linked to diets low in fruits and vegetables and antioxidants.31
Conclusion
Diet affects the health of socially disadvantaged people from the cradle to the grave. The social and economic reasons are complex, but the potential for health gain through improved diet is enormous. A poor quality diet, physical inactivity, and smoking are a lethal triad for the lower social classes, leading to an intergenerational spiral of ill health and handicap. Modern nutritional and sociological research is now providing a basis for targeted action to reverse this cycle.