Analysis from inner London of deprivation payments based on enumeration districts rather than wards
BMJ 1995; 311 doi: https://doi.org/10.1136/bmj.311.7008.787 (Published 23 September 1995) Cite this as: BMJ 1995;311:787
- Tim Crayford, senior registrara,
- John Shanks, consultant in public health medicineb,
- Madhavi Bajekal, research fellow.b,
- Stephen Langford, director of commissioning for primary and community servicesb,
- Madhari Bajekal, research fellowc
- a Department of Public Health, King's College Hospital, London SE5 9RS
- b Lambeth, Southwark, and Lewisham Health Commission, London SE1 7NT
- c Department of Primary Care and General Practice, St Mary's Hospital Medical School, London W2 1PG
- Correspondence to: Dr Crayford.
- Accepted 20 August 1995
Abstract
Objective: To estimate the effect of calculating the Jarman index using the smaller geographical unit of the census enumeration district on the changes in deprivation payments made to general practitioners. The Jarman index, or underprivileged area score, is used to calculate the allowance that general practices in the United Kingdom receive for each patient registered with them who lives in an area of relative social deprivation. Current values of the Jarman score are derived from the 1981 census and are based on electoral wards. The change in payments to some practices brought about by using data from the 1991 census may cause severe financial hardship.
Design: Jarman indices for wards and enumeration districts from the 1981 and 1991 censuses were used to calculate the payments made to 169 practices in Lambeth, Southwark, and Lewisham; the changes in payments under ward and enumeration district based schemes were then compared.
Main outcome measures: Standard deviations of the changes in payments to practices. Extreme values of changes in payments.
Results: The standard deviation of the change in payment between the two censuses was £6365 with the enumeration district Jarman index, whereas it was £9452 under the ward based scheme. If the ward based scheme is used 10 practices would find their payments changed by over £20000, whereas only two practices would have changed by more than this amount under the scheme based on enumeration districts.
Conclusion: The Jarman index could be more sensitively and appropriately applied to calculate the deprivation payments that practices receive using the census enumeration district as its unit for calculation. This would result in fewer precipitate changes in payments when census data change every 10 years.
Soon many general practices in England and Wales will find themselves considerably richer or poorer when the Department of Health starts to use data from the 1991 census to calculate the Jarman scores on which deprivation payments are based. The differences that will come about can be substantial: some practices in inner London will have up to £40000 difference (less or more) in yearly income. Such a large change may make the difference between financial viability and non-viability. In this article we discuss (a) the effect of using data from the latest census based on wards and (b) the impact of using a smaller geographical unit, the enumeration district, to allocate payments.
Jarman score
A general practice may currently qualify for additional deprivation payments on the basis of the Jarman score of the electoral wards in which registered patients live. The Jarman underprivileged area score (UPA8) was introduced in 1983 and is a composite measure of eight factors derived from census data. Although the Jarman score is often described and used as if it were a measure of social deprivation, it is, in fact, related to general practitioners' perceptions of the census factors that most affect their workload.1 The Department of Health currently sets three bands of deprivation payment corresponding to Jarman scores of 30, 40, and 50. Each patient residing in an electoral ward with a Jarman score between 30 and 40 attracts an additional annual payment of £5.85, which increases to £10.20 for each patient residing in an electoral ward with a Jarman score of 50 or more. A large practice in a deprived area may attract payments of up to £150000 a year.

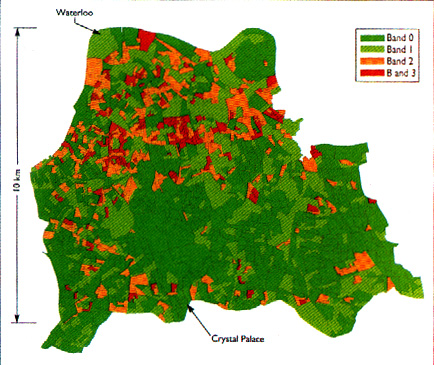
Jarman index for enumeration districts in Lambeth, Southwark, and Lewisham in 1991
Problems with moving to 1991 census data based on wards
It would be unjust for practices to continue to be remunerated on the basis of characteristics of their local community as it was 14 years ago. In Lambeth, Southwark, and Lewisham, however, the1991 census will mean that around 5% of the 169 practices will experience a deficit in income of between £11000 and £38000 as a result of wards moving from one band down to the next. This change may make some practices financially non-viable. Some form of transitional arrangement is clearly required, and it is the Department of Health's intention that this should be so.

An affluent Georgian square in a highly deprived ward in south east London. Should general practitioners who care for the residents here receive additional payment?
Pockets of deprivation and affluence
Under the current system, payments are calculated on the basis of wards and some patients live in deprivation in wards whose Jarman index may be low and not attract any payments whatsoever while others live in pockets of affluence in otherwise deprived wards. Were payments to be based on the smaller geographical unit, the enumeration district (around 500 people or 150 residences), this would ensure, for example, that people who lived on a small deprived estate within an otherwise affluent ward would attract payment while people who lived in an affluent Georgian square in an otherwise deprived ward would not.
Indeed, Jarman contended in his original article that the enumeration district would be the most preferable unit for analysis of the underprivileged area score.1 These calculations were impossible at the time because patient lists were not held on computer by family practitioner committees. Patient lists have now been computerised for some years and so can be used to calculate the index for practices in enumeration districts. We calculated Jarman scores from the lists of patients at Lambeth, Southwark, and Lewisham Health Commission by means of a Pentium P90 PC and the SAS system with Windows 3.11.2 The figure shows the results.
One reason often cited against the introduction of schemes based on enumeration districts is that the Jarman index is less stable in enumeration districts than in wards. Although this is true, the way that an index based on enumeration districts is used for payments means that several thousand of these estimates are summed for each practice. This makes this system of payments more stable than that based on wards.
We have found that this is the case by modelling the effect of the change in payments between the 1981 and 1991 censuses for both systems. When we used enumeration districts the standard deviation of the difference between the 1981 and 1991 census was £6365 in Lambeth, Southwark, and Lewisham as a whole, whereas when we used wards it was £9452. The lower standard deviation with enumeration districts means that four of the five practices that would experience the largest loss would have a deficit of under £20000, whereas under the ward based scheme all five would have lost more (table).
Largest losses £ caused by moving from 1981 to 1991 census data according to payments based on wards and enumeration districts
Problems with analyses based on enumeration districts
Arguments against the move towards using the finer detail of an analysis based on enumeration districts include the problem of the greater technical complexity of the calculations and the greater variability between small populations both geographically (at any one point in time) and chronologically as the census information becomes increasingly out of date. The problem of technical complexity is not a great challenge today: for some years deprivation payments in Scotland have been based on enumeration districts. In addition, we have completed the necessary calculations with little difficulty at this health commissioning agency. The greater variability of populations in small areas is a feature of true life in general practice and one which an NHS led by primary care3 should be prepared to embrace.
Other measures
The Jarman score has been criticised both as a basis for reimbursing practices for the increase in workload resulting from deprived populations and as a basis for the planning of health services.4 5 6 7 Although other investigators have developed alternative and possibly more appropriate indices,8 for the moment, however, the Jarman score should be used in a way that reflects as closely as possible the reality of general practice as a local enterprise experiencing the full effect of variations from street to street.
When the resolution of television transmissions increased from 402 to 625 lines per inch in the 1960s the quality of pictures improved dramatically. Similarly, family practitioner records now have computerised postcodes and the Department of Health should use this fact to deliver a more sensitive weighting for deprivation that adequately reflects the detailed structure of the societies practices serve.