Article Text

Abstract
Aims: To measure the prevalence of visual impairment in a large representative sample of people aged 75 years and over participating in the MRC trial of assessment and management of older people in the community.
Methods: 53 practices in the MRC general practice research framework. Data were obtained from 14 600 participants aged 75 years and older. Prevalence of visual impairment overall (binocular visual acuity <6/18) which was categorised separately into low vision (binocular visual acuity <6/18–3/60) or blindness (binocular visual acuity of <3/60). The prevalence of binocular acuity <6/12 was presented for comparison with other studies. Visual acuity was measured using Glasgow acuity charts; glasses, if worn, were not removed.
Results: Visual acuity was available for 14 600 people out of 21 241 invited (69%). Among people with visual acuity data, 12.4% overall (1803) were visually impaired (95% confidence intervals 10.8% to 13.9%); 1501 (10.3%) were categorised as having low vision (8.7% to 11.8%), and 302 (2.1%) were blind (1.8% to 2.4%). At ages 75–79, 6.2% of the cohort were visually impaired (5.1% to 7.3%) with 36.9% at age 90+ (32.5% to 41.3%). At ages 75–79, 0.6% (0.4% to 0.8%) of the study population were blind, with 6.9% (4.8% to 9.0%) at age 90+. In multivariate regression, controlling for age, women had significant excess risk of visual impairment (odds ratio 1.43, 95% confidence interval 1.29 to 1.58). Overall, 19.9% of study participants had a binocular acuity of less than 6/12 (17.8% to 22.0%).
Conclusion: The results from this large study show that visual impairment is common in the older population and that this risk increases rapidly with advancing age, especially for women. A relatively conservative measure of visual impairment was used. If visual impairment had been defined as visual acuity of <6/12 (American definition of visual impairment), the age specific prevalence estimates would have increased by 60%.
- visual impairment
- blindness
- prevalence
- elderly
Statistics from Altmetric.com
Visual impairment and blindness are common in older people. There have been a number of population based studies conducted in Britain and in other European populations in North America and Australia.1–12 Several of these studies were small and many investigated people aged 40 years and above. There is little information on the prevalence of visual impairment and blindness in people aged 75 years or more with particularly limited data for people aged 90 years and older.
As part of the assessment of the health of older people in the MRC trial of the assessment and management of older people in the community, a visual acuity screening test was conducted by trained nurses in a representative group of almost 15 000 people aged 75 years and older recruited from general practices in Britain (England, Scotland, and Wales).
METHODS
The MRC trial of the assessment and management of older people in the community
This is a large cluster randomised trial taking place in 106 general practices from the Medical Research Council general practice research framework. The practices in the study were selected to be representative of the mortality (standardised mortality ratio, SMR) and Jarman scores of general practices in Britain. The aim of the trial is to compare the cost effectiveness of different methods of assessment and management of older people in the context of the 1990 contract of service which required general practitioners to offer an annual health check to patients aged 75 years and over. The study is comparing two different types of multidimensional assessment (targeted versus universal) and two different management models (primary care team versus multidisciplinary geriatric evaluation team). Randomisation was at the practice level and stratified by SMR and Jarman score. All patients aged 75 years or over on the general practitioner list were invited to participate in the trial, unless they were in long stay hospital or nursing homes, or were terminally ill. People in the 53 practices allocated to the universal arm of the trial were given a visual acuity test as part of a detailed health assessment by the practice nurse.
The trial was approved by the relevant local research ethics committees.
Measurement of visual acuity
Visual acuity was measured at 3 metres with a Glasgow acuity chart which measures the minimal angle of resolution on a logarithmic scale (logMAR).13 This chart was originally developed for use in children but has been shown to give equivalent measurements to the Bailey-Lovie chart in adults14 and has been used in other surveys in the elderly.4 This chart was chosen because it met the requirements for a simple visual screening test to be conducted in general practice and as part of the over 75s health check. As well as applying modern scientific principles to the measurement of visual acuity, it was cheap and portable. The nurses also could use the chart on home visits.
Binocular vision was measured first, followed by vision in the right and left eyes. People with a vision of 0.5 or more in either eye (equivalent to less than 6/18 Snellen acuity) were tested again using a pinhole occluder. Everyone with a pinhole vision of 0.5 or more in either eye was referred to an ophthalmologist by the general practitioner. People whose vision improved from 0.5 or more to less than 0.5 were advised to see an optician. All vision measurements were conducted while wearing usual spectacle correction; participants were asked to bring their glasses with them.
All patients were also asked about their vision and whether they were on the blind register. Study nurses attended a 2 day training session in the trial protocol which included a training session by JE/RW on how to use the chart. This included ensuring the measurement was taken as far as possible under standardised conditions at the correct distance and with optimum lighting. All nurses received regular quality control visits from a regional trainer who checked their performance against a checklist. In addition, the data were reviewed periodically and feedback given to the nurses at annual workshops and in newsletters.
Definitions of visual impairment and blindness
Visual acuity is measured on a continuous spectrum. There is considerable variation in the cut points and terminology used. The International Classification of Diseases 10th edition (ICD10) (http://www.who.int/m/topics/blindness/en/index.html, 2 accessed October 2001) defines low vision as a visual acuity of less than 6/18, but equal to or better than 3/60 in the better eye with best possible correction and blindness as visual acuity of less than 3/60 or corresponding visual field loss in the better eye with best possible correction. In this study, we have chosen binocular presenting vision to describe the level of vision that the person uses in everyday life with usual spectacle correction. Although we are not reporting best corrected vision we have used the terminology of ICD10 and the same cut points for visual acuity to describe binocular low vision and blindness. We have used the term visual impairment to include both low vision and blindness.
Our definitions are as follows. Visual impairment overall was defined as a binocular acuity of <6/18 Snellen acuity (logMAR score of 0.5 or more), low vision as a binocular acuity of <6/18 to 3/60 Snellen acuity (logMAR score 0.5–1.375), and blindness as <3/60 Snellen acuity (logMAR score of 1.4 or more—that is, could not read the Glasgow acuity chart at 1 metre). Visual acuity for the better eye was used if binocular visual acuity data were not available. In order to compare with other studies, we also calculated the prevalence of binocular acuity less than 6/12 (logMAR 0.4 or more).
Some people already registered as blind or partially sighted were not given a visual acuity test. This may be because the participant was reluctant to have a test that they knew could not confer any benefit. People who reported that they were on the blind register were counted as blind. People who reported that they were on the partial sight register were counted as low vision. Registration status was cross checked with the general practitioner medical notes.
Statistical methods
Prevalence is based on the numbers of people with visual impairment, low vision, or blindness out of those examined. Since observations on individuals within the same general practice may be correlated, all analyses took account of the clustering effect in the estimation of standard errors and p values.13 We also performed logistic regression analyses examining the association between risk of visual impairment and age and sex, accounting for the effect of the clustering.15,16 All analyses were done using stata versions 6.0 and 7.0.
RESULTS
Data collection began in April 1994 and finished in November 1999; the majority of assessments (99.7%) were done between 1995 and 1998.
Location of study practices
Figure 1 shows the location of the practices taking part in the trial. The distribution of the study practices reflects the population density of Britain with the majority of practices located in the major conurbations. However, there are a good number of rural practices and a spread of practices from north to south and east to west of the three countries of Britain.

Location of practices participating in the MRC trial of the assessment and management of older people in the community.
Response
Figure 2 shows a profile of the study. There were 42 278 eligible people in the 106 practices enrolled in the study. In the universal arm of the study, there were 21 241 eligible people in 53 general practices. Of these, 15 126 (71%) had a detailed assessment. People taking part in the study were of a similar age (median age 80.3, interquartile range 77.2–84.2) to those not taking part (median age 81.0, interquartile range 77.7–85.2). There was an increased non-response with age; 25.5% of the 75–79 age group did not take part in the study, compared to 39.5% of people aged 90 years and older (p<0.0001). Women were less likely to take part than men—25.4% of men did not take part compared to 30.7% of women (p<0.0001).

Study profile.
Not everyone given a detailed assessment participated in a visual acuity test. Out of 15 126 detailed assessments 699 people did not have a vision test; 173 of these were registered blind or partially sighted and are therefore counted in our measure of visual impairment. A total of 526 (3.5%) people, therefore, did not have any information on their vision, even though they had been seen by the nurse and had received some of the detailed assessment. These people were older (median age 83.3, interquartile range 79.1–87.9) and were more likely to be women (69% v 62%, p=0.0004). In addition, they were more likely to require a person to help with the interview—22% of people with a totally or partly proxy interview had missing data on vision compared to 3% of people who completed the interview unaided (p<0.0005).
Prevalence of visual impairment and blindness
Table 1 shows the prevalence of all visual impairment, and separately for low vision and blindness by age and sex. A total of 1803 (12.4%) people were counted as visually impaired. Of these, 229 people were counted as visually impaired on the basis of self reported registration status alone. The visual status of these people was checked by examining the general practitioner notes, hospital consultant form, and detailed assessment carried out by the nurse: 172 were confirmed to be registered from general practitioner notes; 15 were confirmed to be visually impaired from general practitioner notes or from hospital questionnaire; 25 had other comments from the nurse at the detailed assessment indicating that they could not see; 16 reported glaucoma; and one person was unclear but on balance was considered to be visually impaired.
Prevalence of visual impairment, low vision, and blindness
The prevalence of low vision increased sharply between the ages 75–79 and 90+. At ages 75–79, 5.6% of the cohort had low vision (95% confidence interval 4.5% to 6.6%) and at ages 90+, 30.0% (25.8% to 34.1%). Women had a higher prevalence of low vision than men in all age groups.
The prevalence of blindness also showed a dramatic increased risk with increasing age. At ages 75–79, 0.6% of the cohort were blind (95% CI 0.4% to 0.8%). At ages 90+ 6.9% were blind (4.8% to 9.0%). Women had a marginally increased risk at all ages.
At ages 95+ (n=119, data not shown on the table), the prevalence of visual impairment was 48.7% (95% CI 38.8% to 48.7%), the prevalence of low vision was 38.7% (28.2% to 49.1%) and the prevalence of blindness was 10.1% (4.2% to 16.0).
Table 2 gives the results of logistic regression models showing the association between age, sex, and visual impairment. People in the 90+ age group had markedly increased odds of being visually impaired or blind (odds ratio 8.88 and 11.84 respectively) compared to people aged 75–79. Women were at a 67% increased risk compared to men, which was only slightly attenuated after controlling for age. In models looking at blindness alone, the association with sex was not as marked and no longer remained statistically significant after controlling for age.
Risk of visual impairment and blindness by age and sex
Using other definitions of visual impairment
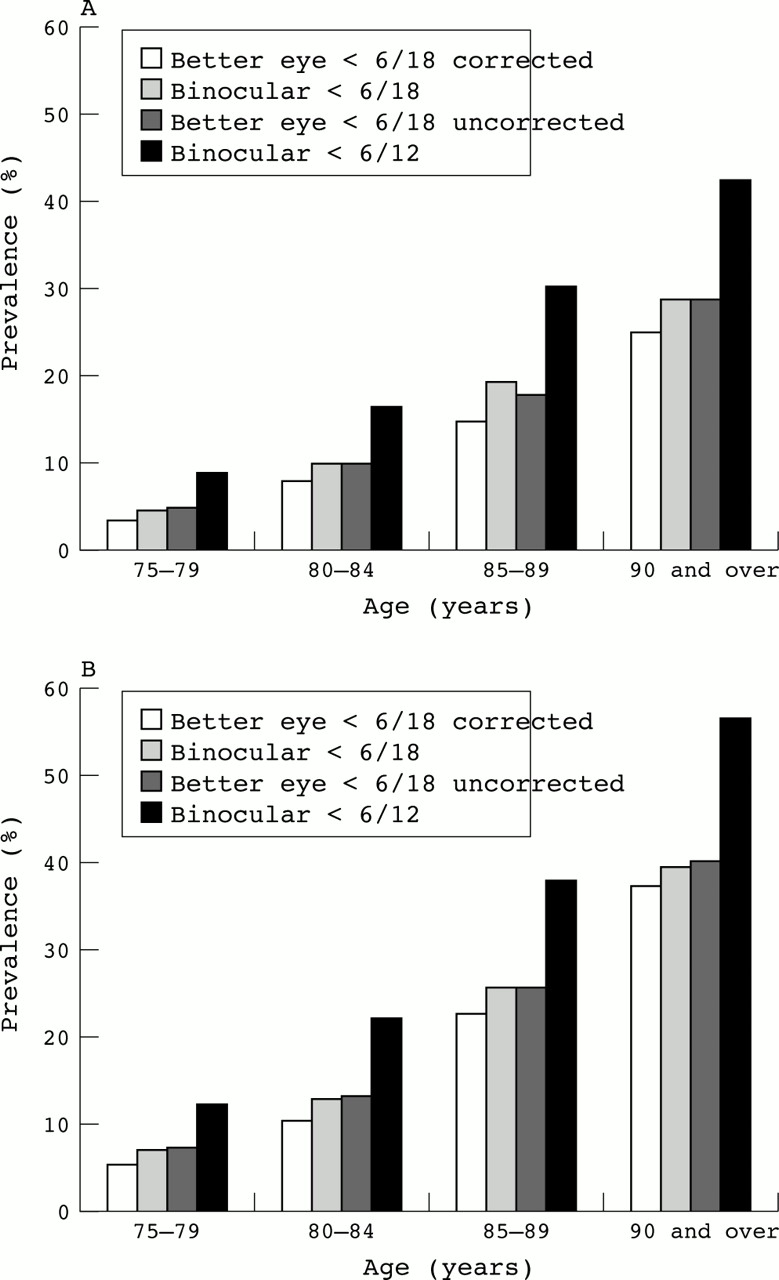
Table 3 shows the prevalence of binocular acuity less than 6/12. Overall, 19.9% (17.8% to 22.0%) had a binocular acuity less than 6/12. As for other measures of visual impairment this increased with increasing age: 53.1% of people aged 90 or more had a binocular acuity of less than 6/12. Figure 3 shows the results using four different ways of defining visual impairment. The graph shows that the definition of binocular visual acuity less than 6/18 as a measure of visual impairment is a conservative one.
Prevalence of binocular acuity <6/12

Comparison of different measures of visual impairment. Better eye <6/18 corrected, visual acuity less than 6/18 in better eye, with pinhole if used, or without pinhole if not. Binocular <6/18, binocular visual acuity less than 6/18; better eye <6/18 uncorrected, visual acuity less than 6/18 in better eye without pinhole. (A) men, (B) women.
The study protocol required that everyone with visual acuity less than 6/18 receive a pinhole test. However, use of the pinhole was not straightforward in this elderly population and only 62% of people with visual acuity less than 6/18 in either eye completed a pinhole test satisfactorily. The graph shows that using the pinhole removed some of the refractive error as a cause of visual impairment in our population. The prevalence of pinhole corrected acuity of less than 6/18 in the better eye was 10.2%.
DISCUSSION
We have presented the results of visual acuity testing in a large cohort of older people selected to be representative of the British population. Our results confirm that visual impairment is common in this age group and that the risk of visual impairment including low vision and blindness increases steeply in these older age groups. It is common to summarise the health experience of people over 65 or over 75 years of age. These summary figures hide a dramatically increased risk of visual impairment and blindness in people aged over 90 years.
Using mid-2001 population estimates for the United Kingdom (http://www.gad.gov.uk/population/1998/pop5yearuk98-08.html, accessed 14 August 2001) we estimate that there are approximately 506 000 people living in the community with low vision (<6/18–3/60) in the UK (95% CI 407 000 to 605 000) of whom 128 000 (104 000 to 148 000) are over 90 years old and 103 000 blind people (68 000 to 140 000) of whom 29 000 (18 000 to 40 000) are over 90 years of age. As women experienced higher levels of visual impairment and also make up a larger proportion of the elderly, the majority of the burden of visual impairment in this age group is borne by women. Out of the estimated 609 000 people visually impaired (binocular acuity <6/18), 453 000 (74%) are women.
We have focused on presenting vision—that is, visual acuity as used in everyday life by the people taking part in the MRC trial. This measure of visual impairment is the most relevant for public health purposes. It is often usual in eye surveys to present visual impairment after correction for refractive error. We had some limited data on refractive error in our population through the use of the pinhole test. However, we found that the pinhole was not easily used in this population, with nearly 40% of visually impaired people not having a pinhole test. This fact must be borne in mind when comparing the results of this study with other population based studies (Table 4). Studies using refraction to correct for refractive error consistently estimate a lower prevalence of visual impairment.
Comparison with other population based studies on prevalence of visual impairment and blindness in the United Kingdom and comparable populations in North America, Europe, and Australia
The most recent study of visual acuity in the British population was a sample of 1362 participants aged 65 years and older taking part in the National Diet and Nutrition Survey (NDNS), which estimated the prevalence of visual impairment (<6/18) to be 12%.4 This is comparable to our estimate of 12.4%. The NDNS sample, however, included people resident in nursing homes who had a higher prevalence of visual impairment. Reidy et al, in a study of 1547 people aged 65 years and above in north London,3 found that 30% of their sample had bilateral visual acuity worse than 6/12. This is considerably higher than in our sample, where 19.9% of people 75 years and above had a binocular acuity worse than 6/12 (95% CI 17.8% to 22.0%). Either these differences can be attributed to different methods used in the surveys or they may occur as the result of studying only one geographical location. Our study sample was drawn from a national framework of general practices and our results were more similar to the NDNS survey which sampled from 80 different randomly selected postcode sectors in Britain.
Studies of vision in the British population tend to report higher levels of visual impairment than studies in equivalent populations in other part of Europe, North America, and Australia. Part of this can be attributed to different methods, particularly the emphasis on best corrected acuity and use of subjective refraction in studies in other countries. However, in the Salisbury Eye Evaluation project, approximately 9% of white participants aged 75–84 years had presenting acuity worse than 6/12 in the better eye.9 This compares with 15% of people aged 75–84 in the MRC trial having a binocular acuity worse than 6/12. These differences may reflect differences in study methods and/or in use of services, especially cataract services.
We found a significant increased risk of visual impairment in women, which agrees with the results of a recent meta-analysis showing an odds ratio for women of 1.63 for industrialised countries.17 It is not clear whether this excess in women represents differences in the aetiology of conditions causing vision impairment (for example, age related macular degeneration) or differences in access and use of services (for example, cataract surgery).
There are several reasons why the prevalence estimates from this study are likely to underestimate the prevalence of visual impairment in older people.
-
Other studies have shown that visual field loss can contribute considerably to the overall burden of visual impairment and blindness, with nearly three times as many people visually impaired because of visual field loss than visual acuity loss.12 We included people who had good central visual acuity but who were registered blind or partially sighted because of visual field loss. It is likely, however, that we have underestimated the level of visual impairment because we did not measure visual fields.
-
People in long term nursing care were excluded. Other studies have shown a high prevalence of visual impairment in nursing homes.4,7,11 For example, in people aged 85 years and older taking part in the NDNS study,4 30% of those living in the community were visually impaired (<6/18) compared to 47% of those living in residential nursing homes.
-
Older people and women were less likely to be examined. The prevalence of visual impairment is higher in these groups.
Our results, from the largest and most representative study of visual acuity of older people in the British population, show that more than one in 10 of the older population, rising to one in three of those over 90, suffer from significant vision impairment and highlights the need for prompt attention to the ophthalmic needs of this group. Whether a policy of systematic screening for vision impairment in general practice can result in improved vision outcomes is currently being tested by a nested trial within the main trial (http://www.lshtm.ac.uk/eph/eu/).
Acknowledgments
The MRC Trial of the Assessment and Management of Older People in the Community is funded by the United Kingdom Medical Research Council, the Department of Health and the Scottish Office. Jennifer Evans received support from the Gift of Thomas Pocklington. Liam Smeeth is funded by a research fellowship from London NHS Executive.
We would like to thank the following people: Lesley Wright and Barry Winn for help with the Glasgow acuity cards; clerical staff; Rakhi Kabiwala and Jabibi Mazar at London School of Hygiene and Tropical Medicine and Ruth Peters at Imperial college; Amina Latif (Research Officer) Elaine Stringer (Clerical Officer) (University of Wales College of Medicine) for administrative assistance; the nurses, GPs, other staff, and the patients in the participating practices; everyone at the MRC General Practice Research Framework coordinating centre, particularly Jeannett Martin and Nicky Fasey; the MRC Trial Steering Committee (chair: Professor Sir John Grimley Evans) for guidance and support throughout the study.