Article Text

Abstract
AIM To describe predictors of mortality in the 5 year follow up of the Melbourne Visual Impairment Project (VIP) cohort.
METHODS The Melbourne VIP was a population based study of the distribution and determinants of age related eye disease in a cluster random sample of Melbourne residents aged 40 years and older. Baseline examinations were conducted between 1992 and 1994. In 1997, 5 year follow up examinations of the original cohort commenced. Causes of death were obtained from the National Death Index for all reported deaths.
RESULTS Of the original 3271 participants, 231 (7.1%) were reported to have died in the intervening 5 years. Of the remaining 3040 participants eligible to return for follow up examinations, 2594 (85% of eligible) did participate, 51 (2%) had moved interstate or overseas, 83 (3%) could not be traced, and 312 (10%) refused to participate. Best corrected visual acuity <6/12 (OR=2.34) was associated with a significantly increased risk of mortality, as were increasing age (OR=1.09), male sex (OR=1.62), increased duration of cigarette smoking (OR=2.06 for smoking >30 years), increased duration of hypertension (OR=1.51 for duration >10 years), and arthritis (OR=1.42).
CONCLUSIONS Even mild visual impairment increases the risk of death more than twofold. Further research is needed to determine why decreased visual acuity is associated with increased risk of mortality.
- mortality
- vision impairment
- Melbourne Visual Impairment Project
Statistics from Altmetric.com
A number of studies have shown an association between age related eye conditions and increased mortality.1-14 In particular, it has been suggested that cataract, especially nuclear cataract, or cataract surgery may be markers for ageing. In the Beaver Dam Eye Study, people with visual acuity <6/12 were 1.57 times as likely to die in the following 5 years.9
The Melbourne Visual Impairment Project (VIP) was a population based study of the distribution and determinants of age related eye disease in a representative sample of Melbourne residents aged 40 years and older. Baseline examinations were conducted between 1992 and 1994. We have shown previously that the 83% of eligible residents who chose to participate did not differ significantly in any factors that would probably lead to a bias in the estimate of prevalence estimates.15 In 1997, 5 year follow up examinations were commenced to determine the incidence of age related eye conditions and risk factors associated with those eye diseases in the Melbourne VIP cohort (Fig 1).

Status of Melbourne Visual Impairment Project participants at 5 year follow up.
The purpose of this study was to identify the predictors of 5 year mortality in our cohort of non-institutionalised adults.
Methods
Details of the methodology employed for the baseline Melbourne VIP examinations have been published previously.16 Briefly, cluster random sampling was employed to identify nine pairs of census collector districts in the Melbourne statistical division from which to recruit eligible residents. Eligible adults were defined as people aged 40 years and older who had been resident in their homes for at least 6 months. A household census was conducted to identify the eligible residents, collect basic demographic information, and invite the eligible residents to attend the local examination centres. The standardised examinations lasted approximately 90 minutes and included presenting and best corrected visual acuity, reading vision, Humphrey visual fields, intraocular pressure, personal health and health related habits interview, clinical ophthalmic examination, and photography of the lens and fundus. The Wilmer lens grading scheme was used17 and cataract was defined as ⩾4/16 cortical opacity, ⩾nuclear standard 2.0, or ⩾1 mm2 posterior subcapsular opacity. Glaucoma diagnosis was determined by a consensus of glaucoma experts after review of intraocular pressure, visual fields, and optic discs.18 Age related maculopathy was graded from fundus photographs according to the international classification.19 The protocol was approved by the human research and ethics committee at the Royal Victorian Eye and Ear Hospital.
Five year follow up examinations commenced in 1997. In 1996, letters were mailed to each of the 3271 people who participated at baseline. These letters contained information about some of the baseline results and alerted them to the fact that 5 year follow up examinations would commence in 1997. Before the commencement of the 5 year follow up examinations at each of the nine test sites, information sessions were held to again inform the participants of the baseline results and to tell them what to expect from the follow up examinations. Again, recruiters contacted each of the original participants to organise convenient appointment times for them, including nights and weekends where necessary. Information about contact people that was provided by the participants at baseline was used to locate people who had moved and to identify those people who had died in the intervening 5 years. If necessary, people were examined in their homes or nursing homes. Interpreters were provided if needed.
Confirmation and causes of death were obtained from the National Death Index, which is maintained by the Australian Institute for Health and Welfare in Canberra. After providing the National Death Index with a list of names and associated age and last known address for the participants that were suspected of having died, researchers at the National Death Index provided a corresponding list of “matched” deaths. They provide a list of causes of death, when known, for individuals who are matched by name, year of birth, and year of death. The matches are assigned a probability of being the same person from the list provided to them.
Interview data were entered directly into a Paradox computer package with consistency checks built in. All other data were entered twice and verified. Statistical analyses were conducted with sasversion 6.0. Pearson's χ2 analyses were used to identify univariate predictors of participation and mortality for categorical variables and Mantel–Haenszel χ2 analyses were used for ordinal variables. Multivariate logistic regression analyses were used to identify independent predictors of participation and 5 year mortality. Survival analyses were conducted with the Wilcoxon test for statistical significance of the survival curves. A p value less than 0.05 was considered to be statistically significant.
Results
At baseline, the VIP cohort was 54% female and ranged in age from 40 to 98 years, with a mean of 59 years. Of the original 3271 participants, 231 (7.1%) were reported to have died in the intervening 5 years. Forty nine (21%) of the deaths could not be confirmed from the National Death Index. Country of birth was significantly related to confirmation of death by the death registry. The percentage of deaths confirmed by the death registry varied by country of birth. It was 86% for Australian born, 78% for British born, 74% for others, 90% for Italians, and 29% for Greeks (χ2, 4 df = 27.2, p value=0.001). The people whose deaths were confirmed by the death registry were not significantly different from those whose deaths were not confirmed by the death registry in terms of age, sex, cortical cataract, nuclear cataract, posterior subcapsular cataract, cataract surgery, age related maculopathy, glaucoma, diabetes, high blood pressure, arthritis, gout, or cardiovascular disease (all p>0.10, data not presented).
Of the remaining 3040 participants eligible to return for follow up examinations, 2594 (85% of eligible) did participate, 51 (2%) had moved interstate or overseas, 83 (3%) could not be traced, and 312 (10%) refused to participate. The time between baseline and follow up examinations ranged between 4 and 7 years (mean 4.5 years, SD 0.64, median 4 years). The mean age of the participants at follow up was 62.5 years (10.9, 44–101) and 1421 (55%) were female.
Factors significantly related to participation at follow up in the 3040 eligible residents were evaluated. Sex was not significantly related to participation, even at the univariate level (data not presented). The vision related outcomes, such as cataract, glaucoma, and decreased visual acuity, were also not significantly related to participation (data not presented). The only factors related to participation that remained in the multivariate model were age, country of birth, and language spoken at home. Non-English speakers and people born in Greece, Malta, or Cyprus were significantly less likely to participate. Age only just reached statistical significance in the multivariate model (p=0.04) and all of the 10 year age groups had participation rates of at least 83%.
Predictors of mortality during the 5 years were evaluated in the cohort (Table 1). Non-participants were not included in these analyses. Variables that were not significantly related to mortality included uncorrected refractive error, language spoken at home, PSC cataract, self reported mental conditions, and alcohol intake at baseline (all p>0.05, data not presented). Significant univariate predictors of mortality included age, sex, country of birth, cigarette smoking, duration of high blood pressure, arthritis, best corrected visual acuity <6/12, cortical cataract, nuclear cataract, previous cataract surgery, ARM, glaucoma, diabetes, gout, and cardiovascular disease. All of these variables that were statistically significant in the univariate χ2 analyses were entered into a logistic regression model. Increasing age, male sex, increased duration of cigarette smoking, increased duration of high blood pressure, arthritis, and best corrected visual acuity <6/12 were all associated with a significantly increased risk of mortality in the multivariate model.
Predictors of 5 year mortality in the Melbourne VIP cohort
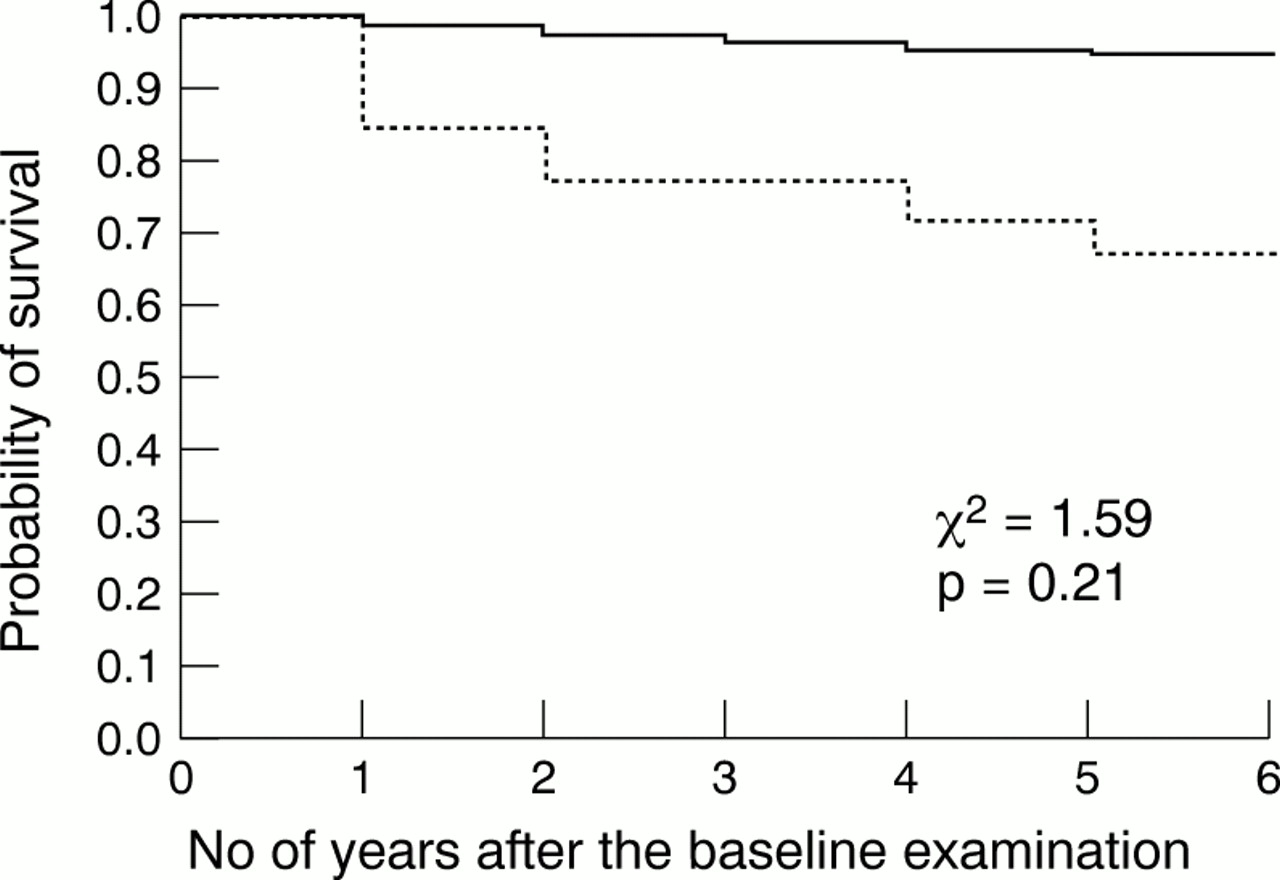
Life table analyses were conducted to explore further the relation between decreased visual acuity and mortality (Fig 2). Year of death, which is necessary for these time dependent analyses, was available for 182/231 (79%) participants who had died. Although not statistically significant over the time period because of relatively small number of deaths at each time point, the probability of survival at each time point was less for people with best corrected visual acuity <6/12 (χ2=1.59, p=0.21). These analyses were adjusted for age and sex, but not for other variables because of the relatively small number of deaths.

Age and sex adjusted survival curves by level of best corrected visual acuity. Broken line = < 6/12; solid line = ⩾ 6/12.
The potential relation between other levels of vision impairment (<6/6, <6/9, <6/18, <6/60), and mortality was investigated to determine if a linear trend was evident (Table 2). Although all levels of visual acuity <6/6 were associated with an increased 5 year mortality, only the visual acuity category of <6/6 to ⩾6/9 was statistically significant.
Relation of best corrected visual acuity to 5 year mortality in the Melbourne Visual Impairment Project
Causes of death were compared between people with vision 6/12 or better and people with best corrected visual acuity <6/12 (Table 3). Although deaths in the “other” category, including accidents and suicides, were higher in the people with best corrected visual acuity <6/12, this finding was not statistically significant owing to relatively small number of deaths in the people with decreased visual acuity.
Causes of death by baseline best corrected visual acuity
The potential relation between cataract and mortality was investigated further by using a more conservative and a more lenient definition of cortical and nuclear cataract. In none of the four additional multivariate analyses was cataract significantly related to mortality (data not presented).
All of the analyses were repeated after excluding the deaths that could not be confirmed. None of the results changed (data not presented).
Discussion
We found that decreased visual acuity was associated with increased 5 year mortality. This is consistent with the findings of a study reported in 19662 and with the univariate findings of the Beaver Dam Eye Study.9 It is plausible that people with vision impairment have increased mortality for a number of reasons. Researchers have shown previously that people with vision impairment are significantly more likely to use healthcare services,2021 three times more likely to use regular support services provided by the municipality,22 and six times more likely to be unable to go out alone.22Additionally, poorer visual function is associated with increased falls23 and decreased visual acuity is associated with an increased risk of car accidents.24 All of these factors could lead to increased mortality in people with vision impairment. Although the distribution of causes of death was not different between the two groups as a result of a lack of statistical power, there is some evidence that people with decreased visual acuity were more likely to die as a result of other causes, including accidents. Further data and larger numbers would be needed to confirm this potential association.
Several studies have found a positive association between nuclear opacities and mortality,489111314 particularly in people with diabetes.4891113 Many of these researchers have speculated that lens opacities are a biological marker for ageing. We did not find an association between any cataract type and mortality. Similarly, a recent report from the Physicians' Health Study25 revealed no association between a self reported history of cataract and mortality.
A number of studies have also found increased mortality rates among people who have undergone cataract extraction.35691013 Although we find an increased mortality rate in univariate analyses for people who had undergone cataract surgery, this finding was not statistically significant in our multivariate analyses.
A study reported in the 1960s showed an association between glaucoma and age specific mortality.1 No such association between glaucoma and mortality was seen in the recently conducted Beaver Dam Eye Study.9 More recently, high intraocular pressure and glaucoma treatment were found to predict decreased life expectancy in the Framingham Eye Study cohort.12 We did not find a relation between glaucoma or intraocular pressure and mortality in multivariate analyses.
In the over 65 year age cohort, there is evidence of a j-shaped curve for the relation between alcohol consumption and mortality, with moderate levels of alcohol consumption protective for mortality and larger amounts of alcohol a risk for increased mortality. This j-shaped or u-shaped curve for alcohol consumption and mortality risk has been demonstrated previously.26
Smoking is a well known risk factor for mortality and has also been shown to be related to the prevalence and incidence of a number of ocular disorders, including age related macular degeneration27 and nuclear cataract.28 We found in our study that there was a linear trend between pack years of smoking and mortality.
The strengths of the Melbourne Visual Impairment Project include the sampling strategy and the high response rate which ensure that the study population is representative of Melbourne residents aged 40 years and older. The only factors found to be associated with non-participation by eligible residents in the 5 year follow up examinations were country of birth and language spoken at home. Greeks were significantly less likely to participate, although their response rate is similar to what has been reported for the overall follow up rate in a couple of other large epidemiological studies of eye disease (the Chesapeake Bay Watermen Study and the Baltimore Eye Survey). Not only were the Greeks less likely to participate, but it was also less likely that their deaths could be confirmed on the death registry. It is possible that the Greek born participants returned to Greece to die or that their relatives said that they were dead as an excuse for them not to participate. The major limitation of this study is the lack of statistical power, because of the relatively small number of deaths in the cohort, to identify differences in cause specific mortality that might account for the difference in overall mortality rates by visual acuity.
In summary, we have shown that decreased visual acuity is associated with increased mortality in our cohort. Further research is needed to explore why people with decreased vision have a higher mortality rate.
Acknowledgments
The Melbourne Visual Impairment Project was supported in part by grants from the National Health and Medical Research Council, the Victorian Health Promotion Foundation, the estate of the late Dorothy Edols, the Jack Brockhoff Foundation, the Ansell Ophthalmology Foundation, the Eye Ear Nose and Throat Research Institute, the Appel Family Bequest, and the Hugh Williamson Foundation. Associate professor Cathy McCarty is the recipient of a Wagstaff Research Fellowship in Ophthalmology from the Royal Victorian Eye and Ear Hospital.
This paper was read at the 136th Annual Meeting of the American Ophthalmological Society, Pebble Beach, CA, USA, 21 May 2000.