Article Text

Abstract
AIM To examine the influence of socioeconomic status on growth pattern in height from age 7 to 23 years.
METHODS Prospective cohort study. A total of 10 200 white singleton born children from the 1958 British birth cohort (National Child Development Study) were analysed.
RESULTS Differences in height by birth weight persisted throughout the follow up period. However, the mean differences in height between low birth weight infants (<2500 g) and adequate birth weight infants (⩾2500 g) were less notable in social classes I and II than in the lower social classes. The catching up of growth in height of low birth weight infants was also more pronounced in social classes I and II than in other social classes. That is, the mean height deficits of low birth weight infants were decreased from 2.9 cm at age 7, to 1.6 cm at age 16, and 2.5 cm at age 23; the significant difference disappeared after age 16 in social classes I and II. Although such improving tendency was more pronounced among the preterm born infants, a similar growth pattern was observed among the term infants. Such improvement was not observed in the other social classes.
CONCLUSION The growth retardation in height by birth weight can be overcome by improved social conditions and proper health care from childhood to adulthood.
- height
- low birth weight
- social environment
- longitudinal study
Statistics from Altmetric.com
It is well known that low birth weight (LBW; <2500 g) is an important risk factor for infant and childhood mortality.1LBW infants have been reported to have a tendency to remain lighter and smaller in childhood than infants born with adequate weight (ABW; ⩾2500 g).2-5 Birth weight and length are reported to be a predictive indicator for adult height.6 Short height in adulthood is a risk factor for death from cardiovascular and other diseases.7
However, there have been few studies of growth in height of LBW infants from birth to adulthood. Miller et alstudied the growth of 442 Newcastle-upon-Tyne children and found a significant correlation between birth weight and adult height, but did not describe any effect of socioeconomic factors on these relationships.8
In previous work of the 1958 British birth cohort (National Child Development Study, NCDS), Goldstein showed that, among other factors, low birth weight as well as social class influence the height of 7 year old children.9 Power et aldescribed a social class gradient of height at age 23.10However, relationships between social class and growth pattern of height up to age 23 had not been reported. In this analysis, we examine the long term effect of social class on the growth pattern of height of LBW infants from birth to early adulthood.
Methods
The NCDS is a longitudinal study of all British people born during the week of 3–9 March 1958. Following the original perinatal survey, follow up examinations were conducted by the National Children's Bureau at ages 7, 11, 16, and 23. At each examination, a wide range of information was collected from parental interviews, medical examinations, school questionnaires, attainment tests, and personal questionnaires.11 ,12
Heights were measured at ages 7, 11, and 16. Height at age 23 was self reported. Birth weight was measured at birth. Gestational age was collected at birth. The gestational data were used as a dichotomous variable after division by preterm (<37 weeks) and term (⩾37 weeks) birth. Information on the father's occupation was collected by questionnaire at the time of birth. Social class was coded by father's occupation according to the Registrar General's Classification.13 The social classes are constituted as follows: social class I, professionals; II, intermediate; IIINM, skilled non-manual; IIIM, skilled manual; IV, partly manual; and V, unskilled manual.
The present analysis is confined to white, singleton born infants. Data were analysed using the statistical package SPSS-X. A linear regression model was fitted to adjust height for the exact age as described by Goldstein.9 Height deficit of LBW children at each age was calculated as follows:  F tests and t tests were used to evaluate the significance level. Separate analyses were performed for each age. The probability for the t test is based on the two tailed test.
Results
There were 10 200 white, singleton born children (5064 boys and 5136 girls) with perinatal and 23 year data. Height at each follow up examination was available for 8426, 8537, 7654, and 9683 children at the follow up ages of 7, 11, 16, and 23 years respectively (approximately 85% of the target population). Tables 1 and 2 show distribution of height divided by birth weight and age. There was a positive gradient in height by birth weight at each age (F test, p > 0.001). The mean differences in height between LBW and ABW children were 2.8 (95% confidence interval (CI) 2.6 to 2.9) cm and 3.8 (95% CI 3.6 to 3.9) cm at age 7, and 3.3 (95% CI 3.1 to 3.5) cm and 3.9 (95% CI 3.7 to 4.0) cm at age 23, for males and females, respectively. These height deficits of LBW persisted from age 7 to age 23 for both sexes.
Distribution of height divided by birth weight and age for males
Distribution of height divided by birth weight and age for females
In table 3 height deficit at each age is compared with social class, for combined sexes, because there are no major difference between the males and females. Overall, there are significant deficits in height of LBW infants in each social class, though the deficit was smaller in social class I and II than in the other social classes. Interestingly, there are clear differences in the changes of height deficit by social classes. The height deficit had reduced from age 7 to 23: 2.9 (95% CI 2.7 to 3.2) cm at age 7, to 1.6 (95% CI 1.1 to 2.1) cm at age 16, and 2.5 (95% CI 1.9 to 3.0) cm at age 23 in social classes I and II. The deficits were no longer significant after age 16. However, in the other social classes, the deficits in height by birth weight persisted from age 7 to 23. For instance, in social classes IV and V, the height deficits persisted from 3.7 cm (95% CI 3.4 to 3.9) at age 7 to 5.3 (95% CI 4.8 to 5.8) cm at age 16 and 3.7 (95% CI 3.1 to 4.2) cm at age 23.
Mean and confidence interval of the height deficit of low birth weight from adequate birth weight children divided by social class and age
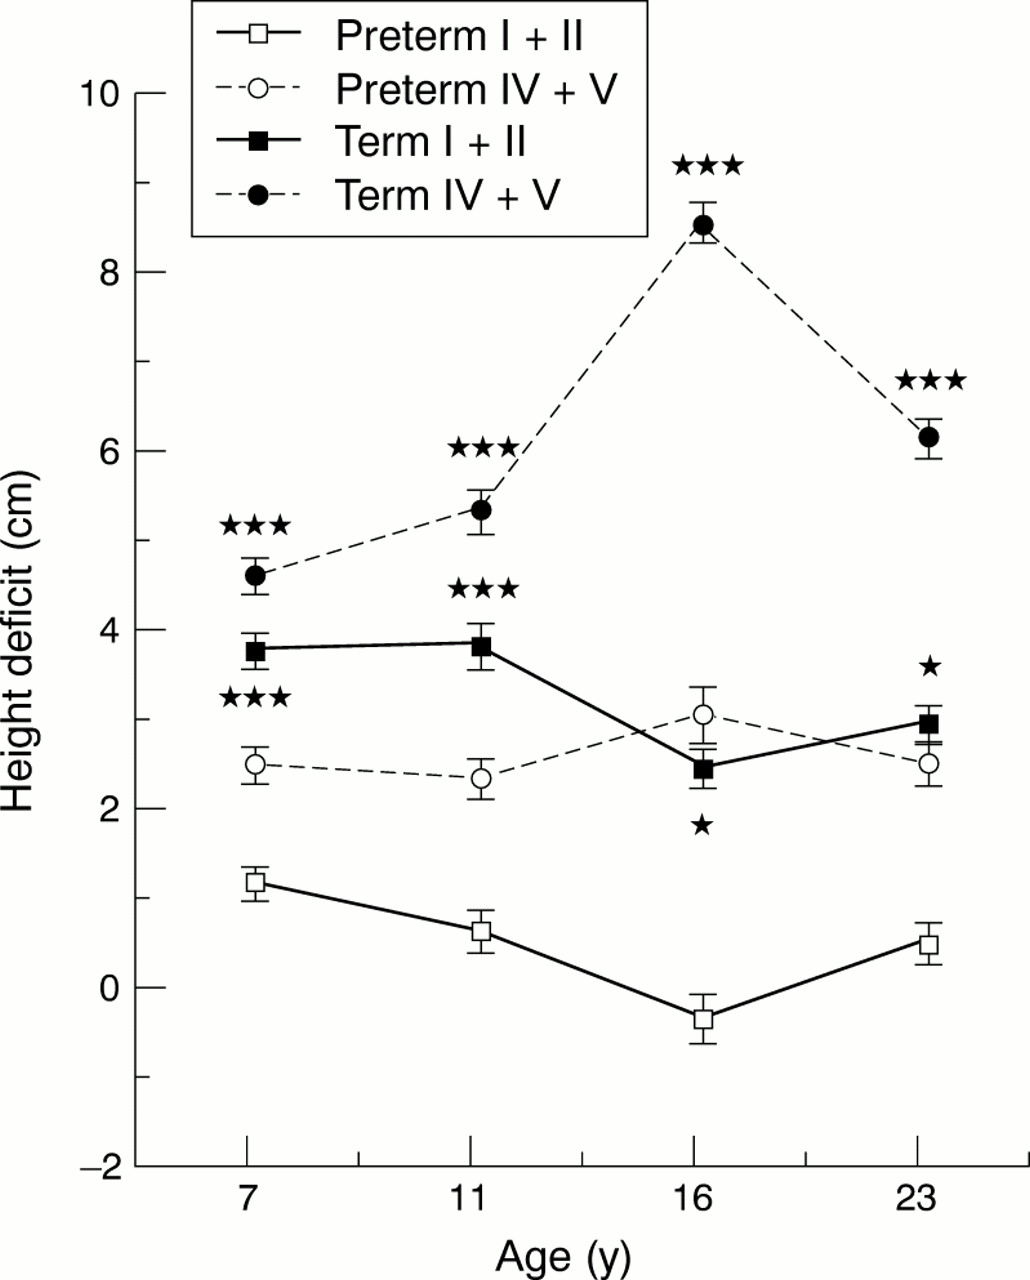
Data on gestational age were available for approximately 90% of the children. Figure 1 shows the changes in height deficit divided by gestational age and social class. The mean height deficit of preterm LBW children in social classes I and II was not only smallest among these social class groups at each age but also showed a reducing tendency from age 7 to age 23. On the contrary, the mean height deficit of preterm LBW infant in social classes IV and V was larger than that of social class I and II and did not show any reducing tendencies. Among the term LBW children, the mean height deficit of LBW in social class I and II was significantly smaller than that of social classes IV and V and showed reducing tendency from age 7 to age 23. However, in the other social classes, the height deficits showed more deflecting tendencies up to age 23. That is, the catch up pattern in height of LBW children was recognised not only among the preterm infants but also among term LBW infants in social classes I and II.

Changes of height deficit of low birth weight children divided by gestational period and social class from age 7 to 23. Error bars show standard error. Significance difference between LBW and ABW: ***p < 0.001, *p < 0.05.
Discussion
The NCDS is a British national representative cohort study. The large sample size, long term follow up period, and comprehensive data provide a rich opportunity to study child growth longitudinally. The original study cohort was based on approximately 17 000 births—that is, 98% of all births in one week of 1958. In this study, the sample was confined to the 10 200 white, singleton births with perinatal and 23 year data.
It was established that the selection bias caused by non-response was acceptably small in follow up at age 16.14 According to Power and colleagues,10 the selection bias at age 23 was again small, although there was a tendency for respondents to over represent middle class backgrounds, smaller families, and better housing circumstances. It is, therefore, assumed that these longitudinal data are representative enough to analyse the growth pattern of infants by birth weight, though bias caused by non-response in the socioeconomically “disadvantaged” group cannot be ruled out.
In this study, we focused on the difference in growth pattern of height in LBW infants between social classes. It is well known that measurement of body size at a given age is one of the best indices of general health and nutritional status of the populations.15 It is also well recognised that birth weight relates to subsequent height in later childhood.2 ,3
In our analysis, a graded association between birth weight and height was confirmed at each of the follow up examinations between ages 7 and 23. Several researchers have reported the association between height at various ages and respective social class.15-18 However, we could find no reports that described relationships between long term growth pattern in LBW infants and their social class from birth to adulthood.
The interesting finding of this study is that, although LBW is associated with shorter height in childhood and adulthood, the growth pattern of LBW infants differed among the social classes. That is, the catching up in height of LBW infants was more pronounced in upper social classes. Douglas and Mogford19 reported similar findings in a report from the 1946 British birth cohort at age 4: “as judged by the mean differences between the pairs in both weight and height, the children of more prosperous parents have by 4 years of age a proportionately greater reduction in their handicaps of the LBW than the children in other groups. These differences, however, are not significant.” This earlier research suggests that the growth pattern is different according to social class, although the findings were based on four years follow up of a case control study consisting of 464 premature infants. Our results were obtained by the analysis of the data from follow ups of a population based cohort study up to adulthood. Though the height at age 23 was self reported, this agrees reasonably with measured heights.20 ,21
We could not explain the exact reasons why the catch up growth is prominent in the upper social class. However, there are several reports which indicate that social conditions have a notable effect on growth in height.22-24 Broadly, there are two possibilities for the greater “catching up” in growth in LBW infants born to social class I and II. One is that the causal factors related to LBW may have been different in the higher social classes, as the environmental influences associated with social class affect growth in the fetus as well as during childhood.25 Another explanation is that the higher social condition has a favourable effect on the growth of LBW infants, because of education, nutritional supplements, and health care, for example. As the catch up was observed not only among preterm LBW infants but also term LBW infants, the favourable effects during childhood and adolescence were not ruled out. We could not determine which effect of the social factors had contributed most to the difference in the growth pattern. Further study is needed to find the actual causal factors contributing to the catch up growth.
As such longitudinal study of a birth cohort is an excellent method to assess the whole scope of child growth, establishment of such studies in each country would be valuable. In developing countries, in particular, this would enable the assessment of how growth retardation can be overcome.26 ,27 In this study, we have focused on the social class difference in growth patterns of height, but these findings provide a more general relationship between social factors and health. Improved social conditions and proper health care during gestational, infant, and childhood periods could be proposed as factors which promote favourable growth and development.
Acknowledgments
We thank the ESRC Data Archive and the Social Statistic Research Unit at City University for access to the data of the National Child Development Study. We also thank Christine Power and the NCDS User Support Group for helpful comments. The data were analysed during the studying abroad of HT and HN.