Article Text

Abstract
Objective—To examine recent trends in unintentional childhood injury mortality in Europe, and to identify the contribution of specific causes.
Setting—The 15 current member countries of the European Union.
Methods—Analysis of mortality data (1984–93) obtained from the World Health Organisation and national government agencies.
Results—Injuries continue to be the leading cause of childhood death in all study countries, with more than 4500 fatalities annually, accounting for over 30% of all child mortality. The major causes of death in all countries were injuries due to motor vehicle traffic accidents, drownings, fire and flames, and falls. Portugal experienced mortality rates double those of most other countries, with the differentials particularly stark early in the study period. Although a decrease in age standardised mortality rates was observed in all countries over the decade, the extent of the decrease varied widely, from −47% in the UK to −11% in Finland.
Conclusion—The pattern of childhood injury in Europe is similar to that observed elsewhere in the world. None the less, differences in rates of childhood injury mortality persist between countries. Identifying the reasons for these variations between countries may hold the key to the reduction injury rates in Europe as a whole.
- Europe
- epidemiology
- mortality
- trends
Statistics from Altmetric.com
In 1990, an estimated five million people world wide died as a result of an externally caused physical injury, accounting for 10% of deaths that year.1 In the European Union (EU), approximately 200 000 deaths are caused each year by injuries (both unintentional and intentional), and many more non-fatal injuries result in either permanent or temporary disability.2–4 In response, the World Health Organisation (WHO), the European Commission (EC), and several national governments identified accidents as a priority area for action in their respective policy statements.5–8
The decline of communicable disease as a major cause of mortality has contributed to the emergence of injuries as a major cause of premature mortality in many countries throughout the world, particularly among children and young people.4,9–11 Over one half of the estimated 898 million years of life lost world wide in 1990 due to premature death were attributed to externally caused injuries.1 Injuries are now the leading cause of childhood death and a significant contributor to childhood morbidity and long term disability in most industrialised countries, including those in Europe.4,9,11
Injury mortality rates in the EU appear to be declining.3 Despite the downward trends in age standardised injury mortality due to both unintentional and intentional injuries, marked variations in injury mortality rates have been observed between countries.3 Between 1984 and 1993, all age injury mortality rates reported in Finland, Portugal, and France were almost double those in the UK, Netherlands, and Sweden. This paper examines the trends in childhood injury mortality in the 15 countries currently members of the EU (1984–93), with special reference to the contribution of specific injury causes.
Methods
The EURORISC (European Review of Injury Surveillance and Control) project is funded by the EC as a concerted action that brings together 16 experts from nine European countries. In the first phase of the project one of the main aims was to establish the contemporary epidemiology of injury in the 15 countries currently members of the EU. These countries are Austria, Belgium, Denmark, Finland, France, Germany, Greece, Ireland, Italy, Luxembourg, Netherlands, Portugal, Spain, Sweden, and the UK.
Data on injury mortality were obtained from the WHO for the 15 study countries. National agencies are required to submit their national mortality data annually to the WHO. Data are presented according to sex, age, and cause of death. In the study countries mortality data were collected as part of routine vital registration. Deaths were recorded by date of occurrence, except in the UK where deaths were recorded by date of registration. Almost all deaths were medically certified in the study countries, although there are differences in the number of deaths occurring in hospitals or other medical establishments and the proportion of deaths where an autopsy was performed. In 11 study countries the coding procedure was centralised and decentralised in four countries.
For the purpose of this paper, the analysis was confined to children 0–14 years who died between 1984 and 1993 with cause of death codes E800–949 of the ninth edition of the International Classification of Diseases (ICD-9). These codes include deaths from all unintentional injuries: motor vehicle traffic accidents, other transport accidents, drownings, fire and flame related injuries and falls, among others. Data for the period 1984 to 1993 were available for 12 of the 15 study countries. The latest published data for Spain and Ireland were for 1992, and for Belgium 1989. The numbers and rates for these three countries are based on data from 1984 to the latest available year.
To allow comparisons between countries, age standardised mortality rates were calculated for 0–14 year olds (using two age categories 0–4, 5–14 years) employing the direct method with reference to the world standard population,12 using annual population figures obtained from the WHO. Deaths which occurred in Luxembourg were included in the Europe-wide totals but were excluded from the country-by-country analysis due to the small number of injury deaths experienced annually in that country. Linear regression was then used to represent the linear component of the mortality profile over the study period with a baseline of 1984. Three statistics are presented: the adjusted R2, the gradient of the linear model (regression coefficient B), and the associated p value. The adjusted R2 shows the extent to which the two variables are related and is expressed as a percentage. The regression coefficient is the per unit change in the age standardised mortality rate and the p value indicates the significance of the relationship. The level of statistical significance was set at p ≤0.05.
Results
Over 1.3 million residents of the 15 current EU member states died as a result of an unintentional injury over the study period.3 Of these, 61 707 (5%) were children aged 0–14 years, of whom 64% were male. Deaths due to unintentional injury accounted for over 30% of all childhood mortality.
All study countries experienced a decrease in age standardised injury mortality rates over the study period (figs 1 and 2). With two exceptions (Denmark and Finland), study countries experienced significant linear decreases in age standardised mortality due to unintentional injuries between 1984 and 1993 (or latest available year) (table 1). Denmark and Finland experienced non-linear decreases in rates. However, the proportional decreases in age standardised injury mortality observed over the study period varied markedly between countries. Decreases were greatest in the UK (−47%), Germany (−45%), and France (−41%); Spain (−15%) and Finland (−11%) experienced the smallest proportional decreases with rates declining by less than one fifth.
Number of injury deaths, injury mortality rates, and age standardised injury mortality rates for the EU population aged 0–14 years, by European country, 1984–93 (unless otherwise stated). Ranked by % decrease in age standardised mortality rate
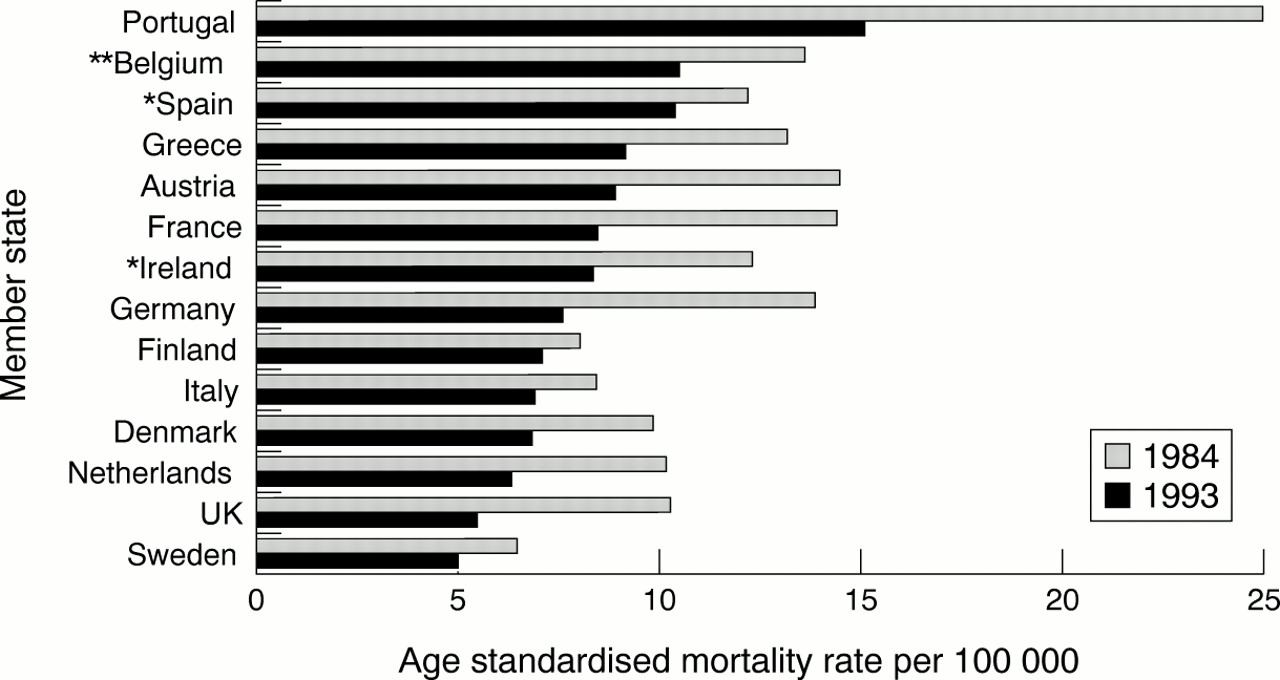
Age standardised mortality rates due to unintentional injury (1984 and 1993); *latest available data 1992; **latest available data 1989.

Age standardised mortality rates due to unintentional injury from 1994 to 1993.
There were marked differences in rates between countries in both 1984 and 1993 (or the latest available year). The difference between Portugal and other countries was particularly striking early in the study period, and Portugal continued to experience rates substantially higher than most other study countries in 1993. This occurred despite a general decrease in age standardised rates, and a lessening of the gap between Portugal and other countries. Portugal excepted, Belgium and Spain experienced the highest rates by the end of the study period. (However, it should be noted that the latest available mortality data for Belgium as a whole were for 1989.) Sweden had the lowest rates of age standardised mortality in both 1984 and 1993.
CAUSES OF INJURY
Over the study period almost half of injury deaths in children were due to motor vehicle traffic accidents (table 2). Drowning was the second most frequent cause of death (12%), followed by fire and flame related injuries (6%), falls (5%), and other transport accidents (2%). Injuries classified as “other” include deaths from poisoning and ingestions, suffocation, choking, cutting and piercing injuries, firearms, and adverse effects to medication, as well as a miscellaneous group. A decrease in age standardised mortality rates was observed for all four major causes: motor vehicle traffic (−34%), drownings (−32%), falls (−32%), and fire and flames (−17%).
Principal causes of death due to injury in European children 0–14 years (1984–93)
Motor vehicle traffic
A total of 27 772 children (65% male) died as a result of a motor vehicle traffic accident, accounting for 45% of all childhood deaths due to injury. With one exception (Spain), all study countries experienced a decrease in age standardised rates. Portugal had the highest rates throughout the study period, double those observed in most other countries by 1993 (fig 3). In Spain, the same rate was observed in 1984 and 1992. Sweden had the lowest mortality rates due to motor vehicle traffic accidents both at the beginning and the end of the study period.

Age standardised mortality rates due to motor vehicle traffic accidents (1984 and 1993); *latest available data 1992; **latest available data 1989.
Sweden also experienced the largest proportional decline in rates over the study period, with rates falling by over a half (−54%). Large proportional declines were observed in the UK (−47%), Ireland (−44%), Finland (−43%), Germany (−41%), France (−41%), and Denmark (−39%). With the exception of Spain (0%), the remaining countries experienced smaller proportional declines (−24 to −31%).
Drownings
A total of 7105 children (58% male) died as a result of drowning or submersion over the study period. Most countries experienced a decline in mortality due to drowning, with some notable exceptions: Sweden, Finland, and Denmark had higher rates in 1993 than in 1984 (fig 4). Portugal had substantially higher age standardised mortality rates early in the study period, but experienced a sharp decline in the late 1980s. By 1993, Finland, Austria, and Sweden had the highest rates of mortality due to drowning.
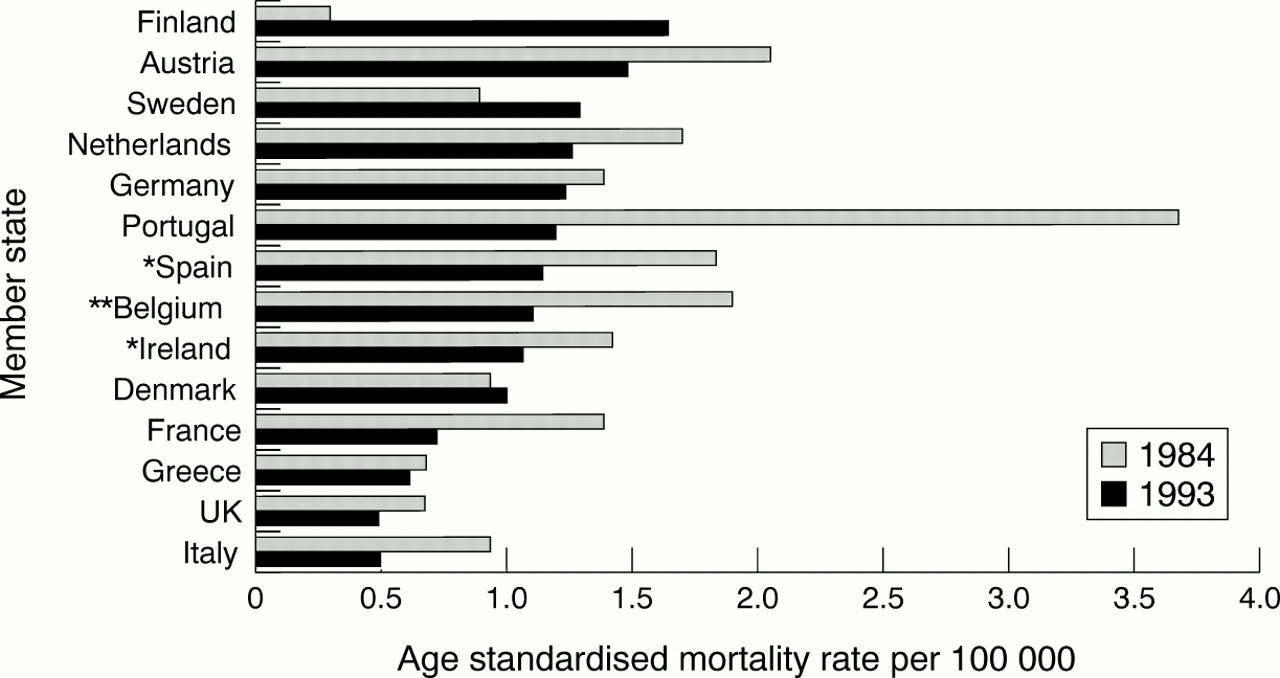
Age standardised mortality rates due to drowning (1984 and 1993); *latest available data 1992; **latest available data 1989.
The largest proportional decrease in age standardised mortality rates over the study period occurred in Portugal (−68%). Most other countries, however, also experienced substantial decreases in rates: Italy (−52%), France (−49%), Belgium (−42%), Spain (−39%), the UK (−29%), Austria (−28%), the Netherlands (−26%), Ireland (−25%), Germany (−12%), and Greece (−10%). Three countries experienced increases in rates: Finland (+220%), Sweden (+43%), and Denmark (+7%). The proportional rise in deaths due to drowning seems remarkably high for Finland. However, it should be noted that the numbers are relatively small: 16 children drowned in Finland in 1993 compared with six in 1984.
Fire and flames
Over the study period, 3602 children (53% male) died as a result of injuries sustained due to fire and flames. The majority of countries experienced a decline in these mortality rates (fig 5). Higher rates were observed in Denmark, Sweden, and Italy in 1993 than in 1984. The highest mortality rates were experienced in Ireland, Portugal, and the UK, in both 1984 and 1993.
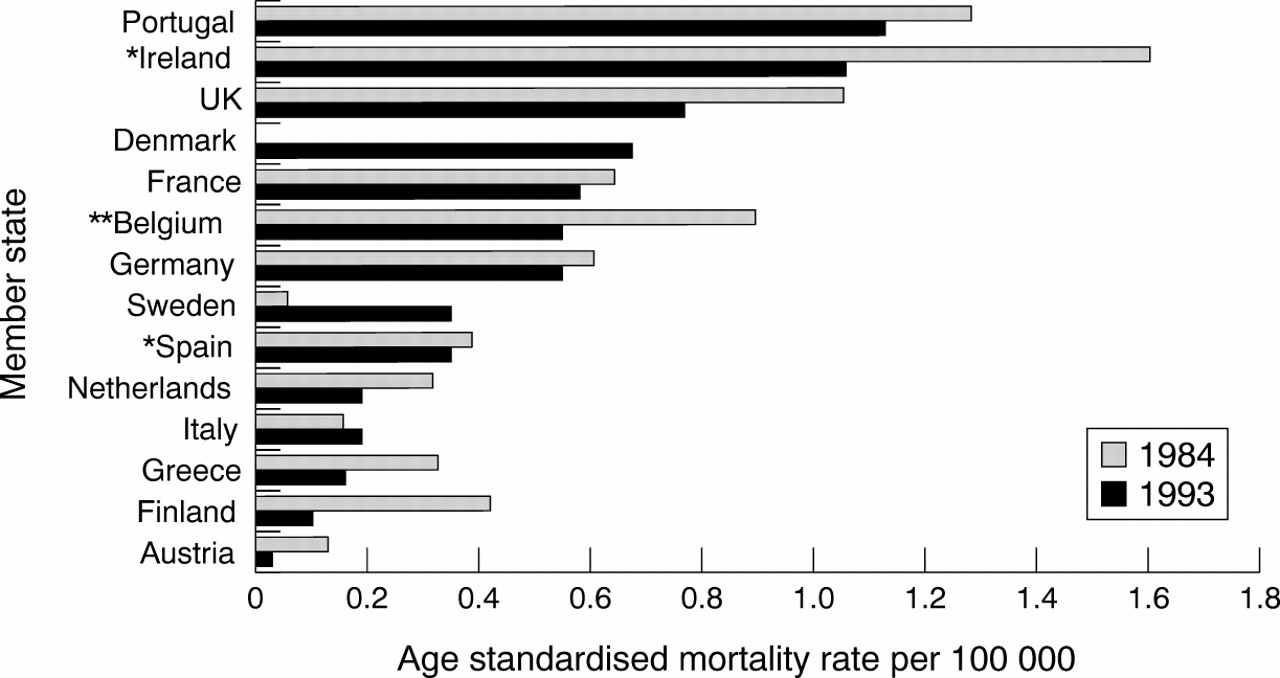
Age standardised mortality rates due to fire and flames (1984 and 1993); *latest available data 1992; **latest available data 1989.
The largest proportional decreases were observed in Finland (−77%) and Austria (−75%). Smaller proportional increases occurred in Greece (−50%), the Netherlands (−40%), Belgium (−39%), Ireland (−34%), the UK (−27%), Portugal (−13%), Germany (−11%), France (−10%), and Spain (−8%). Large increases in rates occurred in Sweden and Denmark, and a smaller increase was observed in Italy. Again, these were due to the small numbers of deaths: in Denmark no deaths due to fire and flames were recorded in 1984 compared with six deaths in 1993, while in Sweden two deaths were recorded in 1984 compared with six in 1993.
Falls
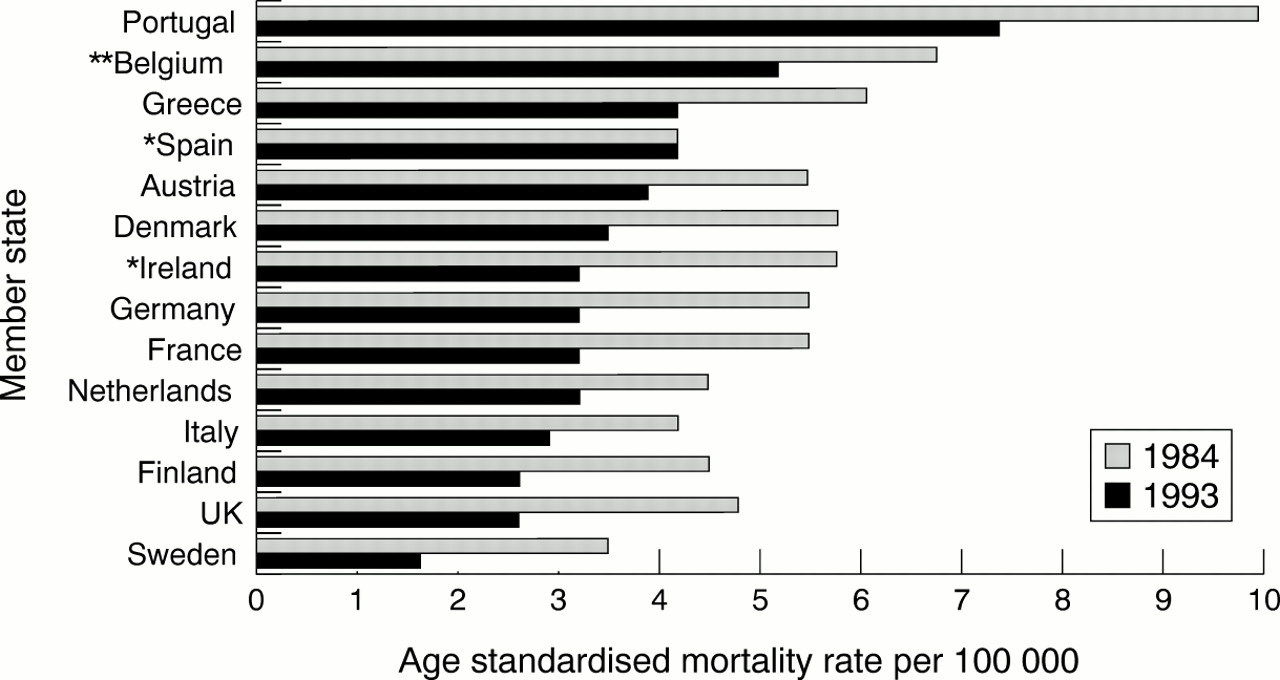
A total of 3159 children (66% male) died as a result of a fall over the study period. As with other injury types, most countries enjoyed a decrease in mortality due to falls (fig 6). However, Belgium had a higher rate in 1989 than in 1984, Sweden had a higher rate in 1993 than in 1984, and France had the same rate in both 1984 and 1993. In 1984, the highest age standardised rates were observed in Portugal, although a sharp decline in falls mortality was observed in the 1980s. Austria experienced high rates of mortality due to falls in both 1984 and 1993, and had the highest rate in the EU by 1993.

Age standardised mortality rates due to falls (1984 and 1993); *latest available data 1992; **latest available data 1989.
The largest proportional decreases in age standardised falls mortality occurred in Denmark (−83%), the UK (−57%), Portugal (−50%), the Netherlands (−47%), Ireland (−42%), Germany (−41%), and Finland (−38%). Smaller proportional decreases were observed in Italy (−15%), Greece (−7%), and Austria (−3%). Proportional increases occurred in Sweden (+225%) and Belgium (+22%). Again, the numbers are small.
Discussion
The pattern of childhood injury observed in the study countries is similar to that observed elsewhere in the world. A disproportionate number of males were injured for each of the four leading causes of death. Sex differences in injury rates have been well documented both within and outwith the EU. Epidemiological studies from Denmark, the UK, Australia, New Zealand, and the United States have reported a male excess in childhood injury deaths.13–16 Similarly, studies of specific injury causes have shown a disproportionate number of male deaths.16–18
Decreases in age standardised child injury mortality rates were observed for all causes, in all study countries, and for each of the four leading causes in most study countries between 1984 and 1993. However, there were marked variations between countries, with age standardised mortality rates decreasing at different rates in each country. The reasons for these declines, and the differences in the rates of decline, are unknown.
Portugal experienced injury mortality rates substantially higher than other countries for three of the four major injury causes (motor vehicle traffic accidents, drownings, and falls) in 1984, and two of the four major injury causes (motor vehicle traffic accidents and fire and flames) in 1993. Ireland had the highest rate of age standardised mortality due to fire and flames in 1984, and Portugal experienced the highest rate in 1993. In 1993, Austria experienced the highest rate of mortality due to drowning and falls.
Motor vehicle traffic accidents were the single greatest contributor to childhood mortality in Europe, as they are in many other countries of the world.17–20 Although motor vehicle mortality rates are generally declining, these injuries continued to account for almost half of injury deaths by the end of the study period. Further analysis of mortality rates with reference to car ownership, patterns of car usage, and population density may be valuable in helping to establish the reasons for differences in rates between countries.
Drowning is a common cause of childhood injury death world wide, particularly among very young children. In the United States and New Zealand, drowning is the leading cause of death in 1–4 year olds, surpassing motor vehicle traffic accidents in their toll.20,21 Perhaps surprisingly, age standardised mortality rates due to drowning were generally higher in northern European countries than in some southern European countries (notably Italy and Greece), despite the possibility that children in hotter climates may play close to water more frequently. The present study suggests that age standardised mortality rates due to drowning have declined over the study period in most study countries.
Deaths due to fire and flame related injuries declined in most study countries. Where increases were observed, the numbers of such injuries were small. This is reflected in studies from elsewhere. In Victoria, Australia, a 50% reduction in childhood fatalities due to burns and scalds was observed between 1970 and 1994.22 In the United States, age adjusted rates of fire and burn mortality decreased by 33% between 1985 to 1995 for all ages.16 None the less, fire and flame related injuries remain a cause of concern, with recent research studies highlighting the disproportionate number of children and the elderly injured or killed in residential fires.23–25
Child injury mortality due to falls has also declined in most countries. Where proportional increases in age standardised mortality rates were observed, the numbers were small. Falls are, however, more commonly associated with non-fatal injury, including head injuries and fractures, and have been identified as the major cause of hospitalisation and emergency room attendance.26,27
While mortality rates are useful in describing the epidemiology of childhood injury and can be used as indices for priority setting and the monitoring of trends, they also have several limitations. Childhood deaths are rare events, representing only the very tip of the injury iceberg. The inclusion of valid and reliable data on non-fatal injuries would provide a much sounder basis upon which to assess injury incidence and to evaluate the effectiveness of injury control interventions. However, such morbidity data are not universal, and are rarely comparable.
Moreover, comparing and interpreting injury mortality rates can be problematic due to the differences in coding in each country. Despite the use of a standard classification system, differences in the interpretation of coding procedures may vary. For example, while most countries adhere to the United Nations standard definition of a motor vehicle accident death (occurring within 30 days of the crash), by 1997 France and Portugal had not adopted this definition. Misclassification of intent may also result in spurious international differences. WHO data show that rates of intentional injury varied between 4.1/100 000 in Portugal and 0.2 per 100 000 in Ireland in 1993 (or the latest available year). The proportion of all injuries classified as intentional varied between 3% and 20%. We plan to investigate this further in future EURORISC analyses. A European-wide agreed code of practice for collecting, recording, analysing, and presenting child injury data (both fatal and non-fatal) would facilitate valid and reliable comparisons between countries. A major advance has occurred recently with the publication of a framework for presenting mortality data developed as part of the International Collaborative Effort (ICE) on injury statistics.28
Finally, even if the methodological obstacles are overcome, describing the epidemiology of injury in Europe is only a first step. Identifying the reasons for past and present variations between countries may hold the key to the future reduction of injury incidence in Europe as a whole.
References
Footnotes
-
The EURORISC Working Group are: Eleni Petridou, University of Athens School of Medicine, Greece; Alberto G Marchi, IRCCS Burlo Garofolo, Trieste, Italy; Madalena Cabecadas; Universidade Nova de Lisboa, Lisbon, Portugal; Leonilda De Santis, Gaslini Children's Hospital, Genova, Italy; Vita Barell, Ministry of Health, Israel; Rosa Gofin, Department of Social Medicine, Hadassah University Hospital, Jerusalem, Israel; Anne Tursz, Centre de Recherche Medecine Sciences, Paris, France; Saajke Mulder, Consumer Safety Institute, Amsterdam, The Netherlands; Wim Rogmans, Consumer Safety Institute, Amsterdam, The Netherlands; Christopher Birt, University of Birmingham Collaboration for Public Health in Europe, Birmingham, England; Stephen Jarvis, University of Newcastle, England; Elizabeth Towner, University of Newcastle, England; Anne Kilgallen, North Western Health Board, Co Donegal, Ireland; Richard Smithson, Western Health & Social Services Board, Northern Ireland; Geoff Holman, Produkt-Og Elektrisitetstilsynet, Oslo, Norway; Lars Gunnar Horte, Department of Public Health Services, Stockholm, Sweden.