
Green Space and Health Equity: A Systematic Review on the Potential of Green Space to Reduce Health Disparities

 , , and
 _Yoon.jpg)
Abstract
:1. Introduction
1.1. Research Questions and Hypotheses
- RQ1. Does green space show more protective effects for disadvantaged populations than for privileged groups?
- RQ2. What type(s) of green space (e.g., trees or parks) shows more protective effects for disadvantaged populations than for privileged groups?
- RQ3. Does green space show more protective effects on specific diseases and illnesses for disadvantaged populations than for privileged groups?
- RQ4. In which continent(s) does green space show more protective effects for disadvantaged populations than for privileged groups?
1.2. Health Disparities, Health Inequities, and Health Equity
1.2.1. Defining Terms
1.2.2. Identifying Health Disparities
2. Materials and Methods
2.1. Article Search
- Report at least one of the measures of physical health outcomes described in the introduction (atopic diseases, birth outcomes, cancer, cardiovascular health/disease, diabetes, general health, mortality, and obesity);
- Report at least one measure of objective or perceived green space provision or exposure. Green space measures include access to parks, level of residential vegetation (e.g., greenness), access to a residential garden, and others [67];
- Perform inferential statistical analyses (e.g., regressions) on primary data;
- Find that either the entire study population or a subsample (e.g., high-SES people) shows a beneficial relationship between green space and health;
- Analyze whether the size or direction of the association between green space and physical health differs between disadvantaged and privileged populations (e.g., split-sample analyses or interaction tests);
- Be published in peer-reviewed journals and written in English.
2.2. Data Extraction
2.3. Methodological Bias and Quality of Evidence
2.4. Data Analysis
2.5. Articles Finding Null or Negative Associations between Green Space and Health
3. Results
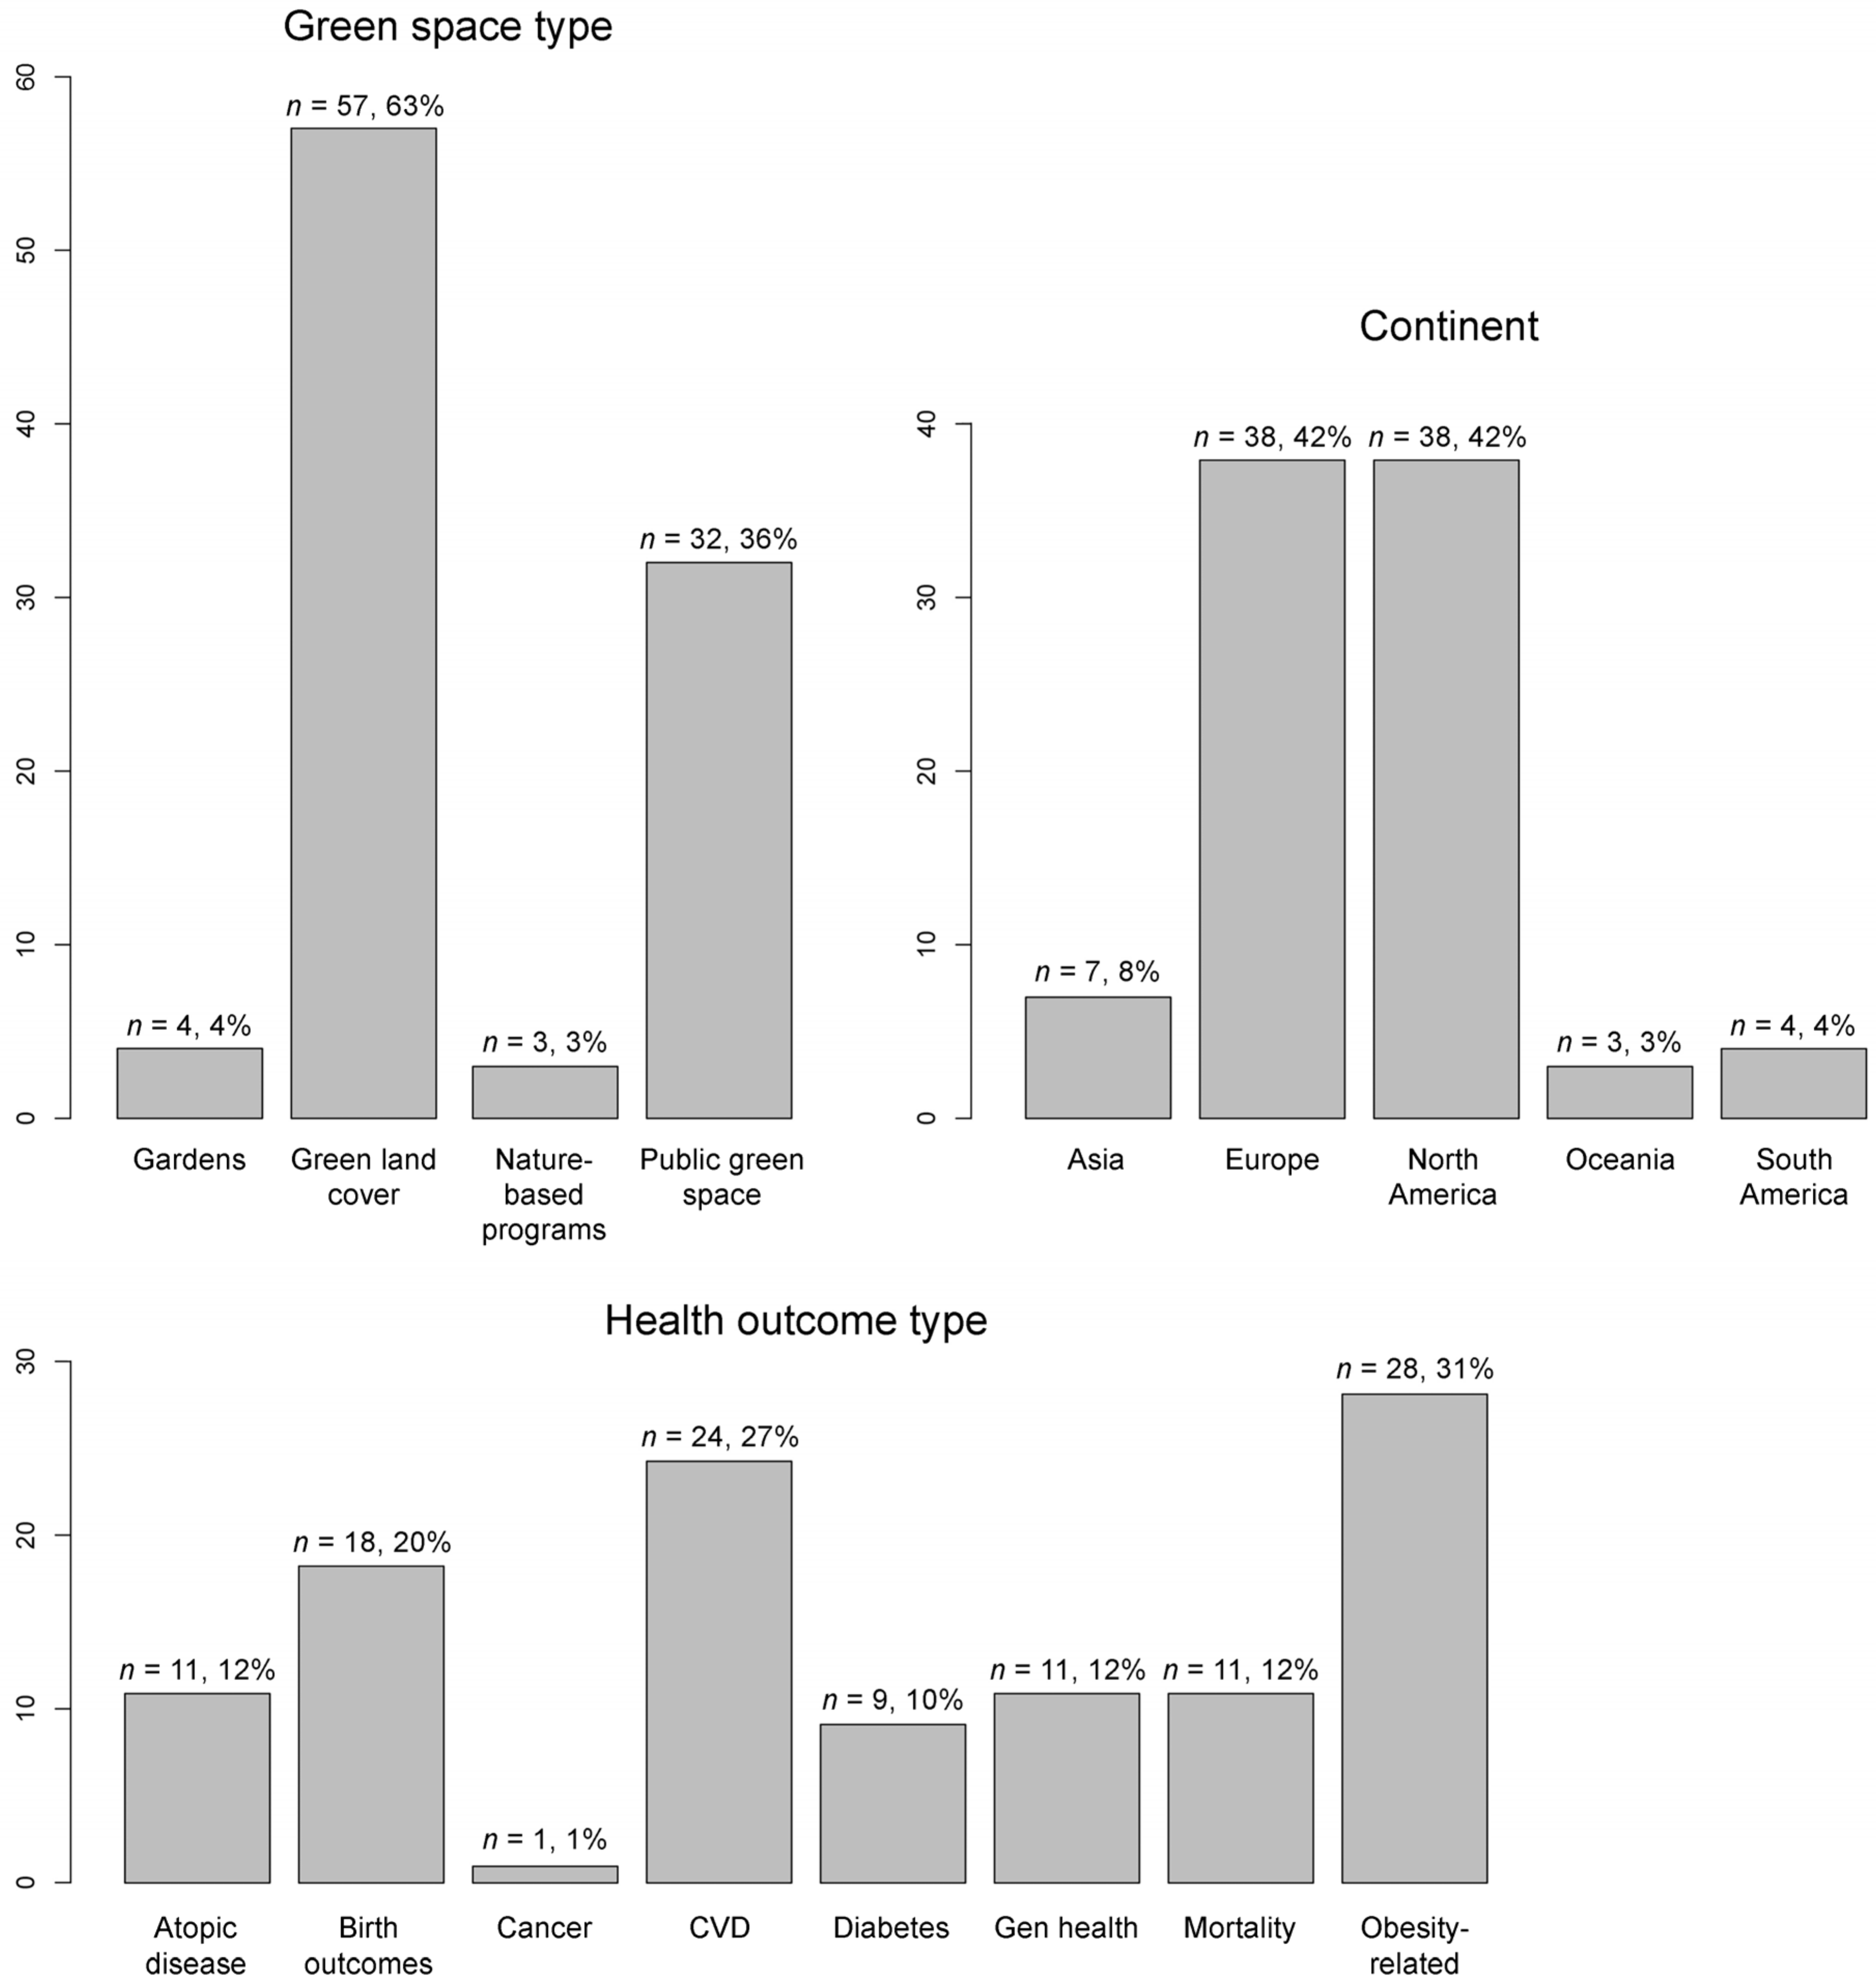
3.1. Descriptive Statistics
3.2. Summary of Findings on Methodological Bias and Quality of Evidence
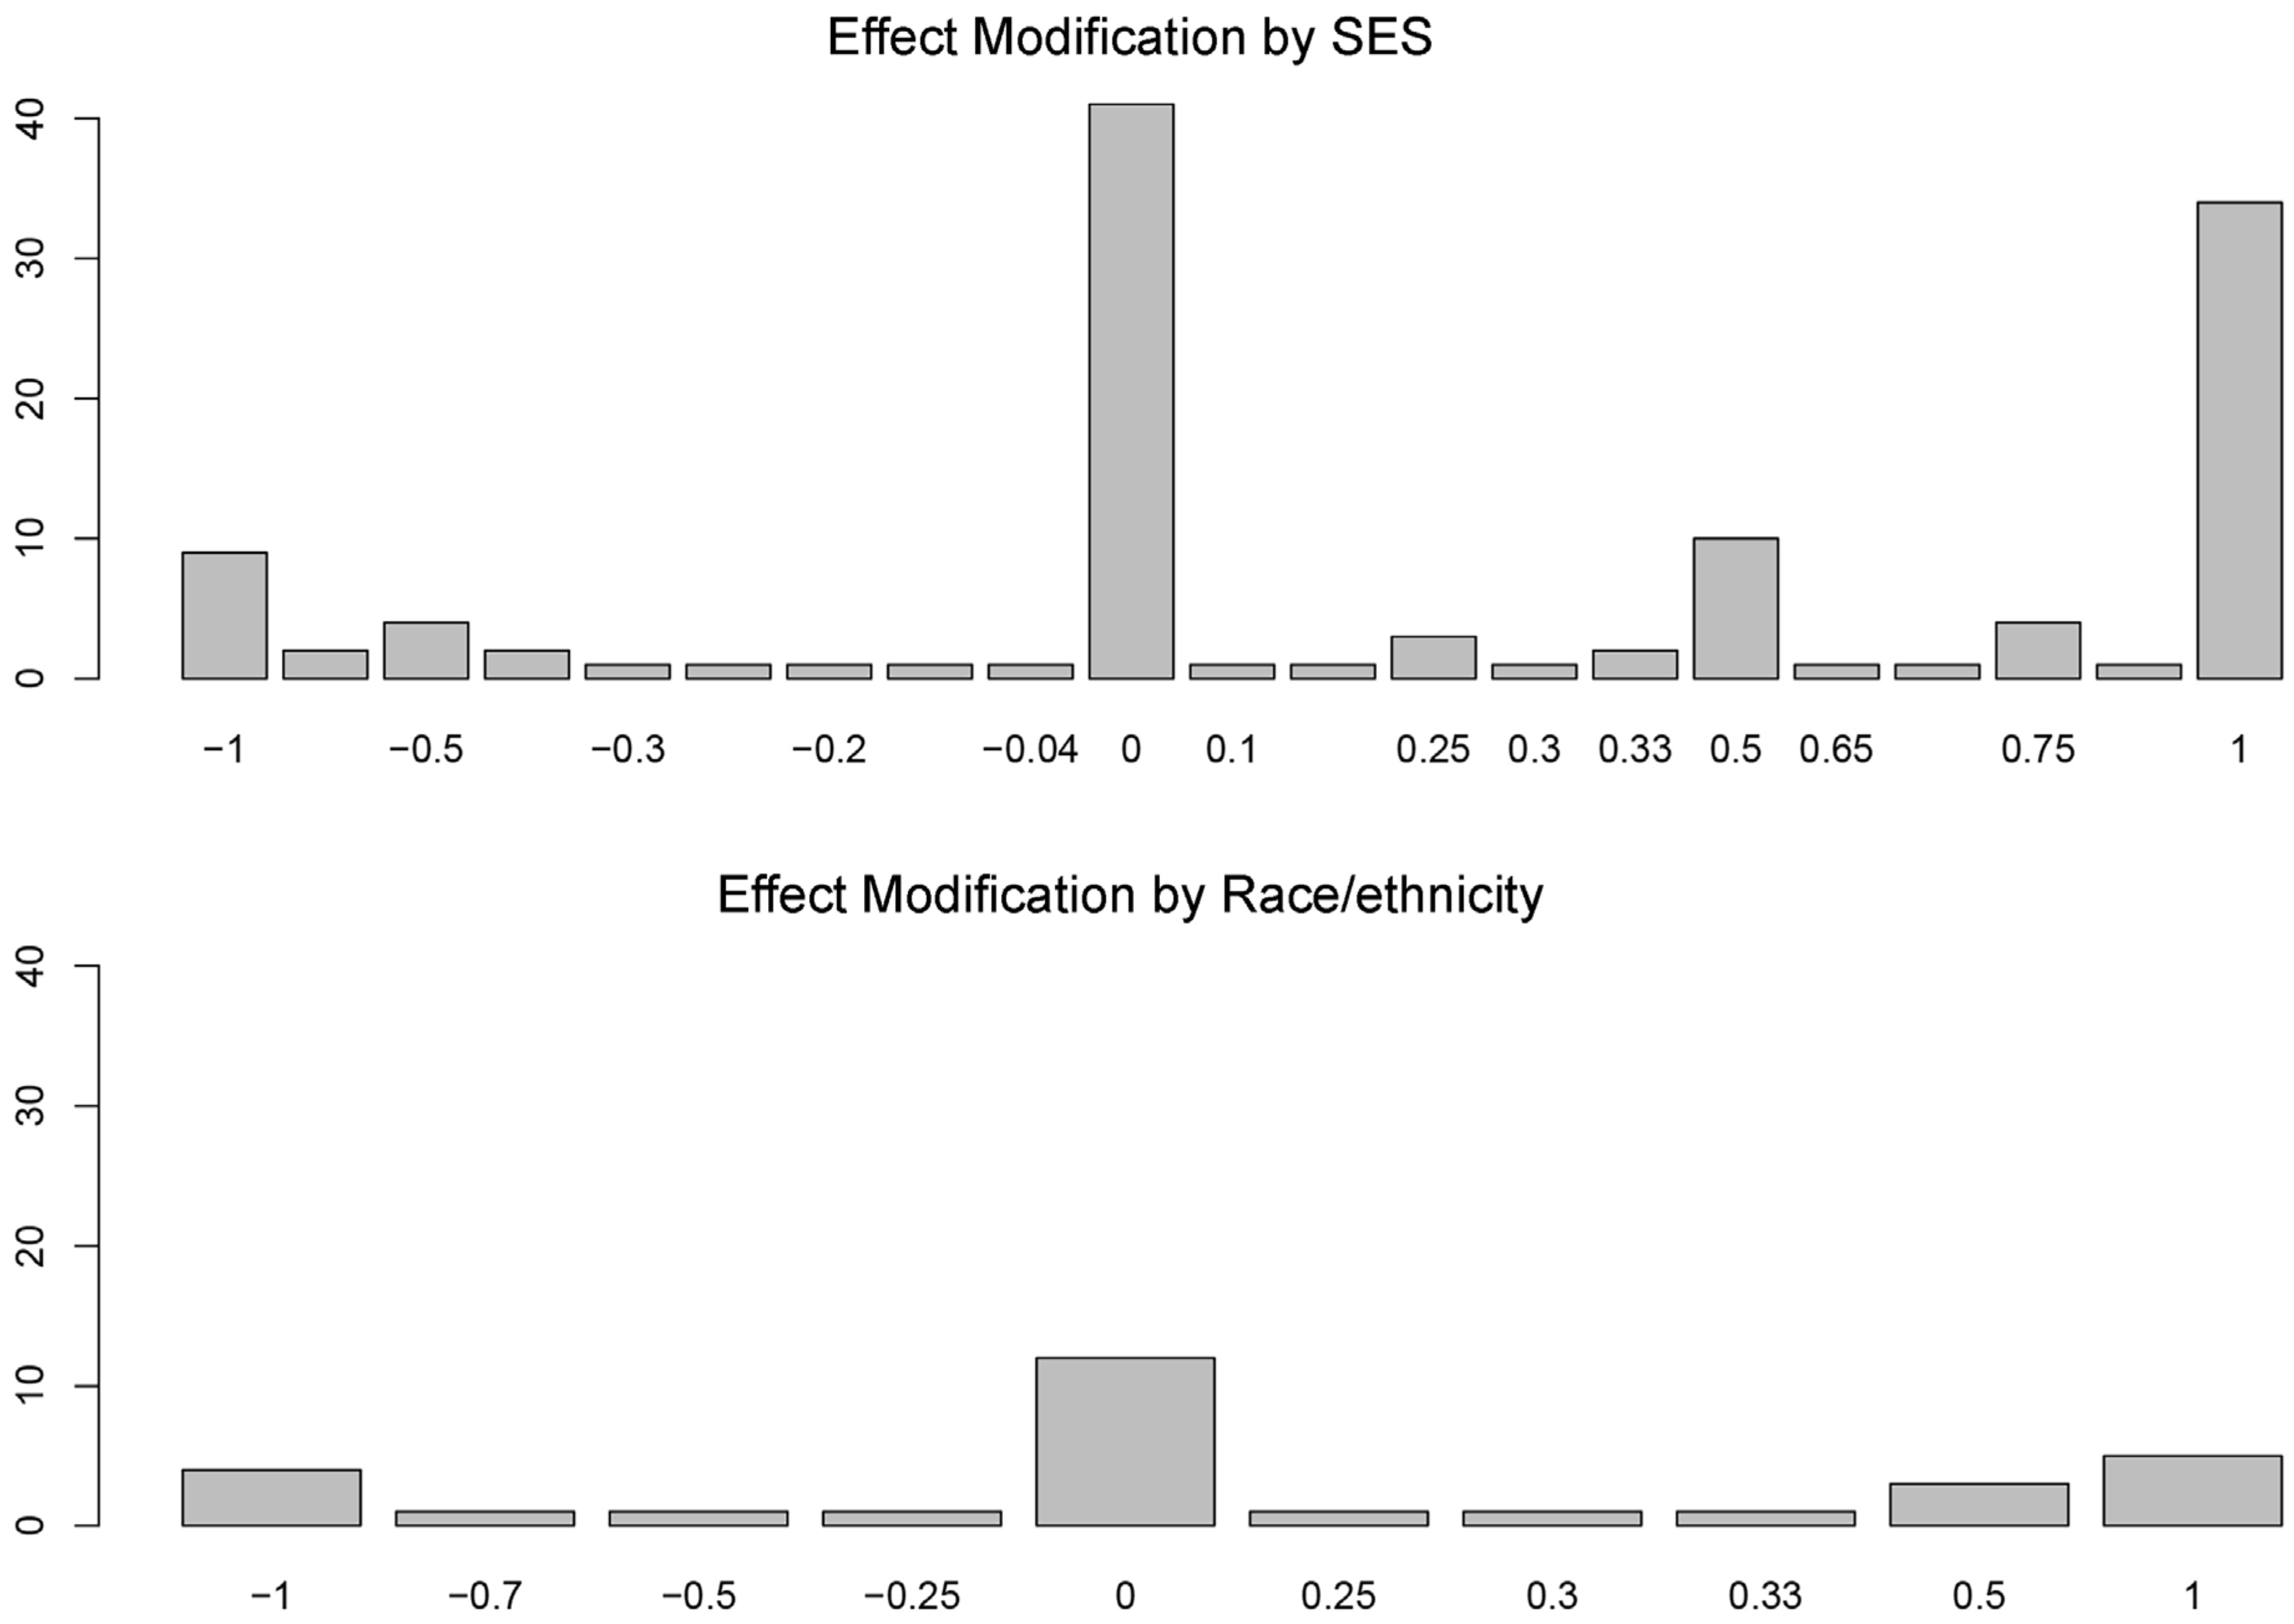
3.3. More Protective Effects for Whom?
3.4. Does Green Space Type Matter?
3.5. Does the Type of Health Outcome Matter?
3.6. Does the Continent Matter?
4. Conclusions
4.1. Summary of Findings
4.2. Strengths, Limitations, and Future Research
4.3. Policy Implications
Supplementary Materials
Author Contributions
Funding
Institutional Review Board Statement
Informed Consent Statement
Data Availability Statement
Conflicts of Interest
References
- Braveman, P.A.; Arkin, E.; Orleans, T.; Proctor, D.; Plough, A. What is Health Equity? And What Difference Does a Definition Make? Robert Wood Johnson Foundation: Princeton, NJ, USA, 2017. [Google Scholar]
- Weinstein, J.N.; Geller, A.; Negussie, Y.; Baciu, A. Communities in Action: Pathways to Health Equity; The National Academies Press: Washington, DC, USA, 2017. [Google Scholar]
- OECD. Healthy for Everyone? Social Inequalities in Health and Health Systems; OECD Publishing: Paris, France, 2019; ISBN 9789264731608. [Google Scholar]
- Braveman, P.A.; Cubbin, C.; Egerter, S.; Williams, D.R.; Pamuk, E. Socioeconomic disparities in health in the United States: What the patterns tell us. Am. J. Public Health 2010, 100, S186–S196. [Google Scholar] [CrossRef]
- Mears, M.; Brindley, P.; Jorgensen, A.; Maheswaran, R. Population-level linkages between urban greenspace and health inequality: The case for using multiple indicators of neighbourhood greenspace. Heal. Place 2020, 62, 102284. [Google Scholar] [CrossRef]
- Woolf, B.S.H.; Braveman, P. Where health disparities begin: The role of social and economic determinants—and why current policies may make matters worse. Health Aff. 2011, 30, 1852–1859. [Google Scholar] [CrossRef] [Green Version]
- Hero, J.O.; Zaslavsky, A.M.; Blendon, R.J. The United States leads other nations in differences by income in perceptions of health and health care. Health Aff. 2017, 36, 1032–1040. [Google Scholar] [CrossRef]
- National Center for Health Statistics. United States Health, 2015—With Special Feature on Racial and Ethnic Health Disparities; Centers for Disease Control and Prevention: Washington, DC, USA, 2016; ISBN 0002-9165. [Google Scholar]
- Evandrou, M.; Falkingham, J.; Feng, Z.; Vlachantoni, A. Ethnic inequalities in limiting health and self-reported health in later life revisited. J. Epidemiol. Community Health 2016, 70, 653–662. [Google Scholar] [CrossRef] [Green Version]
- Australian Institute of Health and Welfare. Australia’s Health 2020: Data Insights; Australian Institute of Health and Welfare: Canberra, Australia, 2020; ISBN 9781760546892. [Google Scholar]
- Obuaku-Igwe, C.C. Health inequality in South Africa: A systematic review. African Sociol. Rev. 2015, 19, 96–131. [Google Scholar]
- Katz, A.S.; Cheff, R.M.; O’Campo, P. Bringing stakeholders together for urban health equity: Hallmarks of a compromised process. Int. J. Equity Health 2015, 14, 138. [Google Scholar] [CrossRef] [Green Version]
- Rouvinen-Wilenius, P.; Ahokas, J.; Kiukas, V.; Aalto-Kallio, M. Finnish NGOs promoting health equity in the context of welfare economy. Health Promot. Int. 2019, 34, 648–657. [Google Scholar] [CrossRef]
- Van den Bosch, M.; Ode Sang, Å. Urban natural environments as nature-based solutions for improved public health—A systematic review of reviews. Environ. Res. 2017, 158, 373–384. [Google Scholar] [CrossRef] [PubMed]
- Twohig-Bennett, C.; Jones, A. The health benefits of the great outdoors: A systematic review and meta-analysis of greenspace exposure and health outcomes. Environ. Res. 2018, 166, 628–637. [Google Scholar] [CrossRef] [PubMed]
- Krefis, A.; Augustin, M.; Schlünzen, K.; Oßenbrügge, J.; Augustin, J. How does the urban environment affect health and well-being? A systematic review. Urban. Sci. 2018, 2, 21. [Google Scholar] [CrossRef] [Green Version]
- Akaraci, S.; Feng, X.; Suesse, T.; Jalaludin, B.; Astell-Burt, T. A systematic review and meta-analysis of associations between green and blue spaces and birth outcomes. Int. J. Environ. Res. Public Health 2020, 17, 2949. [Google Scholar] [CrossRef] [PubMed]
- Rojas-Rueda, D.; Nieuwenhuijsen, M.; Gascon, M.; Perez-Leon, D.; Mudu, P. Green spaces and mortality: A systematic review and meta-analysis of cohort studies | Manuscript Draft. Lancet Planet. Heal. 2019, 19, e469–e477. [Google Scholar] [CrossRef] [Green Version]
- Markevych, I.; Schoierer, J.; Hartig, T.; Chudnovsky, A.; Hystad, P.; Dzhambov, A.M.; de Vries, S.; Triguero-Mas, M.; Brauer, M.; Nieuwenhuijsen, M.J.; et al. Exploring pathways linking greenspace to health: Theoretical and methodological guidance. Environ. Res. 2017, 158, 301–317. [Google Scholar] [CrossRef]
- Dzhambov, A.M.; Browning, M.H.E.M.; Markevych, I.; Hartig, T.; Lercher, P. Analytical approaches to testing pathways linking greenspace to health: A scoping review of the empirical literature. Environ. Res. 2020, 186, 109613. [Google Scholar] [CrossRef] [PubMed]
- Cole, H.V.S.; Triguero-Mas, M.; Connolly, J.J.T.; Anguelovski, I. Determining the health benefits of green space: Does gentrification matter? Health Place 2019, 57, 1–11. [Google Scholar] [CrossRef]
- Feng, X.; Astell-Burt, T. Do greener areas promote more equitable child health? Heal. Place 2017, 46, 267–273. [Google Scholar] [CrossRef]
- Ward Thompson, C.; Roe, J.; Aspinall, P.; Mitchell, R.; Clow, A.; Miller, D. More green space is linked to less stress in deprived communities: Evidence from salivary cortisol patterns. Landsc. Urban. Plan. 2012, 105, 221–229. [Google Scholar] [CrossRef] [Green Version]
- Osborne Jelks, N.; Jennings, V.; Rigolon, A. Green gentrification and health: A scoping review. Int. J. Environ. Res. Public Health 2021, 18, 907. [Google Scholar] [CrossRef]
- Frumkin, H.; Bratman, G.N.; Brewslow, S.J.; Cochran, B.; Kahn, P.H.; Lawler, J.J.; Levin, P.S.; Tandon, P.S.; Varanasi, U.; Wolf, K.L.; et al. Nature contact and human health: A research agenda. Environ. Heal. Perspect. 2017, 125, 075001. [Google Scholar] [CrossRef] [Green Version]
- Shanahan, D.F.; Lin, B.B.; Bush, R.; Gaston, K.J.; Dean, J.H.; Barber, E.; Fuller, R.A. Toward improved public health outcomes from urban nature. Am. J. Public Health 2015, 105, 470–477. [Google Scholar] [CrossRef] [PubMed]
- Hartig, T.; Mitchell, R.; De Vries, S.; Frumkin, H. Nature and health. Annu. Rev. Public Health 2014, 35, 207–228. [Google Scholar] [CrossRef] [PubMed] [Green Version]
- Kabisch, N. The influence of socio-economic and socio-demographic factors in the association between urban green space and health. In Biodiversity and Health in the Face of Climate Change; Springer: Cham, Switzerland, 2019; pp. 91–119. ISBN 9783030023171. [Google Scholar]
- James, P.; Banay, R.F.; Hart, J.E.; Laden, F. A review of the health benefits of greenness. Curr. Epidemiol. Reports 2015, 2, 131–142. [Google Scholar] [CrossRef] [PubMed] [Green Version]
- Fong, K.C.; Hart, J.E.; James, P. A review of epidemiologic studies on greenness and health: Updated literature through 2017. Curr. Environ. Heal. Reports 2018, 5, 77–87. [Google Scholar] [CrossRef] [Green Version]
- Banay, R.F.; Bezold, C.P.; James, P.; Hart, J.E.; Laden, F. Residential greenness: Current perspectives on its impact on maternal health and pregnancy outcomes. Int. J. Womens. Health 2017, 9, 133–144. [Google Scholar] [CrossRef] [Green Version]
- Rigolon, A. A complex landscape of inequity in access to urban parks: A literature review. Landsc. Urban. Plan. 2016, 153, 160–169. [Google Scholar] [CrossRef]
- Rigolon, A.; Browning, M.H.E.M.; Lee, K.; Shin, S. Access to urban green space in cities of the Global South: A systematic literature review. Urban. Sci. 2018, 2, 67. [Google Scholar] [CrossRef] [Green Version]
- Schüle, S.A.; Hilz, L.K.; Dreger, S.; Bolte, G. Social inequalities in environmental resources of green and blue spaces: A review of evidence in the WHO European region. Int. J. Environ. Res. Public Health 2019, 16, 1216. [Google Scholar] [CrossRef] [Green Version]
- Wolch, J.R.; Byrne, J.; Newell, J.P. Urban green space, public health, and environmental justice: The challenge of making cities ‘just green enough. ’ Landsc. Urban. Plan. 2014, 125, 234–244. [Google Scholar] [CrossRef] [Green Version]
- Giles-Corti, B.; Vernez-Moudon, A.; Reis, R.; Turrell, G.; Dannenberg, A.L.; Badland, H.; Foster, S.; Lowe, M.; Sallis, J.F.; Stevenson, M.; et al. City planning and population health: A global challenge. Lancet 2016, 388, 2912–2924. [Google Scholar] [CrossRef]
- Corburn, J. Confronting the challenges in reconnecting urban planning and public health. Am. J. Public Health 2004, 94, 541–546. [Google Scholar] [CrossRef]
- Allen, J.; Balfour, R. Natural Solutions for Tackling Health Inequalities: Realising the Opportunity; UCL Institute of Health Equity: London, UK, 2014. [Google Scholar]
- Robinson, O.; Tamayo, I.; de Castro, M.; Valentin, A.; Giorgis-Allemand, L.; Hjertager Krog, N.; Maitre, L.; McEachan, R.; Lepeule, J.; Ambros, A.; et al. The urban exposome during pregnancy and its socioeconomic determinants. Environ. Health Perspect. 2018, 126, 077005. [Google Scholar] [CrossRef]
- Robinette, J.W.; Charles, S.T.; Gruenewald, T.L. Neighborhood socioeconomic status and health: A longitudinal analysis. J. Community Health 2017, 42, 865–871. [Google Scholar] [CrossRef]
- Marmot, M.; Friel, S.; Bell, R.; Houweling, T.A.; Taylor, S. Closing the gap in a generation: Health equity through action on the social determinants of health. Lancet 2008, 372, 1661–1669. [Google Scholar] [CrossRef]
- Ruijsbroek, A.; Droomers, M.; Kruize, H.; Van Kempen, E.; Gidlow, C.J.; Hurst, G.; Andrusaityte, S.; Nieuwenhuijsen, M.J.; Maas, J.; Hardyns, W.; et al. Does the health impact of exposure to neighbourhood green space differ between population groups? An explorative study in four European cities. Int. J. Environ. Res. Public Health 2017, 14, 618. [Google Scholar] [CrossRef] [PubMed] [Green Version]
- Maas, J.; Verheij, R.A.; Spreeuwenberg, P.; Groenewegen, P.P. Physical activity as a possible mechanism behind the relationship between green space and health: A multilevel analysis. BMC Public Health 2008, 8, 206. [Google Scholar] [CrossRef] [Green Version]
- Loukaitou-Sideris, A.; Stieglitz, O. Children in Los Angeles parks: A study of equity, quality and children’s satisfaction with neighbourhood parks. Town Plan. Rev. 2002, 73, 467–488. [Google Scholar] [CrossRef]
- Romero, A.J. Low-income neighborhood barriers and resources for adolescents’ physical activity. J. Adolesc. Heal. 2005, 36, 253–259. [Google Scholar] [CrossRef]
- Cutts, B.B.; Darby, K.J.; Boone, C.G.; Brewis, A. City structure, obesity, and environmental justice: An integrated analysis of physical and social barriers to walkable streets and park access. Soc. Sci. Med. 2009, 69, 1314–1322. [Google Scholar] [CrossRef]
- Williams, T.G.; Logan, T.M.; Zuo, C.T.; Liberman, K.D.; Guikema, S.D. Parks and safety: A comparative study of green space access and inequity in five US cities. Landsc. Urban. Plan. 2020, 201, 103841. [Google Scholar] [CrossRef]
- Bai, H.; Stanis, S.A.W.; Kaczynski, A.T.; Besenyi, G.M. Perceptions of neighborhood park quality: Associations with physical activity and body mass index. Ann. Behav. Med. 2013, 45, 39–48. [Google Scholar] [CrossRef]
- Cohen, D.A.; Han, B.; Nagel, C.J.; Harnik, P.; McKenzie, T.L.; Evenson, K.R.; Marsh, T.; Williamson, S.; Vaughan, C.; Katta, S. The first national study of neighborhood parks: Implications for physical activity. Am. J. Prev. Med. 2016, 51, 419–426. [Google Scholar] [CrossRef] [PubMed] [Green Version]
- Coen, S.E.; Ross, N.A. Exploring the material basis for health: Characteristics of parks in Montreal neighborhoods with contrasting health outcomes. Heal. Place 2006, 4, 361–371. [Google Scholar] [CrossRef]
- Mackenbach, J.P.; Valverde, J.R.; Artnik, B.; Bopp, M.; Brønnum-Hansen, H.; Deboosere, P.; Kalediene, R.; Kovács, K.; Leinsalu, M.; Martikainen, P.; et al. Trends in health inequalities in 27 European countries. Proc. Natl. Acad. Sci. USA 2018, 115, 6440–6445. [Google Scholar] [CrossRef] [PubMed] [Green Version]
- Whitehead, M. The concepts and principles of equity and health. Int. J. Heal. Serv. 1992, 22, 429–445. [Google Scholar] [CrossRef]
- European Commission. Report on Health Inequalities in the European Union; European Commission: Brussels, Belgium, 2013. [Google Scholar]
- Tessum, C.W.; Apte, J.S.; Goodkind, A.L.; Muller, N.Z.; Mullins, K.A.; Paolella, D.A.; Polasky, S.; Springer, N.P.; Thakrar, S.K.; Marshall, J.D.; et al. Inequity in consumption widens racial-ethnic disparities in air pollution exposure. Proc. Natl. Acad. Sci. USA 2019, 116, 6001–6006. [Google Scholar] [CrossRef] [Green Version]
- WHO Regional Office for Europe Environment and Health Risks: A Review of the Influence and Effects of Social Inequalities; World Health Organization: Copenhagen, Denmark, 2010.
- Clark, L.P.; Millet, D.B.; Marshall, J.D. National patterns in environmental injustice and inequality: Outdoor NO2 air pollution in the United States. PLoS ONE 2014, 9, e94431. [Google Scholar] [CrossRef]
- Williams, D.R.; Lawrence, J.A.; Davis, B.A. Racism and health: Evidence and needed research. Annu. Rev. Public Health 2019, 40, 105–125. [Google Scholar] [CrossRef] [Green Version]
- Bailey, Z.D.; Krieger, N.; Agénor, M.; Graves, J.; Linos, N.; Bassett, M.T. Structural racism and health inequities in the USA: Evidence and interventions. Lancet 2017, 389, 1453–1463. [Google Scholar] [CrossRef]
- Jennings, V.; Baptiste, A.K.; Osborne Jelks, N.; Skeete, R. Urban green space and the pursuit of health equity in parts of the United States. Int. J. Environ. Res. Public Health 2017, 14, 1432. [Google Scholar] [CrossRef] [PubMed] [Green Version]
- Isaacs, K.P.; Choudhury, S. The Growing Gap in Life Expectancy by Income: Recent Evidence and Implications for the Social Security Retirement Age; Congressional Research Service: Washington, DC, USA, 2017. [Google Scholar]
- Solé-Auró, A.; Crimmins, E.M. Health of immigrants in European countries. Int. Migr. Rev. 2008, 42, 861–876. [Google Scholar] [CrossRef] [Green Version]
- Snijder, M.B.; Galenkamp, H.; Prins, M.; Derks, E.M.; Peters, R.J.G.; Zwinderman, A.H.; Stronks, K. Cohort profile: The Healthy Life in an Urban Setting (HELIUS) study in Amsterdam, the Netherlands. BMJ Open 2017, 7, e017873. [Google Scholar] [CrossRef] [PubMed] [Green Version]
- Wang, Y.J.; Chen, X.P.; Chen, W.J.; Zhang, Z.L.; Zhou, Y.P.; Jia, Z. Ethnicity and health inequalities: An empirical study based on the 2010 China survey of social change (CSSC) in Western China. BMC Public Health 2020, 20, 637. [Google Scholar] [CrossRef]
- Morgen, C.S.; Bjørk, C.; Andersen, P.K.; Mortensen, L.H.; Nybo Andersen, A.M. Socioeconomic position and the risk of preterm birth—A study within the Danish National Birth Cohort. Int. J. Epidemiol. 2008, 37, 1109–1120. [Google Scholar] [CrossRef] [PubMed] [Green Version]
- Benatar, S. The challenges of health disparities in South Africa. S. Afr. Med. J. 2013, 103, 154–155. [Google Scholar] [CrossRef]
- Moher, D.; Liberati, A.; Tetzlaff, J.; Altman, D.G.; Altman, D.; Antes, G.; Atkins, D.; Barbour, V.; Barrowman, N.; Berlin, J.A.; et al. Preferred reporting items for systematic reviews and meta-analyses: The PRISMA statement. PLoS Med. 2009, 6, e1000097. [Google Scholar] [CrossRef] [PubMed] [Green Version]
- Jennings, V.; Browning, M.H.E.M.; Rigolon, A. Urban. Green Spaces—Public Health and Sustainabilty in the United States; Springer: Basel, Switzerland, 2019. [Google Scholar]
- Browning, M.H.E.M.; Rigolon, A. School green space and its impact on academic performance: A systematic literature review. Int. J. Environ. Res. Public Health 2019, 16, 429. [Google Scholar] [CrossRef] [PubMed] [Green Version]
- Collins, R.M.; Spake, R.; Brown, K.A.; Ogutu, B.O.; Smith, D.; Eigenbrod, F. A systematic map of research exploring the effect of greenspace on mental health. Landsc. Urban. Plan. 2020, 201, 103823. [Google Scholar] [CrossRef]
- Taylor, L.; Hochuli, D.F. Defining greenspace: Multiple uses across multiple disciplines. Landsc. Urban. Plan. 2017, 158, 25–38. [Google Scholar] [CrossRef] [Green Version]
- Labib, S.M.; Lindley, S.; Huck, J.J. Scale effects in remotely sensed greenspace metrics and how to mitigate them for environmental health exposure assessment. Comput. Environ. Urban. Syst. 2020, 82, 101501. [Google Scholar] [CrossRef]
- Helbich, M.; O’Connor, R.C.; Nieuwenhuijsen, M.; Hagedoorn, P. Greenery exposure and suicide mortality later in life: A longitudinal register-based case-control study. Environ. Int. 2020, 143, 105982. [Google Scholar] [CrossRef]
- Lahart, I.; Darcy, P.; Gidlow, C.; Calogiuri, G. The effects of green exercise on physical and mental wellbeing: A systematic review. Int. J. Environ. Res. Public Health 2019, 16, 1352. [Google Scholar] [CrossRef] [Green Version]
- Son, J.Y.; Liu, J.C.; Bell, M.L. Temperature-related mortality: A systematic review and investigation of effect modifiers. Environ. Res. Lett. 2019, 14, 073004. [Google Scholar] [CrossRef]
- Radke, E.G.; Glenn, B.; Galizia, A.; Persad, A.; Nachman, R.; Bateson, T.; Wright, J.M.; Navas-Acien, A.; Arroyave, W.D.; Puett, R.C.; et al. Development of outcome-specific criteria for study evaluation in systematic reviews of epidemiology studies. Environ. Int. 2019, 130, 104884. [Google Scholar] [CrossRef] [PubMed]
- Radke, E.G.; Braun, J.M.; Nachman, R.M.; Cooper, G.S. Phthalate exposure and neurodevelopment: A systematic review and meta-analysis of human epidemiological evidence. Environ. Int. 2020, 137, 105408. [Google Scholar] [CrossRef] [PubMed]
- R Core Team. R: A Language and Environment for Statistical Computing; R Core Team: Vienna, Austria, 2020. [Google Scholar]
- Leech, N.L.; Barrett, K.C.; Morgan, G.A. IBM SPSS for Intermediate Statistics: Use and Interpretation, 4th ed.; Routledge: New York, NY, USA, 2011. [Google Scholar]
- Maxwell, S.E.; Delaney, H.D. Designing Experiments and Analyzing Data: A Model. Comparison Perspective, 2nd ed.; Psychology Press: New York, NY, USA, 2004. [Google Scholar]
- Hsu, J.C. Multiple Comparisons: Theory and Methods; Chapman & Hall/CRC: Boca Raton, FL, USA, 1996. [Google Scholar]
- West, L.J.; Hankin, R.K.S. Exact tests for two-way contingency tables with structural zeros. J. Stat. Softw. 2008, 28, 1–19. [Google Scholar] [CrossRef] [Green Version]
- Talen, E. Neighborhoods as service providers: A methodology for evaluating pedestrian access. Environ. Plan. B Plan. Des. 2003, 30, 181–200. [Google Scholar] [CrossRef]
- Labib, S.M.; Lindley, S.; Huck, J.J. Spatial dimensions of the influence of urban green-blue spaces on human health: A systematic review. Environ. Res. 2020, 180, 108869. [Google Scholar] [CrossRef]
- Abelt, K.; McLafferty, S. Green streets: Urban green and birth outcomes. Int. J. Environ. Res. Public Health 2017, 14, 771. [Google Scholar] [CrossRef] [Green Version]
- Agay-Shay, K.; Peled, A.; Crespo, A.V.; Peretz, C.; Amitai, Y.; Linn, S.; Friger, M.; Nieuwenhuijsen, M.J. Green spaces and adverse pregnancy outcomes. Occup. Environ. Med. 2014, 71, 562–569. [Google Scholar] [CrossRef]
- Agay-Shay, K.; Michael, Y.; Basagaña, X.; Martínez-Solanas, È.; Broday, D.; Lensky, I.M.; Rudolf, M.; Rubin, L.; Kent, R.; Levy, N.; et al. Mean and variance of greenness and pregnancy outcomes in Tel Aviv during 2000-14: Longitudinal and cross-sectional approaches. Int. J. Epidemiol. 2019, 48, 1054–1072. [Google Scholar] [CrossRef]
- Agyemang, C.; Van Hooijdonk, C.; Wendel-Vos, W.; Ujcic-Voortman, J.K.; Lindeman, E.; Stronks, K.; Droomers, M. Ethnic differences in the effect of environmental stressors on blood pressure and hypertension in the Netherlands. BMC Public Health 2007, 7, 118. [Google Scholar] [CrossRef] [PubMed] [Green Version]
- Alexander, D.S.; Huber, L.R.B.; Piper, C.R.; Tanner, A.E. The association between recreational parks, facilities and childhood obesity: A cross-sectional study of the 2007 National Survey of Children’s Health. J. Epidemiol. Community Health 2013, 67, 427–431. [Google Scholar] [CrossRef] [PubMed] [Green Version]
- Astell-Burt, T.; Feng, X.; Kolt, G.S. Is neighborhood green space associated with a lower risk of type 2 diabetes? Evidence from 267,072 Australians. Diabetes Care 2014, 37, 197–201. [Google Scholar] [CrossRef] [PubMed] [Green Version]
- Björk, J.; Albin, M.; Grahn, P.; Jacobsson, H.; Ardö, J.; Wadbro, J.; Ostergren, P.O. Recreational values of the natural environment in relation to neighbourhood satisfaction, physical activity, obesity and wellbeing. J. Epidemiol. Community Health 2008, 62, e2. [Google Scholar] [CrossRef] [PubMed]
- Brindley, P.; Jorgensen, A.; Maheswaran, R. Domestic gardens and self-reported health: A national population study. Int. J. Health Geogr. 2018, 17, 31. [Google Scholar] [CrossRef] [PubMed] [Green Version]
- Brown, S.C.; Lombard, J.; Wang, K.; Byrne, M.M.; Toro, M.; Plater-Zyberk, E.; Feaster, D.J.; Kardys, J.; Nardi, M.I.; Perez-Gomez, G.; et al. Neighborhood greenness and chronic health conditions in medicare beneficiaries. Am. J. Prev. Med. 2016, 51, 78–89. [Google Scholar] [CrossRef] [PubMed]
- Browning, M.H.E.M.; Rigolon, A. Do income, race and ethnicity, and sprawl influence the greenspace-human health link in city-level analyses? Findings from 496 cities in the United States. Int. J. Environ. Res. Public Health 2018, 15, 1541. [Google Scholar] [CrossRef] [Green Version]
- Casey, J.A.; James, P.; Rudolph, K.E.; Wu, C.D.; Schwartz, B.S. Greenness and birth outcomes in a range of Pennsylvania communities. Int. J. Environ. Res. Public Health 2016, 13, 311. [Google Scholar] [CrossRef]
- Coppel, G.; Wüstemann, H. The impact of urban green space on health in Berlin, Germany: Empirical findings and implications for urban planning. Landsc. Urban. Plan. 2017, 167, 410–418. [Google Scholar] [CrossRef]
- Crouse, D.L.; Pinault, L.; Balram, A.; Hystad, P.; Peters, P.A.; Chen, H.; van Donkelaar, A.; Martin, R.V.; Ménard, R.; Robichaud, A.; et al. Urban greenness and mortality in Canada’s largest cities: A national cohort study. Lancet Planet. Heal. 2017, 1, e289–e297. [Google Scholar] [CrossRef]
- Cummins, S.; Fagg, J. Does greener mean thinner? Associations between neighbourhood greenspace and weight status among adults in England. Int. J. Obes. 2012, 36, 1108–1113. [Google Scholar] [CrossRef] [Green Version]
- Cusack, L.; Larkin, A.; Carozza, S.E.; Hystad, P. Associations between multiple green space measures and birth weight across two US cities. Heal. Place 2017, 47, 36–43. [Google Scholar] [CrossRef] [PubMed]
- Cusack, L.; Larkin, A.; Carozza, S.E.; Hystad, P. Associations between residential greenness and birth outcomes across Texas. Environ. Res. 2017, 152, 88–95. [Google Scholar] [CrossRef] [PubMed]
- Cusack, L.; Sbihi, H.; Larkin, A.; Chow, A.; Brook, J.R.; Moraes, T.; Mandhane, P.J.; Becker, A.B.; Azad, M.B.; Subbarao, P.; et al. Residential green space and pathways to term birth weight in the Canadian Healthy Infant Longitudinal Development (CHILD) Study. Int. J. Health Geogr. 2018, 17, 43. [Google Scholar] [CrossRef] [PubMed]
- Da Silveira, I.H.; Junger, W.L. Green spaces and mortality due to cardiovascular diseases in the city of Rio de Janeiro. Rev. Saude Publica 2018, 52, 49. [Google Scholar] [CrossRef] [Green Version]
- Dadvand, P.; de Nazelle, A.; Figueras, F.; Basagaña, X.; Su, J.; Amoly, E.; Jerrett, M.; Vrijheid, M.; Sunyer, J.; Nieuwenhuijsen, M.J. Green space, health inequality and pregnancy. Environ. Int. 2012, 40, 110–115. [Google Scholar] [CrossRef]
- Dadvand, P.; Sunyer, J.; Basagaña, X.; Ballester, F.; Lertxundi, A.; Fernández-Somoano, A.; Estarlich, M.; García-Esteban, R.; Mendez, M.A.; Nieuwenhuijsen, M.J. Surrounding greenness and pregnancy outcomes in four Spanish birth cohorts. Environ. Health Perspect. 2012, 120, 1481–1487. [Google Scholar] [CrossRef]
- Dadvand, P.; Villanueva, C.M.; Font-Ribera, L.; Martinez, D.; Basagaña, X.; Belmonte, J.; Vrijheid, M.; Gražuleviciene, R.; Kogevinas, M.; Nieuwenhuijsen, M.J. Risks and benefits of green spaces for children: A cross-sectional study of associations with sedentary behavior, obesity, asthma, and allergy. Environ. Health Perspect. 2014, 122, 1329–1336. [Google Scholar] [CrossRef]
- Dadvand, P.; Wright, J.; Martinez, D.; Basagaña, X.; McEachan, R.R.C.; Cirach, M.; Gidlow, C.J.; de Hoogh, K.; Gražulevičienė, R.; Nieuwenhuijsen, M.J. Inequality, green spaces, and pregnant women: Roles of ethnicity and individual and neighbourhood socioeconomic status. Environ. Int. 2014, 71, 101–108. [Google Scholar] [CrossRef]
- Dadvand, P.; Poursafa, P.; Heshmat, R.; Motlagh, M.E.; Qorbani, M.; Basagaña, X.; Kelishadi, R. Use of green spaces and blood glucose in children; a population-based CASPIAN-V study. Environ. Pollut. 2018, 243, 1134–1140. [Google Scholar] [CrossRef] [PubMed]
- D’Agostino, E.M.; Patel, H.H.; Ahmed, Z.; Hansen, E.; Sunil Mathew, M.; Nardi, M.I.; Messiah, S.E. Impact of change in neighborhood racial/ethnic segregation on cardiovascular health in minority youth attending a park-based afterschool program. Soc. Sci. Med. 2018, 205, 116–129. [Google Scholar] [CrossRef] [PubMed]
- D’Agostino, E.M.; Patel, H.H.; Hansen, E.; Mathew, M.S.; Nardi, M.; Messiah, S.E. Longitudinal analysis of cardiovascular disease risk profile in neighbourhood poverty subgroups: 5-year results from an afterschool fitness programme in the USA. J. Epidemiol. Community Health 2018, 72, 193–201. [Google Scholar] [CrossRef]
- Dalton, A.M.; Jones, A.P.; Sharp, S.J.; Cooper, A.J.M.; Griffin, S.; Wareham, N.J. Residential neighbourhood greenspace is associated with reduced risk of incident diabetes in older people: A prospective cohort study. BMC Public Health 2016, 16, 1171. [Google Scholar] [CrossRef] [Green Version]
- De Keijzer, C.; Agis, D.; Ambrós, A.; Arévalo, G.; Baldasano, J.M.; Bande, S.; Barrera-Gómez, J.; Benach, J.; Cirach, M.; Dadvand, P.; et al. The association of air pollution and greenness with mortality and life expectancy in Spain: A small-area study. Environ. Int. 2017, 99, 170–176. [Google Scholar] [CrossRef]
- De Vries, S.; Verheij, R.A.; Groenewegen, P.P.; Spreeuwenberg, P. Natural environments—Healthy environments? An exploratory analysis of the relationship between greenspace and health. Environ. Plan. A 2003, 35, 1717–1731. [Google Scholar] [CrossRef] [Green Version]
- Demoury, C.; Thierry, B.; Richard, H.; Sigler, B.; Kestens, Y.; Parent, M.E. Residential greenness and risk of prostate cancer: A case-control study in Montreal, Canada. Environ. Int. 2017, 98, 129–136. [Google Scholar] [CrossRef]
- Donovan, G.H.; Butry, D.T.; Michael, Y.L.; Prestemon, J.P.; Liebhold, A.M.; Gatziolis, D.; Mao, M.Y. The relationship between trees and human health: Evidence from the spread of the emerald ash borer. Am. J. Prev. Med. 2013, 44, 139–145. [Google Scholar] [CrossRef]
- Donovan, G.H.; Gatziolis, D.; Longley, I.; Douwes, J. Vegetation diversity protects against childhood asthma: Results from a large New Zealand birth cohort. Nat. Plants 2018, 4, 358–364. [Google Scholar] [CrossRef] [PubMed]
- Dzhambov, A.M.; Markevych, I.; Lercher, P. Greenspace seems protective of both high and low blood pressure among residents of an Alpine valley. Environ. Int. 2018, 121, 443–452. [Google Scholar] [CrossRef] [PubMed]
- Ebisu, K.; Holford, T.R.; Bell, M.L. Association between greenness, urbanicity, and birth weight. Sci. Total Environ. 2016, 542, 750–756. [Google Scholar] [CrossRef] [Green Version]
- Egorov, A.I.; Griffin, S.M.; Converse, R.R.; Styles, J.N.; Sams, E.A.; Wilson, A.; Jackson, L.E.; Wade, T.J. Vegetated land cover near residence is associated with reduced allostatic load and improved biomarkers of neuroendocrine, metabolic and immune functions. Environ. Res. 2017, 158, 508–521. [Google Scholar] [CrossRef]
- Eldeirawi, K.; Kunzweiler, C.; Zenk, S.; Finn, P.; Nyenhuis, S.; Rosenberg, N.; Persky, V. Associations of urban greenness with asthma and respiratory symptoms in Mexican American children. Ann. Allergy Asthma Immunol. 2019, 122, 289–295. [Google Scholar] [CrossRef]
- Fan, M.; Jin, Y. Do neighborhood parks and playgrounds reduce childhood obesity? Am. J. Agric. Econ. 2014, 96, 26–42. [Google Scholar] [CrossRef]
- Fong, K.C.; Kloog, I.; Coull, B.A.; Koutrakis, P.; Laden, F.; Schwartz, J.D.; James, P. Residential greenness and birthweight in the state of Massachusetts, USA. Int. J. Environ. Res. Public Health 2018, 15, 1248. [Google Scholar] [CrossRef] [PubMed] [Green Version]
- Foster, B.A.; Weinstein, K. Moderating effects of components of resilience on obesity across income strata in the National Survey of Children’s Health. Acad. Pediatr. 2019, 19, 58–66. [Google Scholar] [CrossRef] [PubMed]
- Gidlow, C.J.; Smith, G.; Martinez, D.; Wilson, R.; Trinder, P.; Gražulevičiene, R.; Nieuwenhuijsen, M.J. Research note: Natural environments and prescribing in England. Landsc. Urban. Plan. 2016, 151, 103–108. [Google Scholar] [CrossRef]
- Glazer, K.B.; Eliot, M.N.; Danilack, V.A.; Carlson, L.; Phipps, M.G.; Dadvand, P.; Savitz, D.A.; Wellenius, G.A. Residential green space and birth outcomes in a coastal setting. Environ. Res. 2018, 163, 97–107. [Google Scholar] [CrossRef]
- Groenewegen, P.P.; Zock, J.P.; Spreeuwenberg, P.; Helbich, M.; Hoek, G.; Ruijsbroek, A.; Strak, M.; Verheij, R.; Volker, B.; Waverijn, G.; et al. Neighbourhood social and physical environment and general practitioner assessed morbidity. Heal. Place 2018, 49, 68–84. [Google Scholar] [CrossRef] [PubMed]
- Hobbs, M.; Green, M.A.; Griffiths, C.; Jordan, H.; Saunders, J.; Grimmer, H.; McKenna, J. Access and quality of parks and associations with obesity: A cross-sectional study. SSM Popul. Heal. 2017, 3, 722–729. [Google Scholar] [CrossRef] [PubMed]
- Hobbs, M.; Griffiths, C.; Green, M.A.; Jordan, H.; Saunders, J.; McKenna, J. Associations between the combined physical activity environment, socioeconomic status, and obesity: A cross-sectional study. Perspect. Public Health 2018, 138, 169–172. [Google Scholar] [CrossRef]
- Hughey, S.M.; Kaczynski, A.T.; Child, S.; Moore, J.B.; Porter, D.; Hibbert, J. Green and lean: Is neighborhood park and playground availability associated with youth obesity? Variations by gender, socioeconomic status, and race/ethnicity. Prev. Med. 2017, 95, S101–S108. [Google Scholar] [CrossRef] [PubMed]
- Hystad, P.; Davies, H.W.; Frank, L.; Van Loon, J.; Gehring, U.; Tamburic, L.; Brauer, M. Residential Greenness and Birth Outcomes: Evaluating the Influence of Spatially Correlated Built-Environment Factors. Environ. Health Perspect. 2014, 122, 1095–1102. [Google Scholar] [CrossRef] [PubMed] [Green Version]
- James, P.; Hart, J.E.; Banay, R.F.; Laden, F. Exposure to greenness and mortality in a nationwide prospective cohort study of women. Environ. Health Perspect. 2016, 124, 1344–1352. [Google Scholar] [CrossRef] [Green Version]
- Ji, J.S.; Zhu, A.; Bai, C.; Wu, C.D.; Yan, L.; Tang, S.; Zeng, Y.; James, P. Residential greenness and mortality in oldest-old women and men in China: A longitudinal cohort study. Lancet Planet. Heal. 2019, 3, e17–e25. [Google Scholar] [CrossRef] [Green Version]
- Jilcott Pitts, S.B.; Edwards, M.B.; Moore, J.B.; Shores, K.A.; Dubose Drowatzky, K.; McGranahan, D. Obesity is inversely associated with natural amenities and recreation facilities per capita. J. Phys. Act. Health 2013, 10, 1032–1038. [Google Scholar] [CrossRef]
- Kihal-Talantikite, W.; Padilla, C.M.; Lalloué, B.; Gelormini, M.; Zmirou-Navier, D.; Deguen, S. Green space, social inequalities and neonatal mortality in France. BMC Pregnancy Childbirth 2013, 13, 191. [Google Scholar] [CrossRef] [PubMed] [Green Version]
- Kling, H.E.; D’Agostino, E.M.; Booth, J.V.; Patel, H.; Hansen, E.; Mathew, M.S.; Messiah, S.E. The effect of a park-based physical activity program on cardiovascular, strength, and mobility outcomes among a sample of racially/ethnically diverse adults aged 55 or older. Prev. Chronic Dis. 2018, 15, E166. [Google Scholar] [CrossRef]
- Lachowycz, K.; Jones, A.P. Does walking explain associations between access to greenspace andlower mortality? Soc. Sci. Med. 2014, 107, 9–17. [Google Scholar] [CrossRef]
- Lovasi, G.S.; Bader, M.D.M.; Quinn, J.; Neckerman, K.M.; Weiss, C.; Rundle, A. Body mass index, safety hazards, and neighborhood attractiveness. Am. J. Prev. Med. 2012, 43, 378–384. [Google Scholar] [CrossRef] [Green Version]
- Maas, J.; Verheij, R.A.; Groenewegen, P.P.; De Vries, S.; Spreeuwenberg, P.P. Green space, urbanity, and health: How strong is the relation? J. Epidemiol. Community Health 2006, 60, 587–592. [Google Scholar] [CrossRef] [PubMed] [Green Version]
- Maas, J.; Verheij, R.A.; De Vries, S.; Spreeuwenberg, P.; Schellevis, F.G.; Groenewegen, P.P. Morbidity is related to a green living environment. J. Epidemiol. Community Health 2009, 63, 967–973. [Google Scholar] [CrossRef] [PubMed] [Green Version]
- Markevych, I.; Fuertes, E.; Tiesler, C.M.T.; Birk, M.; Bauer, C.P.; Koletzko, S.; von Berg, A.; Berdel, D.; Heinrich, J. Surrounding greenness and birth weight: Results from the GINIplus and LISAplus birth cohorts in Munich. Heal. Place 2014, 26, 39–46. [Google Scholar] [CrossRef] [PubMed]
- Mena, C.; Fuentes, E.; Ormazábal, Y.; Palomo-Vélez, G.; Palomo, I. Role of access to parks and markets with anthropometric measurements, biological markers, and a healthy lifestyle. Int. J. Environ. Health Res. 2015, 25, 373–383. [Google Scholar] [CrossRef]
- Mitchell, R.; Popham, F. Effect of exposure to natural environment on health inequalities: An observational population study. Lancet 2008, 372, 1655–1660. [Google Scholar] [CrossRef] [Green Version]
- Mueller, N.; Rojas-Rueda, D.; Khreis, H.; Cirach, M.; Milà, C.; Espinosa, A.; Foraster, M.; McEachan, R.R.C.; Kelly, B.; Wright, J.; et al. Socioeconomic inequalities in urban and transport planning related exposures and mortality: A health impact assessment study for Bradford, UK. Environ. Int. 2018, 121, 931–941. [Google Scholar] [CrossRef]
- Nichani, V.; Dirks, K.; Burns, B.; Bird, A.; Morton, S.; Grant, C. Green space and pregnancy outcomes: Evidence from Growing Up in New Zealand. Heal. Place 2017, 46, 21–28. [Google Scholar] [CrossRef]
- Nieuwenhuijsen, M.J.; Gascon, M.; Martinez, D.; Ponjoan, A.; Blanch, J.; Garcia-Gil, M.D.M.; Ramos, R.; Foraster, M.; Mueller, N.; Espinosa, A.; et al. Air pollution, noise, blue space, and green space and premature mortality in Barcelona: A mega cohort. Int. J. Environ. Res. Public Health 2018, 15, 2405. [Google Scholar] [CrossRef] [Green Version]
- Orioli, R.; Antonucci, C.; Scortichini, M.; Cerza, F.; Marando, F.; Ancona, C.; Manes, F.; Davoli, M.; Michelozzi, P.; Forastiere, F.; et al. Exposure to residential greenness as a predictor of cause-specific mortality and stroke incidence in the rome longitudinal study. Environ. Health Perspect. 2019, 127, 027002. [Google Scholar] [CrossRef] [Green Version]
- Persson, A.; Pyko, A.; Lind, T.; Bellander, T.; Östenson, C.G.; Pershagen, G.; Eriksson, C.; Lõhmus, M. Urban residential greenness and adiposity: A cohort study in Stockholm County. Environ. Int. 2018, 121, 832–841. [Google Scholar] [CrossRef]
- Petraviciene, I.; Grazuleviciene, R.; Andrusaityte, S.; Dedele, A.; Nieuwenhuijsen, M.J. Impact of the social and natural environment on preschool-age children weight. Int. J. Environ. Res. Public Health 2018, 15, 449. [Google Scholar] [CrossRef] [PubMed] [Green Version]
- Pun, V.C.; Manjourides, J.; Suh, H.H. Association of neighborhood greenness with self-perceived stress, depression and anxiety symptoms in older U.S adults. Environ. Heal. A Glob. Access Sci. Source 2018, 17, 39. [Google Scholar] [CrossRef] [PubMed] [Green Version]
- Reid, C.E.; Clougherty, J.E.; Shmool, J.L.C.; Kubzansky, L.D. Is all urban green space the same? A comparison of the health benefits of trees and grass in New York city. Int. J. Environ. Res. Public Health 2017, 14, 1411. [Google Scholar] [CrossRef] [PubMed] [Green Version]
- Richardson, E.A.; Shortt, N.K.; Mitchell, R.; Pearce, J. A sibling study of whether maternal exposure to different types of natural space is related to birthweight. Int. J. Epidemiol. 2018, 47, 146–155. [Google Scholar] [CrossRef] [Green Version]
- Rossi, C.E.; Correa, E.N.; das Neves, J.; Gabriel, C.G.; Benedet, J.; Rech, C.R.; de Assis Guedas de Vasconcelos, F. Body mass index and association with use of and distance from places for physical activity and active leisure among schoolchildren in Brazil. Cross-sectional study. Sao Paulo Med. J. 2018, 136, 228–236. [Google Scholar] [CrossRef] [Green Version]
- Rossi, C.E.; De Fragas, H.P.; Corrêa, E.N.; Das Neves, J.; De Assis Guedes De Vasconcelos, F. Association between food, physical activity, and social assistance environments and the body mass index of schoolchildren from different socioeconomic strata. J. Public Health 2019, 41, E25–E34. [Google Scholar] [CrossRef]
- Sarkar, C. Residential greenness and adiposity: Findings from the UK Biobank. Environ. Int. 2017, 106, 1–10. [Google Scholar] [CrossRef] [Green Version]
- Schalkwijk, A.A.H.; Van Der Zwaard, B.C.; Nijpels, G.; Elders, P.J.M.; Platt, L. The impact of greenspace and condition of the neighbourhood on child overweight. Eur. J. Public Health 2018, 28, 88–94. [Google Scholar] [CrossRef] [Green Version]
- Schuler, B.R.; O’Reilly, N. Child development and the community environment: Understanding overweight across the income gradient. Child. Obes. 2017, 13, 479–489. [Google Scholar] [CrossRef]
- Seo, S.; Choi, S.; Kim, K.; Kim, S.M.; Park, S.M. Association between urban green space and the risk of cardiovascular disease: A longitudinal study in seven Korean metropolitan areas. Environ. Int. 2019, 125, 51–57. [Google Scholar] [CrossRef]
- Singh, G.K.; Siahpush, M.; Kogan, M.D. Neighborhood socioeconomic conditions, built environments, and childhood obesity. Health Aff. 2010, 29, 503–512. [Google Scholar] [CrossRef] [Green Version]
- Sullivan, S.M.; Brashear, M.M.; Broyles, S.T.; Rung, A.L. Neighborhood environments and obesity among Afro-Caribbean, African American, and Non-Hispanic white adults in the United States: Results from the National Survey of American Life. Prev. Med. 2014, 61, 1–5. [Google Scholar] [CrossRef] [PubMed]
- Thiering, E.; Markevych, I.; Brüske, I.; Fuertes, E.; Kratzsch, J.; Sugiri, D.; Hoffmann, B.; Von Berg, A.; Bauer, C.P.; Koletzko, S.; et al. Associations of residential long-term air pollution exposures and satellite-derived greenness with insulin resistance in German adolescents. Environ. Health Perspect. 2016, 124, 1291–1298. [Google Scholar] [CrossRef] [Green Version]
- Triguero-Mas, M.; Dadvand, P.; Cirach, M.; Martínez, D.; Medina, A.; Mompart, A.; Basagaña, X.; Gražulevičiene, R.; Nieuwenhuijsen, M.J. Natural outdoor environments and mental and physical health: Relationships and mechanisms. Environ. Int. 2015, 77, 35–41. [Google Scholar] [CrossRef] [Green Version]
- Van Der Zwaard, B.C.; Schalkwijk, A.A.H.; Elders, P.J.M.; Platt, L.; Nijpels, G. Does environment influence childhood BMI? A longitudinal analysis of children aged 3-11. J. Epidemiol. Community Health 2018, 72, 1110–1116. [Google Scholar] [CrossRef] [PubMed]
- Vienneau, D.; de Hoogh, K.; Faeh, D.; Kaufmann, M.; Wunderli, J.M.; Röösli, M. The SNC Study Group More than clean air and tranquillity: Residential green is independently associated with decreasing mortality. Environ. Int. 2017, 108, 176–184. [Google Scholar] [CrossRef] [PubMed]
- Villeneuve, P.J.; Jerrett, M.; Su, J.G.; Burnett, R.T.; Chen, H.; Wheeler, A.J.; Goldberg, M.S. A cohort study relating urban green space with mortality in Ontario, Canada. Environ. Res. 2012, 115, 51–58. [Google Scholar] [CrossRef] [PubMed]
- Villeneuve, P.J.; Jerrett, M.; Su, J.G.; Weichenthal, S.; Sandler, D.P. Association of residential greenness with obesity and physical activity in a US cohort of women. Environ. Res. 2018, 160, 372–384. [Google Scholar] [CrossRef] [PubMed]
- Wang, Q.; Lan, Z. Park green spaces, public health and social inequalities: Understanding the interrelationships for policy implications. Land Use Policy 2019, 83, 66–74. [Google Scholar] [CrossRef]
- Wen, M.; Kowaleski-Jones, L. The built environment and risk of obesity in the United States: Racial-ethnic disparities. Health Place 2012, 18, 1314–1322. [Google Scholar] [CrossRef] [Green Version]
- Wilker, E.H.; Wu, C.D.; McNeely, E.; Mostofsky, E.; Spengler, J.; Wellenius, G.A.; Mittleman, M.A. Green space and mortality following ischemic stroke. Environ. Res. 2014, 133, 42–48. [Google Scholar] [CrossRef] [Green Version]
- Wu, J.; Rappazzo, K.M.; Simpson, R.J.; Joodi, G.; Pursell, I.W.; Mounsey, J.P.; Cascio, W.E.; Jackson, L.E. Exploring links between greenspace and sudden unexpected death: A spatial analysis. Environ. Int. 2018, 113, 114–121. [Google Scholar] [CrossRef]
- Xu, L.; Ren, C.; Yuan, C.; Nichol, J.E.; Goggins, W.B. An ecological study of the association between area-level green space and adult mortality in Hong Kong. Climate 2017, 5, 55. [Google Scholar] [CrossRef] [Green Version]
- Yang, B.-Y.; Markevych, I.; Bloom, M.S.; Heinrich, J.; Guo, Y.; Morawska, L.; Dharmage, S.C.; Knibbs, L.D.; Jalaludin, B.; Jalava, P.; et al. Community greenness, blood pressure, and hypertension in urban dwellers: The 33 Communities Chinese Health Study. Environ. Int. 2019, 126, 727–734. [Google Scholar] [CrossRef]
- Yang, B.-Y.; Markevych, I.; Heinrich, J.; Bowatte, G.; Bloom, M.S.; Guo, Y.; Dharmage, S.C.; Jalaludin, B.; Knibbs, L.D.; Morawska, L.; et al. Associations of greenness with diabetes mellitus and glucose-homeostasis markers: The 33 Communities Chinese Health Study. Int. J. Hyg. Environ. Health 2019, 222, 283–290. [Google Scholar] [CrossRef] [Green Version]
- Yeager, R.; Riggs, D.W.; DeJarnett, N.; Tollerud, D.J.; Wilson, J.; Conklin, D.J.; O’Toole, T.E.; McCracken, J.; Lorkiewicz, P.; Xie, Z.; et al. Association between residential greenness and cardiovascular disease risk. J. Am. Heart Assoc. 2018, 7, e009117. [Google Scholar] [CrossRef]
- Yitshak-Sade, M.; James, P.; Kloog, I.; Hart, J.E.; Schwartz, J.D.; Laden, F.; Lane, K.J.; Fabian, M.P.; Fong, K.C.; Zanobetti, A. Neighborhood greenness attenuates the adverse effect of PM2.5 on cardiovascular mortality in neighborhoods of lower socioeconomic status. Int. J. Environ. Res. Public Health 2019, 16, 814. [Google Scholar] [CrossRef] [Green Version]
- Marselle, M.R.; Hartig, T.; Cox, D.T.C.; de Bell, S.; Knapp, S.; Lindley, S.; Triguero-Mas, M.; Böhning-Gaese, K.; Braubach, M.; Cook, P.A.; et al. Pathways linking biodiversity to human health: A conceptual framework. Environ. Int. 2021, 150, 106420. [Google Scholar] [CrossRef] [PubMed]
- Chiabai, A.; Quiroga, S.; Martinez-Juarez, P.; Suárez, C.; García de Jalón, S.; Taylor, T. Exposure to green areas: Modeling health benefits in a context of study heterogeneity. Ecol. Econ. 2020, 167, 106401. [Google Scholar] [CrossRef]
- Asri, A.K.; Yu, C.P.; Pan, W.C.; Guo, Y.L.; Su, H.J.; Lung, S.C.C.; Wu, C.D.; Spengler, J.D. Global greenness in relation to reducing the burden of cardiovascular diseases: Ischemic heart disease and stroke. Environ. Res. Lett. 2020, 15, 124003. [Google Scholar] [CrossRef]
- Jones, A.P.; Brainard, J.; Bateman, I.J.; Lovett, A.A. Equity of access to public parks in Birmingham, England. Environ. Res. J. 2009, 3, 237–256. [Google Scholar]
- Jones, A.P.; Hillsdon, M.; Coombes, E. Greenspace access, use, and physical activity: Understanding the effects of area deprivation. Prev. Med. 2009, 49, 500–505. [Google Scholar] [CrossRef] [PubMed] [Green Version]
- Cohen, D.A.; Inagami, S.; Finch, B. The built environment and collective efficacy. Heal. Place 2008, 14, 198–208. [Google Scholar] [CrossRef] [Green Version]
- Larson, L.R.; Jennings, V.; Cloutier, S.A. Public parks and wellbeing in urban areas of the United States. PLoS ONE 2016, 11, e0153211. [Google Scholar] [CrossRef]
- Cronan, M.K.; Shinew, K.J.; Stodolska, M. Trail use among Latinos: Recognizing diverse uses among a specific population. J. Park Recreat. Adm. 2008, 26, 62–86. [Google Scholar]
- Gobster, P.H. Managing urban parks for a racially and ethnically diverse clientele. Leis. Sci. 2002, 24, 143–159. [Google Scholar] [CrossRef]
- Hordyk, S.R.; Hanley, J.; Richard, É. “Nature is there; its free”: Urban greenspace and the social determinants of health of immigrant families. Heal. Place 2015, 34, 74–82. [Google Scholar] [CrossRef]
- Browning, M.H.E.M.; Lee, K. Within what distance does “greenness” best predict physical health? A systematic review of articles with gis buffer analyses across the lifespan. Int. J. Environ. Res. Public Health 2017, 14, 675. [Google Scholar] [CrossRef] [Green Version]
- Yang, Y.; Diez-Roux, A.V. Walking distance by trip purpose and population subgroups. Am. J. Prev. Med. 2012, 43, 11–19. [Google Scholar] [CrossRef] [PubMed] [Green Version]
- Alesina, A.; Glaeser, E.; Sacerdote, B. Why doesn’t the United States have a European-style welfare state? Brook. Pap. Econ. Act. 2001, 2, 187–277. [Google Scholar] [CrossRef] [Green Version]
- Harris, B.; Schmalz, D.; Larson, L.R.; Fernandez, M. Fear of the unknown: Examining neighborhood stigma’s effect on urban greenway use and surrounding communities. Urban. Aff. Rev. 2020. [Google Scholar] [CrossRef]
- Low, S.; Taplin, D.; Scheld, S. Rethinking Urban. Parks: Public Space and Cultural Diversity; University of Texas Press: Austin, TX, USA, 2005. [Google Scholar]
- McDaid, D.; Sassi, F.; Merkur, S. (Eds.) Promoting Health and Preventing Disease: The Economic Case; Open University Press: Maidenhead, UK, 2020. [Google Scholar]
- EUROPARC Federation Healthy Parks Healthy People Europe. Available online: https://www.europarc.org/nature/healthy-parks-healthy-people-europe/ (accessed on 24 July 2020).
- Garrett, J.K.; Clitherow, T.J.; White, M.P.; Wheeler, B.W.; Fleming, L.E. Coastal proximity and mental health among urban adults in England: The moderating effect of household income. Heal. Place 2019, 59, 102200. [Google Scholar] [CrossRef]
- Lambert, K.A.; Bowatte, G.; Tham, R.; Lodge, C.; Prendergast, L.; Heinrich, J.; Abramson, M.J.; Dharmage, S.C.; Erbas, B. Residential greenness and allergic respiratory diseases in children and adolescents—A systematic review and meta-analysis. Environ. Res. 2017, 159, 212–221. [Google Scholar] [CrossRef] [PubMed]
- Lambert, K.A.; Bowatte, G.; Tham, R.; Lodge, C.J.; Prendergast, L.A.; Heinrich, J.; Abramson, M.J.; Dharmage, S.C.; Erbas, B. Greenspace and atopic sensitization in children and adolescents—a systematic review. Int. J. Environ. Res. Public Health 2018, 15, 2539. [Google Scholar] [CrossRef] [Green Version]
- Markevych, I.; Ludwig, R.; Baumbach, C.; Standl, M.; Heinrich, J.; Herberth, G.; de Hoogh, K.; Pritsch, K.; Weikl, F. Residing near allergenic trees can increase risk of allergies later in life: LISA Leipzig study. Environ. Res. 2020, 191, 110132. [Google Scholar] [CrossRef] [PubMed]
- Dzhambov, A.M.; Lercher, P.; Rüdisser, J.; Browning, M.H.E.M.; Markevych, I. Allergic symptoms in association with naturalness, greenness, and greyness: A cross-sectional study in schoolchildren in the Alps. Environ. Res. 2020. [Google Scholar] [CrossRef] [PubMed]
- Boone-Heinonen, J.; Gordon-Larsen, P.; Guilkey, D.K.; Jacobs, D.R.; Popkin, B.M. Environment and physical activity dynamics: The role of residential self-selection. Psychol. Sport Exerc. 2011, 12, 54–60. [Google Scholar] [CrossRef] [Green Version]
- Cao, X.; Handy, S.L.; Mokhtarian, P.L. The influences of the built environment and residential self-selection on pedestrian behavior: Evidence from Austin, TX. Transportation 2006, 33, 1–20. [Google Scholar] [CrossRef] [Green Version]
- Handy, S.; Cao, X.; Mokhtarian, P.L. Self-selection in the relationship between the built environment and walking: Empirical evidence from Northern California. J. Am. Plan. Assoc. 2006, 72, 55–74. [Google Scholar] [CrossRef]
- Dendup, T.; Astell-Burt, T.; Feng, X. Residential self-selection, perceived built environment and type 2 diabetes incidence: A longitudinal analysis of 36,224 middle to older age adults. Heal. Place 2019, 58, 102154. [Google Scholar] [CrossRef] [PubMed]
- OECD and European Union. Indicators of Immigrant Integration 2015: Settling In; OECD Publishing: Paris, France, 2015; ISBN 9789264234024. [Google Scholar]
- United Nations. World Social Report 2020: Inequality in a Rapidly Changing World; United Nations: New York, NY, USA, 2020; ISBN 9789211303926. [Google Scholar]
- Cole, H.V.S.; Garcia Lamarca, M.; Connolly, J.J.T.; Anguelovski, I. Are green cities healthy and equitable? Unpacking the relationship between health, green space and gentrification. J. Epidemiol. Community Health 2017, 71, 1118–1121. [Google Scholar] [CrossRef] [Green Version]
- WHO Regional Office for Europe. Urban. Green Spaces and Health: A Review of Evidence; World Health Organization: Copenhagen, Denmark, 2017. [Google Scholar]
- Anguelovski, I. Tactical developments for achieving just and sustainable neighborhoods: The role of community-based coalitions and bottom-to-bottom networks in street, technical, and funder activism. Environ. Plan. C Gov. Policy 2015, 33, 703–725. [Google Scholar] [CrossRef]
- Rigolon, A. Nonprofits and park equity in Los Angeles: A promising way forward for environmental justice. Urban. Geogr. 2019, 40, 984–1009. [Google Scholar] [CrossRef]
- Rigolon, A.; Gibson, S. The role of non-governmental organizations in achieving environmental justice for green and blue spaces. Landsc. Urban. Plan. 2021, 205, 103970. [Google Scholar] [CrossRef]
- Razani, N.; Niknam, K.; Wells, N.M.; Thompson, D.; Hills, N.K.; Kennedy, G.; Gilgoff, R.; Rutherford, G.W. Clinic and park partnerships for childhood resilience: A prospective study of park prescriptions. Heal. Place 2019, 57, 179–185. [Google Scholar] [CrossRef] [PubMed]


| Low SES | Racially/Ethnically Minoritized Group | ||
|---|---|---|---|
| Disparity category | Source | Source | Minoritized group affected |
| Life expectancy | [3,4,10,53,60] | [4,8,10,60] | Black people (U.S.), Indigenous people (Australia) |
| All-cause mortality | [11,51] | [2,11] | Native American people (U.S.), Black and Indian people (South Africa) |
| Homicide-related deaths | [2] | [2] | Black and Latinx people (U.S.) |
| Number of chronic conditions | [3,8,10] | [8,10,61] | Black and two-race people (U.S.), Indigenous people (Australia), immigrants (Germany, Spain, Sweden, Switzerland) |
| Cardiovascular health/disease | [2,4,8,10] | [2,4] | Black people (U.S.) |
| Cancer | [2,10] | ||
| Obesity or overweight | [2,3,4,8,10] | [4,8,61,62] | Black and Latinx people (U.S.), non-White people (The Netherlands), immigrants (Germany, Sweden) |
| Diabetes | [2,4,8,10] | [4,8,62] | Black, Asian, Latinx, and Native American people (U.S.), non-White people (The Netherlands) |
| Atopic diseases (e.g., asthma, eczema) | [8] | [8] | Black and Native American people (U.S.) |
| Poor self-reported health | [4,7,8,51,53] | [4,8,9,10,61,63] | Black, Native American, and Latinx people (U.S.), Indigenous people (Australia), non-White people (United Kingdom), immigrants (France, Germany, The Netherlands, Sweden, Switzerland), ethnically minoritized people as opposed to Han Chinese (China) |
| Preterm births | [64] | [2,4,8] | Black people (U.S.) |
| Infant mortality | [4] | [2,65] | Black people (U.S.), Black people (South Africa) |
| Authors and Date | EM Focus | Green Space Type (s) | Health Outcome Type (s) | Continent |
|---|---|---|---|---|
| Abelt and McLafferty (2017) [84] | SES | Green land cover | Birth outcomes | North America |
| Agay-Shay et al. (2014) [85] | SES | Green land cover | Birth outcomes | Europe |
| Agay-Shay et al. (2019) [86] | SES | Green land cover | Birth outcomes | Europe |
| Agyemang et al. (2017) [87] | Race | Public green space | CVD | Europe |
| Alexander et al. (2013) [88] | Race | Public green space | Obesity-related | North America |
| Astell-Burt et al. (2014) [89] | SES | Public green space | Diabetes | Oceania |
| Björk et al. (2008) [90] | SES | Green land cover | General health, Obesity-related | Europe |
| Brindley et al. (2018) [91] | SES | Gardens | General health | Europe |
| Brown et al. (2016) [92] | SES | Green land cover | CVD, Diabetes, General health | North America |
| Browning and Rigolon (2018) [93] | SES, Race | Green land cover | Obesity-related | North America |
| Casey et al. (2016) [94] | SES | Green land cover | Birth outcomes | North America |
| Coppel and Wüstemann (2017) [95] | SES | Public green space | General health | Europe |
| Crouse et al. (2017) [96] | SES | Green land cover | Mortality | North America |
| Cummins and Fagg (2012) [97] | SES | Public green space | CVD | Europe |
| Cusack et al. (2017a) [98] | SES, Race | Green land cover | Birth outcomes | North America |
| Cusack et al. (2017b) [99] | SES, Race | Green land cover | Birth outcomes | North America |
| Cusack et al. (2018) [100] | SES, Race | Green land cover | Birth outcomes | North America |
| da Silveira and Junger (2018) [101] | SES | Green land cover | CVD | South America |
| Dadvand et al. (2012a) [102] | SES | Green land cover, Public green space | Birth outcomes | Europe |
| Dadvand et al. (2012b) [103] | SES | Green land cover | Birth outcomes | Europe |
| Dadvand et al. (2014a) [104] | SES | Green land cover, Public green space | Atopic disease, Obesity-related | Europe |
| Dadvand et al. (2014b) [105] | SES, Race | Green land cover | Birth outcomes | Europe |
| Dadvand et al. (2018) [106] | SES | Public green space | Diabetes | Asia |
| D’Agostino et al. (2018a) [107] | SES | Nature-based programs | CVD, Obesity-related | North America |
| D’Agostino et al. (2018b) [108] | SES | Nature-based programs | CVD, Obesity-related | North America |
| Dalton et al. (2016) [109] | SES | Green land cover | Diabetes | Europe |
| de Keijzer et al. (2017) [110] | SES | Green land cover | Mortality | Europe |
| de Vries et al. (2003) [111] | SES | Green land cover, Gardens | General health | Europe |
| Demoury et al. (2017) [112] | SES | Green land cover | Cancer | North America |
| Donovan et al. (2013) [113] | SES | Green land cover | Atopic disease, CVD | North America |
| Donovan et al. (2018) [114] | SES, Race | Green land cover | Atopic disease | Oceania |
| Dzhambov et al. (2018) [115] | SES | Green land cover | CVD | Europe |
| Ebisu et al. (2016) [116] | SES, Race | Green land cover | Birth outcomes | North America |
| Egorov et al. (2017) [117] | SES, Race | Green land cover | CVD | North America |
| Eldeirawi et al. (2019) [118] | SES | Green land cover | Atopic disease | North America |
| Fan and Jin (2014) [119] | SES, Race | Public green space | Obesity-related | North America |
| Fong et al. (2018) [120] | SES, Race | Green land cover | Birth outcomes | North America |
| Foster and Weinstein (2019) [121] | SES | Public green space | Obesity-related | North America |
| Gidlow et al. (2016) [122] | SES | Green land cover | Mortality | Europe |
| Glazer et al. (2018) [123] | SES, Race | Green land cover | Birth outcomes | North America |
| Groenewegen et al. (2018) [124] | SES | Green land cover | Atopic disease, CVD, Diabetes, General health | Europe |
| Hobbs et al. (2017) [125] | SES | Public green space | Obesity-related | Europe |
| Hobbs et al. (2018) [126] | SES | Public green space | Obesity-related | Europe |
| Hughey et al. (2017) [127] | SES, Race | Public green space | Obesity-related | North America |
| Hystad et al. (2014) [128] | SES, Race | Green land cover | Birth outcomes | North America |
| James et al. (2016) [129] | SES, Race | Green land cover | Mortality | North America |
| Ji et al. (2019) [130] | SES | Green land cover | Mortality | Asia |
| Jilcott Pitts et al. (2013) [131] | SES | Public green space | Obesity-related | North America |
| Kihal-Talantikite et al. (2013) [132] | SES | Public green space | Birth outcomes | Europe |
| Kling et al. (2018) [133] | Race | Nature-based program | CVD, Obesity-related | North America |
| Lachowycz and Jones (2014) [134] | SES | Public green space | CVD | Europe |
| Lovasi et al. (2012) [135] | SES | Green land cover | Obesity-related | North America |
| Maas et al. (2006) [136] | SES | Green land cover | General health | Europe |
| Maas et al. (2006) [137] | SES | Public green space | Atopic disease, CVD, Diabetes, General health, | Europe |
| Markevych et al. (2014) [138] | SES | Green land cover | Birth outcomes | Europe |
| Mena et al. (2015) [139] | SES | Public green space | Obesity-related | South America |
| Mitchell and Popham (2018) [140] | SES | Public green space | CVD, Mortality | Europe |
| Mueller et al. (2018) [141] | SES, Race | Public green space | Mortality | Europe |
| Nichani et al. (2017) [142] | SES, Race | Green land cover | Birth outcomes | Oceania |
| Nieuwenhuijsen et al. (2018) [143] | SES | Green land cover | Mortality | Europe |
| Orioli et al. (2019) [144] | SES | Green land cover | Atopic disease, CVD, Mortality | Europe |
| Persson et al. (2018) [145] | SES | Green land cover | Obesity-related | Europe |
| Petraviciene et al. (2018) [146] | SES | Green land cover | Obesity-related | Europe |
| Pun et al. (2018) [147] | SES, Race | Green land cover | CVD | North America |
| Reid et al. (2017) [148] | SES | Green land cover | General health | North America |
| Richardson et al. (2018) [149] | SES | Green land cover | Birth outcomes | Europe |
| Rossi et al. (2018) [150] | SES | Public green space | Obesity-related | South America |
| Rossi et al. (2019) [151] | SES | Public green space | Obesity-related | South America |
| Ruijsbroek et al. (2017) [42] | SES | Public green space | General health | Europe |
| Sarkar (2017) [152] | SES | Green land cover | Obesity-related | Europe |
| Schalkwijk et al. (2018) [153] | SES | Gardens, Public green space | Obesity-related | Europe |
| Schuler and O’Reilly (2017) [154] | SES | Public green space | Obesity-related | North America |
| Seo et al. (2019) [155] | SES | Public green space | CVD | Asia |
| Singh et al. (2010) [156] | SES, Race | Public green space | Obesity-related | North America |
| Sullivan et al. (2014) [157] | Race | Public green space | Obesity-related | North America |
| Thiering et al. (2016) [158] | SES | Green land cover | Diabetes | Europe |
| Triguero-Mas et al. (2015) [159] | SES | Green land cover, Public green space | General health | Europe |
| Van Der Zwaard et al. (2018) [160] | SES | Gardens | Obesity-related | Europe |
| Vienneau et al. (2017) [161] | SES | Green land cover | Atopic disease, CVD, Mortality, | Europe |
| Villeneuve et al. (2012) [162] | SES | Green land cover | Atopic disease, Mortality | North America |
| Villeneuve et al. (2018) [163] | SES | Green land cover | Obesity-related | North America |
| Wang and Lan (2019) [164] | SES | Public green space | Atopic disease, Obesity-related | Asia |
| Wen and Kowaleski-Jones (2012) [165] | Race | Public green space | Obesity-related | North America |
| Wilker et al. (2014) [166] | SES | Green land cover | CVD | North America |
| Wu et al. (2018) [167] | Green land cover, Public green space | CVD | North America | |
| Xu et al. (2017) [168] | SES | Green land cover | Atopic disease, CVD, Diabetes | Asia |
| Yang et al. (2019a) [169] | SES | Green land cover | CVD | Asia |
| Yang et al. (2019b) [170] | SES | Green land cover | Diabetes | Asia |
| Yeager et al. (2018) [171] | SES, Race | Green land cover | CVD | North America |
| Yitshak-Sade et al. (2019) [172] | SES, Race | Green land cover | CVD | North America |
| EM SES | EM Race/Ethnicity | |||
|---|---|---|---|---|
| Mean (SD) | n | Mean (SD) | n | |
| Green space type | ||||
| Gardens | 0.500 (0.577) | 4 | ||
| Green land cover | 0.154 (0.594) | 78 | −0.007 (0.644) | 20 |
| Nature-based program | 0.500 (0.577) | 3 | 0.500 (0.000) | 2 |
| Public green space | 0.447 (0.585) | 36 | 0.135 (0.570) | 8 |
| Green space distance | ||||
| 0–500 m | −0.009 (0.529) | 52 | −0.060 (0.584) | 15 |
| 501–1000m | 0.518 (0.464) | 14 | 1.000 (0.000) | 1 |
| 1001–2000 m | 0.750 (0.500) | 4 | 1.000 (0.000) | 2 |
| >2000 m | 1.000 (0.000) | 4 | ||
| Health outcome type | ||||
| Atopic disease | 0.273 (0.606) | 11 | −0.250 (0.000) | 1 |
| Birth outcomes | 0.072 (0.466) | 22 | −0.036 (0.506) | 11 |
| Cancer | 0.000 (0.000) | 2 | ||
| Cardiovascular health/disease | 0.218 (0.596) | 25 | 0.214 (0.755) | 7 |
| Diabetes | 0.425 (0.472) | 10 | ||
| General health | 0.559 (0.519) | 17 | ||
| Mortality | 0.091 (0.943) | 11 | 0.500 (0.707) | 2 |
| Obesity-related | 0.305 (0.613) | 24 | 0.009 (0.653) | 9 |
| Continent | ||||
| Asia | 0.158 (0.609) | 10 | ||
| Europe | 0.448 (0.564) | 61 | 0.625 (0.478) | 4 |
| North America | 0.022 (0.559) | 44 | −0.013 (0.607) | 24 |
| Oceania | 0.416 (0.381) | 3 | −0.125 (0.176) | 2 |
| South America | 0.250 (0.957) | 4 | ||
Publisher’s Note: MDPI stays neutral with regard to jurisdictional claims in published maps and institutional affiliations. |
© 2021 by the authors. Licensee MDPI, Basel, Switzerland. This article is an open access article distributed under the terms and conditions of the Creative Commons Attribution (CC BY) license (http://creativecommons.org/licenses/by/4.0/).
Share and Cite
Rigolon, A.; Browning, M.H.E.M.; McAnirlin, O.; Yoon, H. Green Space and Health Equity: A Systematic Review on the Potential of Green Space to Reduce Health Disparities. Int. J. Environ. Res. Public Health 2021, 18, 2563. https://doi.org/10.3390/ijerph18052563
Rigolon A, Browning MHEM, McAnirlin O, Yoon H. Green Space and Health Equity: A Systematic Review on the Potential of Green Space to Reduce Health Disparities. International Journal of Environmental Research and Public Health. 2021; 18(5):2563. https://doi.org/10.3390/ijerph18052563
Chicago/Turabian StyleRigolon, Alessandro, Matthew H. E. M. Browning, Olivia McAnirlin, and Hyunseo (Violet) Yoon. 2021. "Green Space and Health Equity: A Systematic Review on the Potential of Green Space to Reduce Health Disparities" International Journal of Environmental Research and Public Health 18, no. 5: 2563. https://doi.org/10.3390/ijerph18052563