


Abstract
Objectives. This article investigates: (a) how social status influences diabetes prevalence and incidence; (b) how risky health behaviors contribute to the prediction of incident diabetes; (c) if the effects of health behaviors mediate the effects of social status on incident diabetes; and (d) if these effects differ in midlife and older age.
Methods. We examined nationally representative data from the 1992/1993–1998 panels of the Health and Retirement Study for middle-aged and older adults using logistic regression analyses.
Results. The odds of prevalent diabetes were higher for people of older age, men, Black adults, and Latino adults. Higher early-life social status (e.g., parental schooling) and achieved social status (e.g., respondent schooling, economic resources) reduced the odds in both age groups. We observed similar patterns for incident diabetes in midlife but not in older age. Risky health behaviors—particularly obesity—increased the odds of incident diabetes in both age groups independent of social status. The increased odds of incident diabetes in midlife persisted for Black and Latino adults net of other social status factors.
Discussion. Risky health behaviors are key predictors of incident diabetes in both age groups. Economic resources also play an important protective role in incident diabetes in midlife but not in older age.
INTEREST in the relationship of social inequalities and health has increased considerably over the past few decades, and journals devoted to health research have witnessed an exponential growth in studies on social status and health (Feinstein, 1993; Oakes & Rossi, 2002). Current research has moved in three directions. First, although most researchers have focused on socioeconomic disparities, others have examined the link between gender and race or ethnicity; the extent to which socioeconomic status, gender, and race or ethnicity operate independently (e.g., M. D. Hayward, Crimmins, Miles, & Yang, 2000; Williams & Collins, 1995); and the interplay of early childhood factors and later experiences to explain the role of gender and race disparities in health (Blackwell, Hayward, & Crimmins, 2001; M. D. Hayward & Gorman, 2004). Second, greater pressure now exists to explain the indisputable link between social experiences and health disparities as a social and cultural phenomenon, with substantial research devoted to mediational and explanatory factors that may interpret the link—for example, health-related risk factors such as health behaviors (Lantz et al., 2001; Lynch, Kaplan, & Salonen, 1997) as well as access to care related to health insurance coverage (Lu, Samuels, & Wilson, 2004; Ross & Mirowsky, 2000) and psychosocial factors like social support, chronic and acute stressors, and self-efficacy (House et al., 1994; Winkleby, Fortmann, & Barrett, 1990). Third, although the use of “health status” as a global concept helps organize and motivate research on health disparities, such a general conception may not reveal the processes at work for specific morbidities. Thus, research has increasingly focused on specific disease conditions on the assumption that the processes involved in the relationship between social experiences and morbidity may differ by disease condition.
In this article, we combined all three approaches in order to investigate the risk factors for the prevalence and incidence of diabetes, one of the chronic conditions shared by middle-aged and older adults, and particularly the effects of social status and risky health behaviors on that chronic condition. Using population-based longitudinal data, we asked four primary questions: (a) How do components of social status influence the prevalence and incidence of diabetes? (b) How do risky health behaviors contribute to incident disease? (c) Do health behaviors mediate the effects of social status on incident diabetes? and (d) Do these effects differ by age group?
Theoretical Background
Type 2 diabetes, a health problem common to about 1 in 5 middle-aged and older Americans, is associated with excess diseases, complications, and disability as well as premature mortality (Wray, Ofstedal, Langa, & Blaum, 2005). Many studies have documented that the onset of type 2 diabetes (referred to hereafter as “diabetes”) in American adults differs markedly by gender, race or ethnicity, and socioeconomic status. For example, studies show diabetes and its associated complications are found disproportionately in women as well as in African Americans and Latino Americans (Harris, 1998). Similarly, middle-aged and older adults with higher education are less likely to report they have been diagnosed with diabetes, compared to their less educated counterparts (Best, 2004; Wray, Ofstedal, et al., 2005).
These patterns demonstrate the two primary categories of the broader concept of social status: Ascribed statuses are attached to the individual at birth by virtue of biological or group attributes (factors such as gender, race or ethnicity, and age, based in both biology and social construction), and achieved statuses are gained through access to opportunity and the exercise of individual volition (factors such as education, occupation, income, and assets). Because different social (and possibly biological) processes may produce health disparities, we distinguish in this article between the effects of ascribed and achieved social statuses as well as other factors that originate earlier in one's life (e.g., parental socioeconomic status; Alwin & Wray, 2005). Furthermore, effects of early-life and achieved social statuses may also vary by ascribed social status, leading to subsequent health disparities, including diabetes-related health behaviors or lifestyle factors (e.g., obesity, sedentary lifestyle), and, in turn, the onset and complications of diabetes (e.g., Best, 2004; M. D. Hayward et al., 2000; Oakes & Rossi, 2003; Ross & Wu, 1995, 1996).
This article relies on a life-span developmental perspective in its investigation of the link between social status and health (see Alwin & Wray, 2005). Figure 1 presents a conceptual framework for understanding how people may be differentially exposed to risks of disease or protective factors and the social conditions that link these effects to the social environment over the life span. By examining social inequalities over the life span, we emphasize the importance of considering the timing of influences of social inequalities and multiple periods of relevance (e.g., childhood, midlife, and older age) for the effects of social status on health outcomes in understanding the link between social status and health.
Hypotheses
We hypothesized that key social status factors—ascribed, early-life, and achieved social status—would be linked to the prevalence and incidence of diabetes in midlife and older adulthood. The ascribed factors include gender, race or ethnicity, and age. The gendered nature of life course trajectories clearly structures and constrains health-related resources and opportunities for men and women (Moen, 2003). Because there is currently little or no evidence that sex-linked biological differences underlie differences in the prevalence of diseases, disability, and mortality (Wray & Blaum, 2001), other factors on which men and women differ may be responsible—for example, participation in risky health behaviors (e.g., smoking, drinking, and substance abuse), personality characteristics (e.g., hostility, anger), levels of and responses to stressful situations, and social support.
Furthermore, health outcomes differ across major racial or ethnic groups such that, on average, African American adults evidence poorer health than do European Americans, Asian Americans, or Latino Americans, although some of these results remain controversial (National Research Council, 2003). Studies have documented that achieved social status factors contribute to differing health status, but they do not fully explain the health differences by race or ethnicity. Instead, these differences may be attributed to physiological differences due to ancestral geography; parental education, birth weight, and other childhood health and economic circumstances; differential educational quality; effects of accumulated daily hassles or discrimination; lower income and accumulated wealth; or interactions of some or all of these factors (M. D. Hayward et al., 2000; National Research Council, 2003; Whitfield, Weidner, Clark, & Anderson, 2002). In addition, studies have consistently found that the effects of inequalities on health persist and may even increase in strength across the life span (Dannefer, 1987; O'Rand, 1996); however, the level of the association appears to decline precipitously in older age (e.g., House et al., 1994; Marmot & Shipley, 1996).
Research on achieved statuses typically focuses on income, wealth, education, and occupational status as though they were alternative indicators of the same latent concept of socioeconomic status. Instead, they refer to different institutional structures that are, in fact, causally ordered. Neither are parental status and one's own status the same: To focus only on adult achieved statuses ignores the role that family background may play in how social inequalities affect health in adulthood (e.g., see Preston, Hill, & Drevenstedt, 1998; Wadsworth, 1997). Thus, Figure 1 includes differences in social background as a source of health inequalities. Although few data sets include measures of such factors, we used parental education as an indicator of inequalities in social background.
The salutary relationship between levels of achieved status and health is one of the most widely documented links in studies on social status and health (e.g., Adler et al., 1994; Mirowsky & Ross, 2003; Ross & Wu, 1995, 1996). Although the relationship between social status and health is arguably bidirectional, for the purposes of our analyses, we hypothesized only one direction: that increased schooling would improve occupational prospects, income, and accumulated wealth, all of which, in turn, would enhance health outcomes through safer and less stressful workplaces, greater access to information and health insurance, and social networks.
Finally, we hypothesized that the effects of social statuses—both ascribed and achieved—would be in part transmitted by risky health behaviors associated with lifestyle. Many of the risky behaviors (e.g., obesity, physical inactivity, cigarette smoking) associated with diabetes and its comorbid conditions are disproportionately prevalent in older adults with diabetes compared to their older and younger counterparts without diabetes as well as in African Americans and Latino Americans compared to European Americans (Wray, Alwin, & McCammon, 2005). Similarly, many of these risk factors vary widely by achieved social status such that lower levels of schooling, income, or wealth are associated with increasing numbers of risky health behaviors (Wray, Alwin, et al., 2005). Although many existing studies have indicated that these more traditional health risks explain few health and mortality inequalities in general (Lantz et al., 1998; Winkleby et al., 1990), research on their link to disparities in diabetes in particular is sparse. Because diabetes-related health behaviors are largely modifiable and central to optimal diabetes management, continued investigation of their role in the link between social status and the onset of diabetes is important.
Methods
Samples
We analyzed data from the baseline and two follow-up waves of two nationally representative surveys of community-dwelling middle-aged and older adults: the Health and Retirement Study (HRS) and the Study of Asset and Health Dynamics Among the Oldest Old (AHEAD). The HRS surveyed Americans who were aged 51–61 in 1992, and AHEAD surveyed Americans who were at least aged 70 in 1993. The design and administration of the HRS and AHEAD are described in detail elsewhere (Juster & Suzman, 1995; Soldo, Hurd, Rodgers, & Wallace, 1997). Both studies oversampled African American or Black adults (hereafter referred to as “Black” adults), Latino or Hispanic American adults (hereafter referred to as “Latino American” adults), and married couples. The HRS and AHEAD merged into one survey beginning in 1998 (also referred to as the HRS), which is now representative of Americans aged 51 and older.
There were 9,098 HRS and 6,580 AHEAD baseline respondents who met the eligibility requirements of our study (age, race and ethnicity, and non-proxy respondent eligibility). These samples, minus the cases with item-level nonresponse (659 cases in the HRS and 575 in AHEAD), constituted our analytic sample for the prevalence analysis (HRS N = 8,439 and AHEAD N = 6,005). We further reduced these samples in developing our samples for the incidence analyses. Of the baseline HRS interviews, we lost 405 cases because of respondent death prior to the 1998 data collection; we excluded 414 cases because the respondent had been unable to complete either the 1996 or 1998 interview and researchers had conducted a proxy interview; we lost 1,228 cases because of other unit nonresponse in 1996 or 1998; we excluded 754 cases because the respondent had reported at baseline that they had been diagnosed with diabetes; and we excluded an additional 638 cases because of item nonresponse specific to our analytic models. Thus, we based our incidence analyses of the HRS data on a total of 5,659 cases. Of the 6,580 study-specific, age-eligible, race–ethnicity-eligible non-proxy respondent interviews conducted in the 1993 AHEAD study, we lost 1,152 cases because of respondent death prior to the 1998 data collection; we excluded 512 cases because the respondent had been unable to complete either the 1995 or 1998 interview and researchers had conducted a proxy interview; we lost 421 cases because of other unit nonresponse in 1995 or 1998; we excluded 846 cases because the respondent had reported at baseline that they had been diagnosed with diabetes; and we excluded an additional 416 cases because of study-specific item nonresponse. Thus, we based our incidence analyses of AHEAD data on 3,233 cases.
Model and Covariates
We hypothesized effects of (a) ascribed social status (e.g., gender, race or ethnicity, and age), early-life social status (e.g., parental schooling), marital status, and achieved social status (e.g., respondent schooling, economic resources) on diabetes prevalence at baseline; and (b) these factors, comorbid conditions at baseline, and lifestyle or risky health behaviors 2 years later on diabetes incidence in 1998. We measured our dependent and independent variables so that they were identical (or nearly identical in the case of one variable, as described below) in the two surveys, and we estimated our model separately for the middle-aged and older adult groups. In addition, because we suspected gender and race or ethnicity might interact in the production of diabetes prevalence, we tested for interaction effects.
Diabetes measurement
We measured diabetes by self-report of having diabetes at the time of the baseline interview (1992 for middle-aged adults, 1993 for older adults) and again in 1998, based on the question “Do you have diabetes now?” Interviewers had posed this question in a series of questions that asked whether respondents had ever been told by a doctor that they had any of eight diseases or conditions most common in middle and older age. In the case of diabetes, interviewers had asked the “ever told” question of middle-aged adults in the baseline interview but not of older adults. However, because interviewers had asked both age groups whether they currently had diabetes, we used the “currently have” question as the basis for our outcome measure. (For further details on the health measures, see Fisher, Faul, Weir, & Wallace, 2005.)
Covariate measurement
The present study's independent variables included our measures of analytic interest—ascribed, early-life, and achieved social status as well as risky health behaviors—and measures of comorbid health conditions shown by the literature to be associated with diabetes. Ascribed social status included gender, race or ethnicity, and age, factors all strongly related to increased incidence of diabetes. We measured gender as women (1 = yes, 0 = no) and race or ethnicity as Black versus European American or White (1 = yes, 0 = no) or Latino versus White (1 = yes, 0 = no). We measured age in chronological years (range 51–61 in the HRS, 70 and older in AHEAD).
We measured early-life social status as the level of parental schooling reported by the respondent. For middle-aged adults, parental schooling was a continuous measure of the average years of schooling (range 0–17) reported for the respondent's mother and father. Interviewers had asked older adults whether neither, one, or both of their parents had at least an eighth grade education (range 0–2). We considered achieved social status in two ways. First, we measured respondent education as years of schooling (range 0–17). Second, we measured current economic resources as the standardized logged sum of household income and net worth. Our models assumed that part of the effect of educational level resulted from its link to access to higher status jobs that provided increased economic resources and, in turn, promoted better health and health care.
One final social risk factor was marital status. We included being married or partnered versus other marital states as a measure of social control shown to be related to risky health behaviors (Franks, Pienta, & Wray, 2002; Umberson, 1987, 1992; Umberson, Williams, Powers, Liu, & Needham, 2006).
We measured comorbidity as a count of self-reported diagnosis of six diseases other than diabetes that are common in midlife and older age (range 0–6). The six diseases included: current arthritis and histories of cancer, heart problems, high blood pressure, chronic lung disease, or stroke. As was the case with questions relating to diabetes, interviewers had asked HRS respondents if they had ever been told by a doctor that they had arthritis and, subsequently, if they had seen a doctor in the past year for their arthritis; interviewers had asked AHEAD respondents only about their having seen a doctor in the past year. Thus, we based our measure of arthritis on the common question about seeing a doctor. We based measures of the other comorbid conditions on the “ever told” questions.
Risky health behaviors included four domains: (a) body mass index (BMI), calculated from self-reported height and weight and measured by using two dummy variables, where 1 = underweight (BMI < 19 kg/m2) versus normal or overweight (BMI > 19 and < 30 kg/m2), and 2 = obese (BMI > 30 kg/m2) versus normal or overweight; (b) sedentary lifestyle, measured using a dummy variable involving participation in vigorous exercise less than three times per week versus vigorous exercise three or more times per week; (c) alcohol consumption, measured using two dummy variables, where 1 = heavy drinking (three or more alcoholic drinks per day) versus moderate drinking (one to two alcoholic drinks per day), and 2 = no drinking versus moderate drinking; and (d) smoking status, measured using two dummy variables, where 1 = current cigarette smoker versus never smoker, and 2 = past smoker versus never smoker.
Data Analysis
We compared characteristics of the HRS and AHEAD respondents using standard descriptive methods and tests for differences, both between and within the two age groups. We tested two sets of logistic regression models: (a) the relative contributions of age, gender, race or ethnicity, parental schooling, marital status, respondent schooling, and economic resources at baseline on diabetes prevalence in both age groups; and (b) the contributions of those background characteristics and comorbidity at baseline as well as risky health behaviors 2 years later on diabetes incidence in 1998 in both age groups. We weighted all analyses for differential probability of selection and adjusted them for complex sample design. We evaluated results from the descriptive and multivariate analyses in order to assess significance and goodness of fit.
We also examined the potential interactions of race and gender in their effects on prevalent diabetes across the AHEAD and HRS samples. Unlike with ordinary least squares regression models, cross-group comparisons of coefficients in logistic regression models confound interactions and unmeasured residual variation, and the analysis of interactions is not as straightforward as might otherwise be the case (Allison, 1999). Preliminary analyses of interactions indicated there were significant differences in the extent of gender by race or ethnicity heterogeneity in residual variation; however, once we adjusted for these differences there were no significant interactions. All model estimates presented in the subsequent analyses, therefore, constrain the effects of race or ethnicity and gender to be additive. Similarly, there were no significant interactions in the effects of variables across the HRS and AHEAD subsamples, although we present the results separately so that we can include the age variable within each of the HRS and AHEAD subsamples.
Results
Table 1 presents descriptive information for the HRS and AHEAD samples by gender within each age group for the prevalence and incidence analysis samples. We have presented results of tests for differences between men and women in each age group under the Total columns, and we have presented results of tests for differences between the two age groups under the Combined Sample column.
Both prevalence and incidence data indicated the middle-aged and older adults were relatively healthy on average, with the older adults experiencing somewhat poorer health compared to middle-aged adults. The older adults were less likely than the middle-aged adults to be married and more likely to report fewer years of schooling and lower levels of economic resources. In general, women in both age groups were less likely to be married and were more likely to be disadvantaged on measures of achieved social status compared to men in both age groups.
As indicated under the incidence model characteristics, the health behavior risk profiles differed considerably between age groups and between men and women. For example, middle-aged adults were more likely to be obese, heavy drinkers, and current smokers, whereas older adults were more likely to be underweight, nondrinkers, and past smokers. In addition, women in both age groups were more likely than their male counterparts to be underweight as well as obese, sedentary, and nondrinkers, whereas men were more likely than women to be heavy drinkers and past smokers.
Social Status and Prevalent Diabetes
In Table 2, successive models estimated the total, direct, and indirect effects of three causally ordered sets of variables on prevalent diabetes at baseline: (a) age, gender, race or ethnicity, parental education, and marital status; (b) respondent schooling; and (c) economic resources. We have presented the effect coefficients as odds ratios, where odds ratios significantly greater than 1 reflect increased odds and odds ratios significantly less than 1 reflect decreased odds of having diabetes. In general, the results demonstrated that age, gender, race or ethnicity, and parental education were all significantly associated with prevalent diabetes in both age groups and across most models in each age group.
Middle-aged adults
The odds of having diabetes increased in middle-aged adults who reported they were older, Black, or Latino; the odds decreased if the respondent was a woman or reported higher levels of schooling or economic resources. Although the effects of being a Black or Latino adult were attenuated by achieved status (from 2.250 in Model 1 to 1.942 in Model 3, and from 1.570 in Model 1 to 1.300 in Model 3, respectively), the effects of race or ethnicity remain strong. Economic resources marginally mediated the protective effects of schooling in middle-aged adults.
Older adults
The pattern of effects on prevalent diabetes was similar for older adults, but two differences were worth noting. First, the odds of having diabetes decreased for respondents of older age and for women. Second, the protective effects of parental education (in Model 1) were attenuated once we included the respondent's years of schooling and economic resources (Models 2 and 3).
Social Status, Risky Health Behaviors, and Incident Diabetes
Table 3 addresses the questions of the effects of social status variables on incident diabetes and if risky health behaviors mediate the relationship between social status and diabetes. We estimated the effects of four sets of variables on incident diabetes in 1998: (a) age, gender, race or ethnicity, parental education, marital status, and comorbidity at baseline; (b) respondent schooling; (c) economic resources; and (d) health behaviors.
Middle-aged adults
Across Models 1–3, the odds of having incident diabetes between baseline and 1998 were present for middle-aged men, Black adults, and Latino adults, even after controlling for early-life or achieved social status (Models 2 and 3). The effects of being a Black or Latino adult were only marginally attenuated by schooling and economic resources.
Older adults
There were few effects of gender, race or ethnicity, and achieved social status on incident diabetes in older adulthood. In fact, other than the significant effect of respondent schooling in Model 2, the main variable that predicted incident diabetes in Models 1–3 was comorbidity.
As is shown in Model 4 for each age group, however, risky health behaviors were central in predicting incident diabetes. For example, being obese more than tripled the odds of incident diabetes in midlife (odds ratio = 3.556), and being a nondrinker or past smoker also increased the odds of incident diabetes. In older adults, obesity more than doubled the odds (odds ratio = 2.531), although not as markedly as in midlife. In addition, current smoking increased the odds of incident diabetes, although this effect was not significant. Overall, the effects of some health behaviors (e.g., obesity, nondrinking, past smoking) were stronger for middle-aged adults than for older adults, and others (e.g., physical inactivity, current smoking) were stronger for older adults.
Discussion
This study aimed to add to the growing literature on the potential role of risky health behaviors in accounting for some of the effects of social status on health. Research focused on enhancing understanding of the social and behavioral mechanisms underlying the growing epidemic of diabetes may help identify ways to prevent, reduce, or reverse the risks of diabetes and, in turn, part of the more general profile of health disparities in the United States. Although our data did not allow us to isolate the mechanisms by which the effects of social status factors operated through health behaviors, we can speculate. Higher (versus lower) achieved status might influence the experience of diabetes by increasing (decreasing) knowledge about the links between health behaviors and diabetes; and higher (versus lower) levels of net worth might allow (or not) individuals to “buy” diabetes-related behavior modification programs, medications, or other treatment options. Studies have also shown that participation in risky health behaviors varies by education and diabetes status (Blaum, Ofstedal, Langa, & Wray, 2003; Wray, Ofstedal, et al., 2005). Despite increasingly widespread knowledge about the importance of protective health behaviors, however, fewer people than one might expect engage in maintaining a healthy weight and exercising regularly, and they do so at differential rates by gender and race or ethnicity group (Wray, Alwin, et al., 2005; Wray, Blaum, Ofstedal, & Herzog, 2004; Wray, Ofstedal, et al., 2005). The question is why? The answer may lie in the potentially linked effects of social status and risky health behaviors.
In this article, we used population-based longitudinal data to examine the effects of ascribed, early-life, and achieved social status and risky health behaviors on diabetes onset at midlife and older age. We first asked which risk factors—including various measures of social status—influenced diabetes prevalence and incidence. The data show there were significant differences in diabetes prevalence and incidence related to ascribed, early-life, and achieved social status. For example, we found significant protective effects of higher levels of parental schooling, respondent schooling, and economic resources on diabetes prevalence for both middle-aged and older adults. Gender and race gaps persisted, however, independent of these effects of schooling and economic resources, with men and Black or Latino adults being at greater risk for diabetes. In general, we found that many of the same factors associated with prevalence were linked to the incidence of diabetes although the effects were considerably weaker given the control for baseline comorbidity. Although the effects of being a Black or Latino adult, in particular, were modestly reduced (and therefore interpreted) by economic resources and health behaviors in midlife, the race–ethnicity effects remained strong.
Second, we asked whether risky health behaviors also contributed independently to the prediction of incident diabetes and, in the same vein, if the effects of health behaviors mediated the effects of social status on incident diabetes. We found that risky health behaviors—particularly obesity—significantly predicted incident disease, and these effects operated independently of ascribed as well as achieved social status. We also found independent effects on incident diabetes for nondrinkers versus light-to-moderate drinkers in midlife, supporting past studies finding an association of light-to-moderate alcohol consumption with decreased risk of coronary heart disease, stroke, and diabetes, perhaps by raising high-density lipoprotein cholesterol and improving insulin sensitivity. The results for health behaviors are worth restating: Engaging in risky health behaviors independently predicted diabetes in both mid- and later life, a testament to the encouragement by health care providers and educators to adopt and maintain a healthful lifestyle even into older age. These healthier lifestyles may reduce the risk not only for diabetes but also for long-term health complications, individual and societal costs, and premature mortality associated with diabetes.
Finally, we found that the patterns of these effects were similar for middle-aged and older adults, although the effects were somewhat weaker in later life compared to midlife. Despite the overall results, however, we found increased risk for diabetes onset for Black and Latino adults, even after adjusting for other social status factors, baseline comorbidity, and risky health behaviors. The independent effects of ascribed social status suggest the need for continued research to illuminate the factors underlying those effects as well as improved health promotion and health policy programs to redress the resulting disparities. We found few effects of the social status variables on incident diabetes in the older age sample—the exception was respondent schooling. By controlling for comorbidity of other chronic diseases in the model, we may have reduced whatever impact social status might have had on incident diabetes (5% in the older sample versus 8% in the middle-aged sample between baseline and the 1998 reinterview). Furthermore, the variability in some of our socioeconomic measures (e.g., income) may be reduced in later life; and because the older population has experienced highly differential mortality for several years, mortality selection may also be reducing the heterogeneity of older age populations (Crimmins, 2005).
Our findings are strengthened by our use of the HRS, a large nationally representative survey of middle-aged and older adults that oversampled Black and Latino American adults. The strong measurement design allowed us to construct multiple measures of ascribed, early-life, and achieved social status as well as behavioral health risks, data not often found together in a single study. In addition, the data were longitudinal, allowing us to specify a causal model to test the relationships among social status, health behaviors, and diabetes.
There are also limitations in our study. First, we derived our diabetes outcomes and health behavior predictors from respondent self-report rather than clinical examination or medical record. Although we acknowledge concerns about self-reported data in general, we believe the reports for diabetes are likely to be quite reliable, even if potentially underestimating the true prevalence or incidence of diabetes (Brancati, Whelton, Kuller, & Klag, 1996). Previous research has shown that self-reports of taking diabetes medications are reasonably accurate (R. A. Hayward, Manning, Kaplan, Wagner, & Greenfield, 1997); diabetes prevalence in HRS adults aged 65 and older was quite similar to that found by clinical measure in the National Health and Nutrition Examination Survey (Harris, 1998); and many diseases and conditions (particularly those that are more common or life-threatening) are accurately self-reported (Turner et al., 1997; Wallace & Herzog, 1995). Similarly, although some researchers caution against using self-reported survey data to assess health behaviors (e.g., weight), others support their use. Certainly, more research is needed to gauge the psychometric properties and validate self-reports against clinically measured behaviors and to understand the consequences that different questioning methodologies (such as those used in the HRS) may elicit.
Second, despite including several measures of risky health behaviors, we did not examine the effects of social status on change in those health risks and subsequent diabetes onset. It is conceivable that social status might influence diabetes onset through changes in health risks—for example, weight loss or change in diet—perhaps in response to recent diagnoses (e.g., hypertension) or other motivating factors that, in turn, have salutary effects on diabetes onset (e.g., see Wray, Herzog, Willis, & Wallace, 1998; Wray et al., 2004). Third, due to the types of data available in the HRS and AHEAD, we were unable to test for nutrition, gestational diabetes, personal control, or other physical health and psychological factors that may be associated with social status, behavioral health risks, or diabetes (Best, 2004; Kuh, Power, Blane, & Bartley, 1997; McEwen & Seeman, 1999; Whitfield et al., 2002; Williams, 1990).
For example, one interpretation of the effects of achieved social status is power to purchase services that aid in modifying health behaviors related to negative health outcomes. Certainly, one way to test that interpretation in part is to adjust for the effects of health insurance, measures that are available in our data sets. In fact, researchers often speculate that health insurance coverage may be a key factor in explaining health disparities, a focus of this article. We declined to test the effects of health insurance, however, for two key reasons. First, in a comprehensive and explicit test of whether private or public health insurance explains the effects of social status on health outcomes, Ross and Mirowsky (2000) used longitudinal and nationally representative data to compellingly dispute that hypothesis. Second, the measures of health insurance differed markedly in the original HRS and AHEAD samples (e.g., in terms of source and coverage), and our intent was to include only those variables that were identical or very nearly identical in both data sets so that we could compare results between the data sets.
Finally, differential attrition over time in the middle-aged and older age groups may have attenuated our already strong incidence results. Attrition is a problem that plagues all longitudinal research, and no less in the HRS. Although we believe attrition is, in part, nonrandom, earlier analyses of HRS data suggested individuals who became nonresponders due to death, refusal, or other reasons were, on average, less healthy and wealthy than the individuals who continued to respond. For that reason, our results may underestimate the effects of social status and comorbidity on diabetes—and perhaps more so in the older versus middle-aged group, given that mortality selection reduced the heterogeneity in the older age group.
Despite these limitations, we draw two broad conclusions from our study results. First, risky health behaviors strongly predicted incident diabetes for both middle-aged and older adults, even net of social status and the relatively short 6-year time period. This finding should strengthen health education efforts to help adults understand that the benefits of protective health behaviors on enhanced health continue dramatically even into older age. Second, we also found that gender and race–ethnicity gaps persisted in diabetes onset even after adjusting for early-life and achieved social status as well as baseline comorbidity and health behaviors. Those troubling disparities for diabetes and other diseases found here and in prior studies (e.g., Best, 2004; Ferraro & Farmer, 1996) need further exploration and understanding. Future studies in this area—with clinical samples, different or enhanced covariates and methods—may provide additional clues to explain the social as well as psychological and physiological mechanisms underlying the diabetes disparities and, in turn, enhance the development of more effective individual and community-level interventions to prevent, reduce, or reverse these serious health risks in middle-aged and older adults.
Decision Editor: Charles F. Longino Jr., Ph.D.
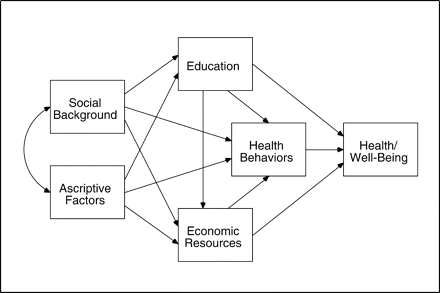
Conceptual model for the effects of social statuses on health and well-being
Descriptive Statistics for Diabetes and Other Characteristics of Middle-Aged and Older U.S. Adults, 1992/1993–1998.
| Middle-Aged Adults (aged 51–61) | Older Adults (aged 70 and older) | |||||||||||||
|---|---|---|---|---|---|---|---|---|---|---|---|---|---|---|
| Characteristic | Totala | Men | Women | Totalb | Men | Women | Combined Sampleb | |||||||
| Prevalence model characteristicsc | ||||||||||||||
| Diabetes (%) | 7.26 | 7.51 | 7.06 | 11.91* | 13.01 | 11.21 | 9.40*** | |||||||
| Age, M (SD) | 55.78 (3.17) | 55.78 (3.15) | 55.78 (3.19) | 77.00*** (5.57) | 76.55 (5.33) | 77.29 (5.70) | 65.07*** (11.05) | |||||||
| Women (%) | — | 46.39 | 53.61 | — | 39.06 | 60.94 | 56.98*** | |||||||
| Black (%) | 9.72* | 9.11 | 10.25 | 7.23 | 6.86 | 7.46 | 8.57** | |||||||
| Latino (%) | 6.31 | 6.39 | 6.24 | 3.26 | 3.26 | 3.25 | 4.91*** | |||||||
| White (%) | 83.97 | 84.50 | 83.52 | 89.52 | 89.88 | 89.28 | 86.52*** | |||||||
| Parental schooling, AHEAD, M (SD) | 1.08 (0.91) | 1.07 (0.90) | 1.08 (0.92) | (0.86) | ||||||||||
| Parental schooling, HRS, M (SD) | 9.34* (3.35) | 9.42 (3.34) | 9.27 (3.36) | |||||||||||
| Married/partnered (%) | 76.39*** | 81.45 | 72.02 | 52.42*** | 76.27 | 37.14 | 65.38*** | |||||||
| Respondent schooling, M (SD) | 12.48*** (2.93) | 12.65 (3.15) | 12.32 (2.71) | 11.35 (3.45) | 11.45 (3.72) | 11.29 (3.26) | 11.96*** (3.22) | |||||||
| Income, Mdn (SD) | 43,300*** (53,662) | 47,500 (61,806) | 39,400 (45,140) | 19,000*** (28,907) | 23,000 (34,971) | 16,356 (23,967) | 29,000*** (46,140) | |||||||
| Net worth, Mdn (SD) | 117,000** (562,528) | 119,000 (595,127) | 116,000 (533,422) | 100,600*** (402,575) | 133,500 (523,107) | 85,000 (300,866) | 109,960*** (496,518) | |||||||
| Unweighted n | 8,439 | 3,864 | 4,575 | 6,005 | 2,287 | 3,718 | 14,444 | |||||||
| Incidence model characteristicsd | ||||||||||||||
| Diabetes 1998 (%) | 7.71* | 8.95 | 6.78 | 5.21 | 5.31 | 5.16 | 6.72*** | |||||||
| Comorbidity without diabetes, M (SD) | 0.71 (0.85) | 0.68 (0.80) | 0.73 (0.89) | 1.24 (1.02) | 1.24 (1.01) | 1.24 (1.02) | 0.92*** (0.96) | |||||||
| Age, M (SD) | 61.72 (3.18) | 61.71 (3.16) | 61.72 (3.20) | 80.72** (4.70) | 80.34 (4.60) | 80.94*** (4.74) | 69.26*** (10.07) | |||||||
| Women (%) | — | 42.87 | 57.13 | — | 36.83 | 63.17 | 59.53*** | |||||||
| Black (%) | 8.22** | 7.05 | 9.09 | 5.65 | 5.57 | 5.70 | 7.20** | |||||||
| Latino (%) | 5.67 | 5.60 | 5.73 | 3.10 | 2.88 | 3.22 | 4.65** | |||||||
| White (%) | 86.11** | 87.35 | 85.18 | 91.25 | 91.55 | 91.08 | 88.15*** | |||||||
| Parental schooling, AHEAD, M (SE) | 1.14 (0.90) | 1.14 (0.90) | 1.13 (0.90) | 0.84 | ||||||||||
| Parental schooling, HRS, M (SD) | 9.49*** (3.34) | 9.67 (3.29) | 9.36 (3.37) | |||||||||||
| Married/partnered (%) | 76.19*** | 82.94 | 71.13 | 53.95*** | 77.65 | 40.14 | 67.37*** | |||||||
| Respondent schooling, M (SD) | 12.69*** (2.86) | 12.99 (3.00) | 12.48 (2.72) | 10.64 (5.16) | 10.74 (5.36) | 10.58 (5.04) | 11.88*** (4.06) | |||||||
| Income, Mdn (SD) | 45,116 *** (53,347) | 50,740 (63,154) | 41,100 (44,297) | 20,000*** (30,700) | 24,000 (38,287) | 18,000 (24,698) | 32,000*** (47,686) | |||||||
| Net worth, Mdn (SD) | 126,000*** (565,016) | 128,000 (622,679) | 123,000 (519,345) | 120,000*** (359,425) | 153,000 (388,492) | 10,000 (388,398) | 123,000 (494,037) | |||||||
| Behavioral health risks | ||||||||||||||
| Underweight (%) | 1.10*** | 0.36 | 1.65 | 3.08*** | 1.09 | 4.24 | 1.88*** | |||||||
| Obese (%) | 22.50* | 20.85 | 23.73 | 12.78 | 10.37 | 14.19 | 18.64*** | |||||||
| Sedentary (%) | 77.65*** | 74.50 | 80.02 | 61.84*** | 54.43 | 66.12 | 71.37*** | |||||||
| Nondrinker (%) | 38.41*** | 29.32 | 45.22 | 53.07*** | 41.73 | 59.68 | 44.23*** | |||||||
| Heavy drinker (%) | 4.40*** | 8.11 | 1.62 | 1.76** | 2.81 | 1.14 | 3.35*** | |||||||
| Past smoker (%) | 39.52*** | 49.67 | 31.91 | 44.08*** | 67.44 | 30.46 | 41.33*** | |||||||
| Current smoker (%) | 22.98 | 23.82 | 22.36 | 8.01 | 8.74 | 7.58 | 17.04*** | |||||||
| Unweighted n | 5,659 | 2,373 | 3,286 | 3,233 | 1,199 | 2,034 | 8,892 | |||||||
Note: Prevalence model data are from the Health and Retirement Study (HRS), 1992 (N = 8,439); and the Study of Asset and Health Dynamics Among the Oldest Old (AHEAD), 1993 (N = 6,005). Incidence model data are from the Health and Retirement Study, 1992, 1994, 1998 (N = 5,659); and the Study of Asset and Health Dynamics Among the Oldest Old, 1993, 1995, 1998 (N = 3,233). SD = standard deviation; SE = standard error.
aAsterisks refer to significant test differences between men and women.
bAsterisks refer to significant test differences between middle-aged and older adults.
cDescriptive statistics are calculated on the basis of complete, matched data for baseline Health and Retirement Study (N = 8,439) and Study of Asset and Health Dynamics Among the Oldest Old (N = 6,005) samples.
dDescriptive statistics are calculated on the basis of complete, matched data across three waves of the Health and Retirement Study (N = 5,659) and Study of Asset and Health Dynamics Among the Oldest Old (N = 3,233) samples.
*p ≤.05; **p ≤.01; ***p ≤.001.
Odds Ratios of the Effects of Ascribed, Early-Life, and Achieved Social Status on Diabetes Prevalence in Middle-Aged and Older Adults in the United States.
| Middle-Aged Adults (aged 51–61) | Older Adults (aged 70 and older) | |||||||||
|---|---|---|---|---|---|---|---|---|---|---|
| Predictor Variable | Model 1 | Model 2 | Model 3 | Model 1 | Model 2 | Model 3 | ||||
| Age | 1.074*** | 1.071*** | 1.074*** | 0.965*** | 0.962*** | 0.961*** | ||||
| Women | 0.898 | 0.893 | 0.889 | 0.815* | 0.819* | 0.805* | ||||
| Black | 2.250*** | 2.176*** | 1.942*** | 2.178*** | 1.953*** | 1.854*** | ||||
| Latino | 1.570*** | 1.368* | 1.300* | 2.143*** | 1.772*** | 1.627*** | ||||
| Parental schooling | 0.938*** | 0.958** | 0.960* | 0.884* | 0.923 | 0.928 | ||||
| Married | 0.846 | 0.850 | 1.041 | 0.875 | 0.891 | 0.939 | ||||
| Years of schooling | 0.949*** | 0.972* | 0.961** | 0.970 | ||||||
| Economic resources | 0.888*** | 0.931** | ||||||||
| Wald χ2 (df) | 26.031*** (6, 47) | 24.485*** (7, 46) | 30.461*** (8, 45) | 21.717*** (6, 46) | 20.129*** (7, 45) | 20.143*** (8, 44) | ||||
Note: Data are from the Health and Retirement Study, 1992 (N = 8,439); and the Study of Asset and Health Dynamics Among the Oldest Old, 1993 (N = 6,005).
*p ≤.05; **p ≤.01; ***p ≤.001.
Odds Ratios of the Effects of Ascribed, Early-Life, and Achieved Social Status and Health Risk Factors on Diabetes Incidence in Middle-Aged and Older Adults in the United States.
| Middle-Aged Adults (aged 51–61) | Older Adults (aged 70 and older) | |||||||||||||
|---|---|---|---|---|---|---|---|---|---|---|---|---|---|---|
| Predictor Variable | Model 1 | Model 2 | Model 3 | Model 4 | Model 1 | Model 2 | Model 3 | Model 4 | ||||||
| Comorbidity | 1.627*** | 1.608*** | 1.587*** | 1.418*** | 1.344*** | 1.334*** | 1.324*** | 1.278** | ||||||
| Age | 1.029 | 1.028 | 1.029 | 1.037 | 0.972 | 0.968 | 0.966 | 0.975 | ||||||
| Women | 0.667** | 0.655*** | 0.656*** | 0.594*** | 0.961 | 0.967 | 0.945 | 0.865 | ||||||
| Black | 1.737*** | 1.691*** | 1.616** | 1.476** | 1.162 | 1.043 | 0.955 | 0.929 | ||||||
| Latino | 2.481*** | 2.145*** | 2.115*** | 2.298*** | 1.283 | 1.102 | 0.983 | 0.853 | ||||||
| Parental schooling | 0.979 | 1.004 | 1.005 | 1.016 | 0.848 | 0.898 | 0.907 | 0.931 | ||||||
| Married | 0.848 | 0.856 | 0.925 | 0.871 | 0.931 | 0.963 | 1.024 | 1.018 | ||||||
| Years of schooling | 0.940** | 0.948** | 0.962 | 0.960* | 0.966 | 0.973 | ||||||||
| Economic resources | 0.952* | 0.947* | 0.910 | 0.933 | ||||||||||
| Underweight 1994/1995 | 0.124 | —a | ||||||||||||
| Obese 1994/1995 | 3.556*** | 2.531*** | ||||||||||||
| Sedentary 1994/1995 | 1.184 | 1.290 | ||||||||||||
| Nondrinker 1994/1995 | 1.343** | 1.057 | ||||||||||||
| Heavy drinker 1994/1995 | 0.640 | 0.886 | ||||||||||||
| Past smoker 1994/1995 | 1.371* | 1.606 | ||||||||||||
| Current smoker 1994/1995 | 1.319 | 0.958 | ||||||||||||
| Wald χ2 (df) | 33.782 (7, 46) | 31.446 (8, 45) | 28.240 (9, 44) | 20.591 (16, 37) | 7.635 (7, 47) | 7.232 (8, 46) | 6.304 (9, 45) | 7.158 (15, 39) | ||||||
Note: Data are from the Health and Retirement Study, 1992, 1994, 1998 (N = 5,659); and the Study of Asset and Health Dynamics Among the Oldest Old, 1993, 1995, 1998 (N = 3,233).
aUnderweight dummy variable in the older adults sample was collinear with the outcome variable and was therefore deleted from the analysis.
*p ≤.05; **p ≤.01; ***p ≤.001.
An earlier version of this article was presented at the 99th Annual Meeting of the American Sociological Association, San Francisco, California, August 14–17, 2004. The research reported here was supported by Grant AG-015437 from the National Institute on Aging. We gratefully acknowledge the research assistance of Pauline P. Mitchell. We also thank three anonymous reviewers; Chuck Longino, former editor of the Journal of Gerontology: Social Sciences; and Ken Ferraro, current editor of the Journal, for their feedback and guidance in preparing the final version of this article.
References
Adler, N., Boyce, T., Chesney, M. A., Cohen, S., Folkman, S., Kahn, R. L., et al. (
Allison, P. D. (
Alwin, D. F., Wray, L. A. (
Best, L. E. (
Blackwell, D. L., Hayward, M. D., Crimmins, E. M. (
Blaum, C. S., Ofstedal, M. B., Langa, K. M., Wray, L. A. (
Brancati, F. L., Whelton, P. K., Kuller, L. H., Klag, M. J. (
Crimmins, E. M. (
Dannefer, D. (
Feinstein, J. S. (
Ferraro, K. F., Farmer, M. M. (
Fisher, G. G., Faul, J. D., Weir, D. R., Wallace, R. B. (
Franks, M. H., Pienta, A. M., Wray, L. A. (
Harris, M. I. (
Hayward, M. D., Crimmins, E. M., Miles, T., Yang, Y. (
Hayward, M. D., Gorman, B. K. (
Hayward, R. A., Manning, W. G., Kaplan, S. H., Wagner, E. H., Greenfield, S. (
House, J. S., Lepkowski, J. M., Kinney, A. M., Mero, R. P., Kessler, R. C., Herzog, A. R. (
Juster, F. T., Suzman, R. (
Kuh, D., Power, C., Blane, D., Bartley, M. (
Lantz, P. M., House, J. S., Lepkowski, J. M., Williams, D. R., Mero, R. P., Chen, J. (
Lantz, P. M., Lynch, J. W., House, J. S., Lepkowski, J. M., Mero, R. P., Musick, M. A., et al. (
Lu, N., Samuels, M. E., Wilson, R. (
Lynch, J. W., Kaplan, G. A., Salonen, J. T. (
Marmot, M. G., Shipley, M. J. (
McEwen, B. S., Seeman, T. (
Moen, P. (
National Research Council. (
Oakes, J. M., Rossi, R. H. (
O'Rand, A. M. (
Preston, S. H., Hill, M. E., Drevenstedt, G. L. (
Ross, C. E., Mirowsky, J. (
Ross, C. E., Wu, C. (
Ross, C. E., Wu, C. (
Soldo, B. J., Hurd, M. D., Rodgers, W. L., Wallace, R. B. (
Turner, C. F., Smith, T. K., Fitterman, L. K., Reilly, T., Pate, K., Witt, M. B., et al. (
Umberson, D. (
Umberson, D. (
Umberson, D., Williams, K., Powers, D. A., Liu, H., Needham, B. (
Wadsworth, M. E. J. (
Wallace, R. B., Herzog, A. R. (
Whitfield, K. E., Weidner, G., Clark, R., Anderson, N. B. (
Williams, D. R. (
Williams, D. R., Collins, C. (
Winkleby, M. A., Fortmann, S. P., Barrett, D. C. (
Wray, L. A., Alwin, D. F., McCammon, R. J. (
Wray, L. A., Blaum, C. S. (
Wray, L. A., Blaum, C. S., Ofstedal, M. B., Herzog, A. R. (
Wray, L. A., Herzog, A. R., Willis, R. J., Wallace, R. B. (

