


Abstract
The authors examined whether low levels of social engagement in midlife and late life were associated with the risk of incident dementia in 2,513 Japanese-American men who have been followed since 1965 as part of the Honolulu Heart Program and the Honolulu-Asia Aging Study. In 1991, assessment of dementia began; incident dementia cases (n = 222) were diagnosed in 1994 and 1997. Social engagement was assessed in midlife (1968) and late life (1991). The relation between social engagement and dementia risk was examined using Cox proportional hazards models. No level of midlife social engagement was associated with the risk of dementia. In late life, compared with participants in the highest quartile of late-life social engagement, those in the lowest quartile had a significantly increased risk of dementia (hazard ratio = 2.34, 95% confidence interval: 1.18, 4.65). However, compared with those who were in the highest quartile of social engagement at both midlife and late life, only decreased social engagement from midlife to late life was associated with an increased risk of dementia (hazard ratio = 1.87, 95% confidence interval: 1.12, 3.13). Although low social engagement in late life is associated with risk of dementia, levels of late-life social engagement may already have been modified by the dementing process and may be associated with prodromal dementia.
The stress response and levels of associated hormones, which have been linked to brain function (1, 2), may be modified by social engagement. Previous epidemiologic studies have suggested that having a large number of social contacts, having satisfying social relationships, and participating in productive or cognitively stimulating activities are associated with a reduced risk of late-age cognitive decline and dementia (3–9). Most of these studies have been based on cross-sectional social and activity data collected close to the time at which dementia was diagnosed or function declined. With short intervals between social assessment and dementia diagnosis, it is difficult to determine whether social connections reduce the risk of dementia or reduced social engagement is a result or indicator of prodromal dementia. To sort out this temporal association, measures of social engagement during periods long before the dementia prodrome and those closer to dementia onset are needed. The Honolulu-Asia Aging Study, a prospective study of neurologic diseases in the elderly, is a continuation of the Honolulu Heart Program, which began following a cohort of Japanese-American men in 1965 when they were 45–60 years old. In 1968, when most (96 percent) of the men were still working, a measure of social engagement was administered; a similar social engagement measure was administered in 1991, when most (95 percent) of the men were retired.
In addition to assessing the relation between dementia risk and a single level of social engagement in midlife or late life, we studied change in social engagement to better understand the trajectory to low social engagement in late life (figure 1). Decreases in social engagement from midlife to late life may reflect distinct processes related to dementia, which are different from those of consistently low levels of social engagement. Consistently low social engagement may reflect metabolic characteristics or such constructs as personality type. Long-term exposure to stress increases the risk of dementia (10), and it could be hypothesized that social engagement may reduce stress and that persons with consistently low levels of social engagement in mid- and late life are exposed to situations generating long-term stress.
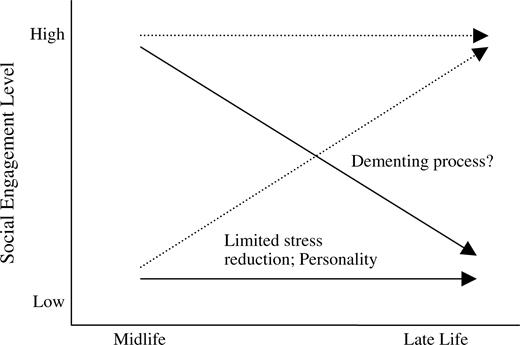
Trajectories and potential mechanisms of mid- to late-life change in social engagement.
In this study, we examined whether mid- and late-life social engagement, defined as maintained social connections and participation in social activities, was associated with the risk of incident dementia in a community-based cohort of elderly men. We also studied the impact of change in social engagement from midlife to late life on the risk of dementia.
MATERIALS AND METHODS
Study population
The Honolulu Heart Program cohort included Japanese-American men born between 1900 and 1919 who were living on the island of Oahu, Hawaii, at the time of enrollment in 1965 (11). Three midlife examinations, conducted as part of the Honolulu Heart Program in 1965, 1968–1970, and 1971–1974, included collection of clinical and demographic information. In 1991, the Honolulu-Asia Aging Study was started as an extension of the Honolulu Heart Program. At this examination, 3,734 members of the Honolulu Heart Program cohort (80 percent of the survivors) participated. Subsequent examinations were conducted in 1994 and 1997. The Honolulu-Asia Aging Study was approved by the institutional review boards of the Kuakini Medical Center (Honolulu, Hawaii) and the Honolulu Department of Veterans Affairs, and all participants gave written informed consent. Study interviews were conducted in the participant's preferred language, Japanese or English.
Assessment of cognitive function and dementia
Dementia was assessed during examinations 4 (1991–1993; prevalent cases), 5, and 6 (incident cases; 1994–1996 and 1997–1999) by means of a multistep procedure described elsewhere (12, 13). The 100-point Cognitive Abilities Screening Instrument (CASI) was used to screen the entire sample. The CASI is a cross-culturally validated test of global cognitive function designed for use in comparative studies of dementia in the United States and Japan (14).
In the prevalent phase (1991–1993), CASI score and age were used to identify a subgroup of participants for dementia evaluation, and in the incident phases (1994–1996 and 1997–1999), an education-adjusted cutpoint (77 for participants with low education and 79 for those with high education) or an absolute drop (≥9 points) in CASI score was used to identify a subgroup for specific dementia examination. At all examinations, the clinical dementia examination included the Consortium to Establish a Registry for Alzheimer's Disease neuropsychological battery (15), a neurologic examination, and a proxy interview including the Informant Questionnaire on Cognitive Decline in the Elderly (16). Subjects who met the criteria for dementia underwent neuroimaging and blood tests for diagnosis of dementia subtype. A consensus diagnosis was reached by the study neurologist and at least two other physicians with expertise in geriatrics and dementia. The panel used the Diagnostic and Statistical Manual of Mental Disorders, Third Edition, Revised (17), criteria to diagnose incident dementia, the National Institute of Neurological and Communicative Disorders and Stroke–Alzheimer's Disease and Related Disorders Association criteria (18) to diagnose Alzheimer's disease, and the Alzheimer's Disease and Treatment Centers criteria (19) to diagnose vascular dementia. A total of 123 men were diagnosed with incident dementia at examination 5, and 99 men were diagnosed with incident dementia at examination 6. Of the 222 men diagnosed with incident dementia, 134 had Alzheimer's disease, 47 had vascular dementia, and 41 had other types of dementia.
Assessment of social engagement
Midlife social engagement.
Midlife social engagement was assessed at examination 2 (1968–1970), an average of 27.5 years before dementia diagnosis. Five indicators of social engagement similar to measures employed in other studies (5, 20) were used: marital status (0 = unmarried, 1 = married); living arrangement (0 = living alone or with spouse only, 1 = living with extended family); participation in social, political, or community groups (0 = less than weekly, 1 = weekly or more frequently); participation in social events with coworkers (0 = less than weekly, 1 = weekly or more frequently); and the existence of a confidant relationship (0 = no, 1 = yes). A composite index of midlife social engagement was constructed by summing the scores for all five midlife indicators. Based on the sample distribution of the composite index, men were categorized as having low (0–1 social tie; 16 percent of the sample with midlife data), medium-low (2 ties; 38 percent), medium-high (3 ties; 32 percent), or high (4–5 ties; 14 percent) levels of midlife social engagement.
Social engagement items were assessed at midlife as part of an acculturation questionnaire. Because the cohort reacted negatively to some of the acculturation questions, the questionnaire was discontinued in a manner unrelated to participant characteristics at that time. This resulted in our having no data on midlife social engagement for 765 persons.
Late-life social engagement.
Data on late-life social engagement were collected at examination 4 in 1991–1993, an average of 4.6 years prior to dementia diagnosis. Five indicators of social engagement were assessed: marital status (0 = unmarried, 1 = married); living arrangement (0 = living alone or with spouse only, 1 = living with extended family); participation in social, political, or community groups (0 = less than weekly, 1 = weekly or more frequently); number of face-to-face or telephone contacts with close friends per month (0 = ≤4 contacts, 1 = ≥5 contacts); and the existence of a confidant relationship (0 = no, 1 = yes). A composite measure of late-life social engagement was constructed by summing the scores for all five late-life indicators. Based on the late-life composite index, participants were categorized (using the same groupings as in midlife) as having low (0–1 social tie; 11 percent of the sample), medium-low (2 ties; 27 percent), medium-high (3 ties; 32 percent), or high (4–5 ties; 30 percent) levels of late-life social engagement.
Mid- to late-life change in social engagement.
As discussed above, marital status, living arrangement, group participation, and having a confidant relationship were measured at both midlife and late life. To more validly reflect the change in social engagement that occurs after retirement, the midlife item on coworker socializing was replaced in the late-life questionnaire by contact with close friends. Men were classified as having increasing, decreasing, or consistently high or low social engagement at both midlife and late life. We classified those who were missing data at midlife by their late-life status (missing–low and missing–high).
Assessment of covariates
We controlled for a number of factors that could be related to dementia and social engagement. Age (as the time scale for the Cox model) and educational level (0–8, 9–12, and ≥13 years) were assessed by questionnaire. Information on history of stroke and coronary heart disease was obtained from continuous surveillance of hospital discharge and death records on Oahu from 1965 through 1997. At examination 4, disability and depression were measured. Disability was dichotomized as difficulty performing one or more activities of daily living versus no difficulty. Depressive symptoms were measured with the short version of the Center for Epidemiologic Studies Depression Scale (21); scores were dichotomized as depressed (score ≥9) or not depressed. Apolipoprotein E (APOE) genotype, a risk factor for Alzheimer's disease, was categorized as the presence of at least one ε4 allele versus no ε4 allele.
Analytical sample
Of the 3,734 participants in the Honolulu-Asia Aging Study, 226 had dementia at examination 4, so the incident cohort included 3,508 persons. Of these 3,508 persons, 521 died before examination 5, 359 did not participate in examination 5, and 115 had missing data on late-life social engagement, resulting in a sample size of 2,513 men for the analysis. Compared with men who died or dropped out of the sample, those who survived were younger (79.2 years vs. 76.8 years; p < 0.0001) and had higher CASI scores (78.7 vs. 87.1; age-adjusted p < 0.001), more education (9.8 years vs. 10.9 years; age-adjusted p < 0.001), less cerebrovascular disease (7.2 percent vs. 2.6 percent; age-adjusted p < 0.001), less coronary heart disease (13.2 percent vs. 9.8 percent; age-adjusted p < 0.001), and less impairment in activities of daily living (17.8 percent vs. 3.9 percent; age-adjusted p < 0.001). The prevalence of depression and the percentage of men with at least one APOE ε4 allele did not differ between the two samples.
Compared with men with complete midlife data, men with no data on social connections in midlife had significantly lower CASI scores at examination 4 (87.1 vs. 86.2; age-adjusted p = 0.003), but they did not differ with respect to dementia incidence, age, education, cardiovascular disease, coronary heart disease, disability, depression, or APOE ε4 status. Compared with the sample of 2,513 men, the 115 men who were missing data on late-life social engagement were significantly older at examination 4 (76.8 years vs. 78.1 years; p = 0.002) and had lower CASI scores (87.1 vs. 85.9; age-adjusted p < 0.001), but they did not differ with regard to dementia incidence or other baseline characteristics.
Data analysis
We compared sample characteristics by level of social engagement in mid- and late life using analysis of variance for continuous variables and chi-squared tests for categorical variables. A Cox proportional hazards regression model with delayed entry and age as the time scale was used to identify and adjust for confounding variables. Age of onset was assigned as the midpoint of the interval between the last examination without dementia and the first follow-up examination with dementia. Subjects who died or did not participate in subsequent follow-up examinations were censored as of the time of their last evaluation. In addition to age and education, associations were adjusted for history of stroke, history of coronary heart disease, disability, depression, CASI score at examination 4, and APOE ε4 status. Analyses were performed using the Statistical Analysis System, version 8.0 (SAS Institute, Inc., Cary, North Carolina).
RESULTS
Midlife
Compared with men with high levels of social engagement at midlife, men with low levels of social engagement were significantly older and less likely to be in the high education category (table 1). There were no significant differences in mean CASI score, history of cerebrovascular disease, coronary heart disease, disability, depression, or APOE ε4 status by midlife social engagement.
Demographic and health characteristics by level of midlife and late-life social engagement† among men, Honolulu-Asia Aging Study, 1965–1997
Midlife social engagement (1968–1970) | Late-life social engagement (1991–1993) | |||||||||||||||||
|---|---|---|---|---|---|---|---|---|---|---|---|---|---|---|---|---|---|---|
| Low (n = 287) (11%) | Medium-low (n = 662) (26%) | Medium-high (n = 545) (22%) | High (n = 253) (10%) | Missing midlife data (n = 765) (31%) | Low (n = 284) (11%) | Medium-low (n = 669) (27%) | Medium-high (n = 798) (32%) | High (n = 762) (30%) | Total sample (N = 2,513) (100%) | |||||||||
| Examination 2 (1968–1970) | ||||||||||||||||||
| Mean age (years) | 54.9 (4.1)**,‡ | 53.2 (4.2) | 53.4 (3.9) | 53.3 (3.9) | 53.8 (4.3) | 54.6 (4.4)** | 54.1 (4.0) | 53.6 (4.1) | 53.4 (4.0) | 53.8 (4.1) | ||||||||
| Years of education (%) | ||||||||||||||||||
| 0–8 | 31.5 | 28.0 | 23.4 | 16.2 | 28.5 | 31.4 | 30.2 | 27.6 | 24.2 | 27.6 | ||||||||
| 9–12 | 55.5 | 53.6 | 48.1 | 47.0 | 55.2 | 56.9 | 50.4 | 51.5 | 49.2 | 51.2 | ||||||||
| ≥13 | 13.0 | 18.4 | 28.5 | 36.8** | 16.3 | 11.7 | 19.4 | 20.9 | 26.6* | 21.2 | ||||||||
| Examination 4 (1991–1993) | ||||||||||||||||||
| Apolipoprotein E ε4 carrier§ (%) | 20.7 | 16.9 | 20.2 | 20.6 | 17.2 | 19.7 | 17.7 | 17.1 | 21.9 | 18.5 | ||||||||
| Mean age (years) | 77.7 (4.3)** | 76.8 (4.1) | 76.4 (3.7) | 76.3 (3.9) | 76.9 (3.9) | 77.7 (4.4)** | 77.1 (3.8) | 76.6 (4.0) | 76.3 (3.9) | 76.8 (4.0) | ||||||||
| Mean CASI¶ score# | 86.3 (8.6) | 87.1 (7.6) | 87.7 (7.4) | 89.5 (7.3) | 86.7 (8.6) | 85.4 (8.5)* | 86.5 (7.9) | 87.2 (7.7) | 88.1 (7.5) | 87.1 (8.6) | ||||||||
| Cerebrovascular disease (%) | 2.1 | 1.6 | 2.3 | 4.0 | 2.4 | 3.0 | 2.1 | 3.1 | 1.9 | 2.6 | ||||||||
| Coronary heart disease (%) | 13.8 | 10.4 | 9.3 | 9.3 | 9.8 | 10.2 | 8.7 | 10.3 | 10.2 | 9.8 | ||||||||
| Disabled†† (%) | 4.2 | 3.6 | 3.9 | 6.7 | 3.4 | 6.0 | 4.4 | 3.0 | 3.6 | 3.9 | ||||||||
| Depression‡‡ (%) | 11.2 | 9.6 | 8.5 | 9.6 | 8.8 | 12.6* | 10.9 | 8.6 | 7.7 | 9.4 | ||||||||
p < 0.01 (age-adjusted);
p < 0.0001.
Level of social engagement was defined according to number of social connections, as follows: low, 0–1 social tie; medium-low, 2 ties; medium-high, 3 ties; high, 4–5 ties.
Numbers in parentheses, standard deviation.
Subjects with at least one apolipoprotein E ε4 allele were considered ε4 carriers. Information on apolipoprotein E genotype was not available for 15 subjects.
CASI, Cognitive Abilities Screening Instrument (14).
Adjusted for age.
Subjects reporting difficulty performing one or more activities of daily living were considered disabled.
Subjects with scores ≥9 on the short version of the Center for Epidemiologic Studies Depression Scale (21) were considered depressed.
Late life
Men with low levels of social engagement were older, had a lower mean CASI score, were less likely to be in the high education category, and were more likely to exhibit symptoms of depression than were men with middle or high levels of social engagement in late life (table 1). There was no difference in history of cerebrovascular disease, history of coronary heart disease, or APOE ε4 status among the late-life social connection groups. Table 2 shows the incidence of dementia per 100 person-years (following examination 4 in 1991) for each indicator of social engagement and for the composite scores at midlife and late life.
Dementia incidence (per 100 person-years) by level of social engagement in midlife and late life, Honolulu-Asia Aging Study, 1965–1997*
Indicator of social engagement | % of participants | Dementia incidence (per 100 person-years) | Indicator of social engagement | % of participants | Dementia incidence (per 100 person-years) | ||||
|---|---|---|---|---|---|---|---|---|---|
| Midlife (1968–1970) social connections | Late-life (1991–1993) social connections | ||||||||
| Marital status | Marital status | ||||||||
| Unmarried | 5 | 1.3 | Unmarried | 16 | 2.6 | ||||
| Married | 95 | 1.7 | Married | 84 | 1.6 | ||||
| Living arrangement | Living arrangement | ||||||||
| Alone or with spouse only | 62 | 2.3 | Alone or with spouse only | 63 | 1.8 | ||||
| With extended family | 38 | 1.4 | With extended family | 37 | 1.7 | ||||
| Group participation | Group participation | ||||||||
| None | 63 | 1.7 | None | 59 | 2.0 | ||||
| One or more groups | 37 | 1.6 | One or more groups | 41 | 1.5 | ||||
| Confidant relationship | Confidant relationship | ||||||||
| No | 47 | 1.7 | No | 32 | 2.3 | ||||
| Yes | 53 | 1.6 | Yes | 68 | 1.5 | ||||
| Going out with coworkers | No. of contacts with close friends per month | ||||||||
| Regularly/occasionally | 51 | 1.7 | 0–4 | 51 | 1.9 | ||||
| Rarely/never | 49 | 1.7 | ≥5 | 49 | 1.6 | ||||
| Level of social engagement (no. of social connections) | Level of social engagement (no. of social connections) | ||||||||
| Low (0–1 tie) | 12 | 2.0 | Low (0–1 tie) | 11 | 2.6 | ||||
| Medium-low (2 ties) | 26 | 1.6 | Medium-low (2 ties) | 27 | 2.2 | ||||
| Medium-high (3 ties) | 22 | 1.7 | Medium-high (3 ties) | 32 | 1.8 | ||||
| High (4–5 ties) | 10 | 1.5 | High (4–5 ties) | 30 | 1.1 | ||||
| Missing data | 30 | 1.7 | |||||||
Calculation of person-years started with examination 4 (1991–1993).
Mid- and late-life hazard models
In the fully adjusted hazard model, there was no association between midlife social engagement and risk of dementia (table 3). In contrast, men in the lowest late-life social engagement group had a significantly higher risk of dementia than men in the highest late-life social engagement group. There was also a significant trend of increasing dementia risk with decreasing late-life social engagement. Findings were similar when subtypes of dementia (Alzheimer's disease and vascular dementia) were examined (data not shown).
Hazard ratios for the association between social connections and risk of incident dementia, Honolulu-Asia Aging Study, 1965–1997
Level of social engagement (no. of social connections) | No. of subjects | Model 1* | Model 2† | ||||
|---|---|---|---|---|---|---|---|
| HR‡ | 95% CI‡ | HR | 95% CI | ||||
| Midlife (1968–1970) | |||||||
| High (4–5 ties) | 253 | 1.0§ | 1.0§ | ||||
| Medium-high (3 ties) | 547 | 1.11 | 0.66, 1.87 | 1.08 | 0.63, 1.83 | ||
| Medium-low (2 ties) | 662 | 1.02 | 0.61, 1.71 | 0.92 | 0.54, 1.56 | ||
| Low (0–1 tie) | 286 | 1.10 | 0.62, 1.95 | 1.08 | 0.60, 1.92 | ||
| Missing data | 765 | 1.12 | 0.68, 1.85 | 0.98 | 0.59, 1.65 | ||
| ptrend¶ | NS‡ | NS | |||||
| Late life (1991–1993) | |||||||
| High (4–5 ties) | 762 | 1.0§ | 1.0§ | ||||
| Medium-high (3 ties) | 798 | 1.17 | 0.56, 2.44 | 1.38 | 0.66, 2.90 | ||
| Medium-low (2 ties) | 669 | 1.81 | 0.91, 3.62 | 1.98 | 0.98, 4.00 | ||
| Low (0–1 tie) | 284 | 2.25 | 1.14, 4.45 | 2.34 | 1.18, 4.65 | ||
| ptrend | <0.001 | <0.001 | |||||
Adjusted for age (as the time scale).
Adjusted for age (as the time scale), education, Cognitive Abilities Screening Instrument (14) score, apolipoprotein E ε4 allele status, cerebrovascular disease, coronary heart disease, depression, and disability. (See table 1 for definitions.)
HR, hazard ratio; CI, confidence interval; NS, not significant.
Reference category.
Calculation of ptrend excluded missing data.
Change from midlife to late life
Examining change over time provides insight into subgroups that comprise the high and low late-life social engagement groups. Fifteen percent of the participants decreased their level of social engagement from midlife to late life; 32 percent increased their level of social engagement; 12 percent had a high level of social engagement in both midlife and late life; and 10 percent had low social engagement at both time points.
Compared with men who had high social engagement in both midlife and late life, men whose social engagement decreased from midlife to late life had a significantly higher risk of dementia (table 4). Men with low social engagement in both midlife and late life had a slightly higher risk of dementia than those with consistently high engagement. Increased social engagement from midlife to late life was not associated with a reduced risk of dementia.
Results from a proportional hazards model of the relation between all types of dementia and mid- to late-life change in social engagement,* Honolulu Asia Aging Study, 1965–1997
Level of social engagement | Total sample | Incident cases (%) | Risk of all-cause dementia | ||||||||
|---|---|---|---|---|---|---|---|---|---|---|---|
| Across life span (midlife to late life) | In midlife (1968–1970) | In late life (1991–1993) | No. | % | Hazard ratio† | 95% confidence interval | |||||
| Consistently high | High | High | 310 | 12 | 7 | 1.00 | |||||
| Increased | Low | High | 805 | 32 | 7 | 0.93 | 0.56, 1.54 | ||||
| Decreased | High | Low | 383 | 15 | 12 | 1.87 | 1.12, 3.13 | ||||
| Consistently low | Low | Low | 250 | 10 | 12 | 1.65 | 0.94, 2.90 | ||||
| Midlife data unavailable | |||||||||||
| Missing–low | No data | Low | 293 | 12 | 10 | 1.38 | 0.79, 2.44 | ||||
| Missing–high | No data | High | 472 | 19 | 9 | 1.27 | 0.75, 2.15 | ||||
Level of social engagement was defined according to number of social connections, as follows: low, 0–1 social tie; medium-low, 2 ties; medium-high, 3 ties; high, 4–5 ties.
DISCUSSION
In this study, we examined the association of social engagement, defined as maintained social connections and participation in social activities, with the risk of dementia in older Japanese-American men. We found increasing risk with decreasing social engagement in late life but no association between midlife social engagement and late-life dementia. Persons whose level of social engagement declined from midlife to late life had the highest risk of dementia, which suggests that low social engagement in late life may be a prodromal symptom of dementia.
We observed a stronger association for low late-life social engagement and dementia, which is consistent with previous studies of social factors and dementia risk (3–5). However, these studies had relatively short intervals between acquisition of social data and the time of dementia diagnosis. The design of the Honolulu-Asia Aging Study uniquely allows for prospective examination of the relation between social engagement, measured an average of 27.5 years (midlife) and 4.6 years (late life) prior to dementia diagnosis, and risk of dementia. With these data, we were able to see that much of the increased risk occurred among persons whose social engagement declined from midlife to late life.
There are a number of potential limitations of this study. First, because of the design of the Honolulu-Asia Aging Study, we were unable to examine gender differences in the association between social engagement and dementia risk. Second, although there is evidence that the quality of social relationships is an important factor conferring protection against dementia (5), we were only able to examine the existence of relationships, not satisfaction with those relationships. Third, a possible concern about the measure of mid- to late-life change in social engagement is that the questions posed were not the same at the two time points. However, it is important to include life-stage-appropriate indicators of social engagement while preserving consistency in the overall measure of social engagement over several time points. In this study, measures of mid- and late-life social engagement differed by only one question: The midlife question assessing social engagement with coworkers was replaced with a late-life question about monthly contact with friends. Although coworkers may provide opportunities for social engagement at midlife, 95 percent of our sample was retired at the time of the late-life measurement, so this question was no longer appropriate or discriminatory. The high percentage of participants with increasing social engagement may reflect changes in the amount of leisure time available in retirement.
Some men had consistently low levels of social engagement from midlife to late life, and some men decreased their social engagement from midlife to late life. We found that participants with decreased social engagement from midlife to late life were significantly more likely to become demented than those who had relatively large social networks in both midlife and late life. Those who had few social relationships in both midlife and late life were only at a slightly increased risk of dementia.
Changes from midlife to late life may be associated with brain changes that occur with the dementing process. By examining change or stability in social indicators from midlife to late life, we can begin to differentiate trajectories of change that may reflect health or other factors. Consistently low social engagement over a period of 27 years may reflect other factors, such as personality type, that may be associated with the risk of dementia or depression or a limited ability to reduce stress (figure 1). The findings of this study and other studies (3–9) could also reflect a protective effect of social engagement in late life, irrespective of midlife levels. Clearly, more work is needed to clarify the directionality and strength of the relation between late-life social engagement and dementia. In addition, methods of assessing social engagement over the lifetime need to be further developed or applied to dementia studies. These methods could examine which indicators of social engagement best capture the concept of social engagement. Additionally, it is important to account for the effect of physical impairment on functional status and subsequent social engagement. An interim measure of social engagement, made 10–15 years prior to dementia diagnosis, would be helpful in further clarifying the long-term relation between social engagement and dementia and in understanding where in the life span and the disease process social engagement may most effectively modify dementia risk.
There are a number of mechanisms by which social engagement could reduce the risk of dementia. In animal studies, environmental complexity and richness prevent cognitive decline (22) and promote neurogenesis (23, 24). In humans, the “cognitive reserve” hypothesis suggests that social and physical activity may increase a person's ability to tolerate brain pathology through enhanced synaptic activity and more efficient brain recovery and repair (25, 26). Social experiences influence a wide range of biologic systems and may also reduce the risk of dementia through stress reduction or through reduction of cardiovascular disease risk factors that are also associated with brain disease (27). Hormones such as glucocorticoids and corticosteroids are associated with the stress response and brain function, particularly in the hippocampus (1, 2). Levels of these hormones may be altered by stress reduction associated with social engagement.
These findings have implications for the design of future cognitive and social clinical intervention trials attempting to reduce the risk of dementia in older adults. On the basis of these results, it is important to consider both midlife and late-life social engagement when designing intervention trials. Previous work on the influence of leisure activity on Alzheimer's disease risk has suggested that interventions designed to enhance life experiences and activity in later life may reduce the risk of dementia (28). Our findings suggest that researchers implementing social-engagement interventions in late life need to consider the possibility that the dementing process may have already modified social engagement. Considering mid- to late-life trajectories of social engagement may provide insight about persons with low levels of social engagement in late life and may highlight those who are at greatest risk of dementia.
This study was supported by National Institute on Aging contract NO1-AG-4-2149 and National Heart, Lung, and Blood Institute contract NO1-HC-05102.
Conflict of interest: none declared.
References
De Kloet ER, Joëls M, Holsboer F. Stress and the brain: from adaptation to disease.
Fabrigoule C, Letenneur L, Dartigues JF, et al. Social and leisure activities and risk of dementia: a prospective longitudinal study.
Wang H-X, Karp A, Winblad B, et al. Late-life engagement in social and leisure activities is associated with a decreased risk of dementia: a longitudinal study from the Kungsholmen project.
Fratiglioni L, Wang H-X, Ericsson K, et al. Influence of social network on occurrence of dementia: a community-based longitudinal study.
Holtzman RE, Rebok GW, Saczynski JS, et al. Social network characteristics and cognition in middle-aged and older adults.
Scarmeas N, Levy G, Tang MX, et al. Influence of leisure activity on the incidence of Alzheimer's disease.
Wilson RS, Mendes de Leon CF, Barnes LL, et al. Participation in cognitive stimulating activities and risk of incident Alzheimer disease.
Crowe M, Andel R, Pedersen NL, et al. Does participation in leisure activities lead to reduced risk of Alzheimer's disease? A prospective study of Swedish twins.
Wilson RS, Evans DA, Bienias JL, et al. Proneness to psychological distress is associated with the risk of Alzheimer's disease.
Syme SL, Marmot MG, Kagan A, et al. Epidemiologic studies of coronary heart disease and stroke in Japanese men living in Japan, Hawaii and California: introduction.
White L, Petrovitch H, Ross GW, et al. Prevalence of dementia in older Japanese-American men living in Hawaii: The Honolulu-Asia Aging Study.
Havlik RJ, Izmirlian D, Petrovitch H, et al. APOE-ε4 predicts incident AD in Japanese-American men: The Honolulu-Asia Aging Study.
Teng EL, Hasegawa K, Homma A, et al. The Cognitive Abilities Screening Instrument (CASI): a practical test for cross-cultural epidemiological studies of dementia.
Morris JC, Heyman A, Mohs RC, et al. The Consortium to Establish a Registry for Alzheimer's Disease (CERAD), part I: clinical and neuropsychological assessment of Alzheimer's disease.
Jorm AF, Jacomb PA. The Informant Questionnaire on Cognitive Decline in the Elderly (IQCODE): socio-demographic correlates, reliability, validity and some norms.
American Psychiatric Association. Diagnostic and statistical manual of mental disorders. Third edition, revised. Washington, DC: American Psychiatric Association,
McKhann G, Drachman D, Folstein M, et al. Report of the NINCDS-ADRDA work group under the auspices of Department of Health and Human Services task force on Alzheimer's disease.
Chui HC, Victoroff JI, Margolin D, et al. Criteria for the diagnosis of ischemic vascular dementia proposed by the state of California Alzheimer's Disease Diagnostic and Treatment Centers.
Bassuk SS, Glass TA, Berkman LF. Social disengagement and incident cognitive decline in community-dwelling elderly persons.
Radloff LS. The CES-D Scale: a self-report depression scale for research in the general population.
Winocur G. Environmental influences on cognitive decline in aged rats.
Brown J, Cooper-Kuhn CM, Kemperman G, et al. Enriched environment and physical activity stimulate hippocampal but not olfactory bulb neurogenesis.
Kemperton G, Kuhn H, Gage FH. More hippocampal neurons in adult mice living in an enriched environment.
Stern Y. What is cognitive reserve? Theory and research application of the reserve concept.
Scarmeas N, Stern Y. Cognitive reserve: implications for diagnosis and prevention of Alzheimer's disease.
Fratiglioni L, Paillard-Borg S, Winblad B. An active and socially integrated lifestyle in late life might protect against dementia.

