


Abstract
Few studies have examined the impact of weight history. Extant data from the Atherosclerosis Risk in Communities Study were used to compare risk factors for normal-weight (body mass index: 18.5–24.9 kg/m2) adults with a history of weight loss (n = 775) with those for persons with a history of weight maintenance (n = 5,164). In this 1987–1998 US study, the authors also compared risk factors for preobese (body mass index: 25.0–29.9 kg/m2) adults with a history of weight gain (n = 1,296) versus weight maintenance (n = 6,721). They used mixed-models regression to adjust for ethnicity, gender, age, education, field center, smoking, alcohol consumption, follow-up time, and follow-up body mass index. Compared with adults with a history of weight maintenance, adults with a 3-year history of weight loss had more favorable total and low density lipoprotein cholesterol levels and similar glucose, high density lipoprotein cholesterol, and triglyceride levels. In contrast, preobese adults with a 3-year history of weight gain had equivalent glucose and lipid levels at follow-up compared with adults with a history of weight maintenance. These findings suggest that, in addition to current weight, weight history may impact glucose and lipid levels.
In the United States, cigarette smoking is the preventable cause of death and disease that is most influential (1); however, obesity has also become an important cause of preventable death (2). Evidence suggests that the effects of smoking on health can be reversed by quitting. Longitudinal studies have shown that the risk of cardiovascular disease decreases 50 percent 1 year after quitting smoking, and, after 15 years, the risk of coronary heart disease mortality is similar for former and never smokers (3). To our knowledge, analogous information on the temporal characteristics of cardiovascular disease risk with weight reduction is not available, although it is well known that fasting glucose and lipid levels improve with weight loss (4–7), while weight gain is associated with unfavorable changes in glucose (8–11) and lipid (12–14) levels.
It seems logical that a price would be paid for past obesity, such that adults of the same weight would have different risk profiles depending on their weight history. For example, one could hypothesize that preobese (body mass index (BMI; weight (kg)/height (m)2): 25.0–29.9 kg/m2) and obese (BMI: ≥30.0 kg/m2) adults who lose weight to become normal weight (BMI: 18.5–24.9 kg/m2) have a more unfavorable risk factor profile than adults who have maintained a normal weight. The objectives of this study were to determine 1) whether preobese and obese adults who lose weight over a 3-year or 9-year interval and become normal weight attain mean levels of cardiovascular disease risk factors similar to those for normal-weight adults who have maintained their weight over the interval; and 2) whether normal-weight adults who gain weight over a 3-year or 9-year interval and become preobese attain mean levels of cardiovascular disease risk factors similar to those for preobese adults with a history of weight maintenance. Risk factors examined included fasting glucose; total, low density lipoprotein (LDL), and high density lipoprotein (HDL) cholesterol; and triglycerides.
MATERIALS AND METHODS
Study population
The Atherosclerosis Risk in Communities (ARIC) Study is a prospective investigation of the natural history and etiology of atherosclerosis and cardiovascular disease in four US communities: Forsyth County, North Carolina; Jackson, Mississippi; the northwestern suburbs of Minneapolis, Minnesota; and Washington County, Maryland. Baseline data were collected between 1987 and 1989 on 15,792 adults 45–64 years of age. Three follow-up visits occurred at approximately 3-year intervals. The details of the study design have been described previously (15). This study was approved by the University of North Carolina at Chapel Hill Public Health Institutional Review Board on research involving human subjects.
Measures and covariates
Study participants were asked to fast for 12 hours prior to their clinic visit. Fasting blood samples were sent to the Central Clinical Chemistry Laboratory in Minneapolis and the Central Lipid Laboratory in Houston, Texas, for glucose and lipid determination. These laboratories participated in the Centers for Disease Control and Prevention's lipids standardization program, and the Centers for Disease Control and Prevention analyzed the laboratories continuously. Serum glucose levels were measured by using a hexokinase/glucose-6-phosphate dehydrogenase method. Total plasma cholesterol (16) and triglycerides (17) were determined by enzymatic methods. HDL cholesterol was measured after dextran-magnesium precipitation (18). The Friedewald method was used to calculate LDL cholesterol (19). LDL cholesterol was not calculated for participants whose triglyceride levels were ≥400 mg/dl (4.52 mmol/liter).
Age (date of birth), race/ethnicity, and gender were self-reported during the recruitment phase and were confirmed during the clinic visit. Cigarette smoking and alcoholic beverage consumption status were assessed at each visit, and participants were classified as current, former, or never. Educational level was assessed at baseline, and participants were categorized as having less than a high school education, being a high school graduate, or having at least some college education. Medication records for the previous 2 weeks were collected at each visit. The names of all medications were transcribed, coded, and then mapped to Medi-Span Therapeutic Classification (MTC) codes and American Hospital Formulary Service Classification Compilation (AHFSCC) codes. MTC codes for vitamin B3, antihyperlipidemic, and bile sequestrants or AHFSCC code for antilipemic agents were coded as lipid-lowering medications. Participants self-reported if they used any medications for diabetes or high blood sugar.
The participants were weighed without shoes and in a scrub suit to the nearest pound (1 pound = 0.454 kg) by using a beam balance scale at all visits. Their height (without shoes) was measured to the nearest centimeter by using a metal rule attached to a wall and a standard triangular headboard. As noted previously, BMI was calculated as weight in kilograms divided by height in meters squared. Percent weight change was calculated between consecutive visits (3-year interval) and the first and fourth visits (9-year interval). Percent weight change was used instead of absolute weight or BMI change because weight loss goals are often expressed as percentages in clinical settings and are expressed in this metric in the National Heart, Lung, and Blood Institute's obesity evidence report (4). Weight change was categorized as follows: ≥5.0 percent weight loss, 3.1–4.9 percent weight loss; weight maintenance (within 3.0 percent), 3.1–4.9 percent weight gain, and ≥5.0 percent weight gain. The bounds for weight maintenance were intentionally narrow because we preferred a strict definition for this group.
Samples for analyses
African Americans from Washington County or Minneapolis (n = 55) and participants who classified their ethnicity as other than White or African American (n = 48) were excluded because there were too few to enable us to conduct ethnic- and center-specific analyses. Similar trends were observed for each of the three 3-year intervals; therefore, we created a “stacked” data set for the 3-year analyses such that, for every study participant (11,478 Whites and 4,211 African Americans), one observation was available for each 3-year interval (N = 47,067 observations). A participant could be assigned different weight history categories for each of the 3-year intervals.
Weight losers and weight gainers were examined separately since we wanted to compare glucose and lipid levels for adults with the same BMI at follow-up but different weight histories. Therefore, we created four separate analysis data sets based on the interval length (3 years or 9 years), weight change group, and weight status at the beginning and end of the interval. In the text that follows, the beginning of the study interval is referred to as “baseline” and the end of the interval as “follow-up.” Analysis data sets for our studies of weight loss included only those participants who either 1) were normal weight at baseline and follow-up and maintained their body weight or 2) lost ≥3.0 percent of their body weight over the interval and their weight status changed from preobese or obese to normal weight. There were 5,164 normal-weight maintainers and 1,026 previously overweight weight losers for the 3-year analyses and 1,029 normal-weight maintainers and 347 previously overweight weight losers for the 9-year analyses. The analysis data sets for our studies of weight gain included only those participants who either 1) maintained their body weight and were preobese at baseline and follow-up or 2) gained ≥3.0 percent of their body weight over the interval and their weight status changed from normal weight to preobese. There were 6,721 preobese weight maintainers and 1,701 previously normal-weight gainers for the 3-year analyses and 1,316 preobese weight maintainers and 1,043 previously normal-weight gainers for the 9-year analyses. The general and outcome-specific exclusions for the four analysis data sets are summarized in table 1.
Summary of general and outcome-specific exclusions (no.),* by the five outcomes examined and four analysis data sets, Atherosclerosis Risk in Communities Study, 1987–1998
Glucose | Total cholesterol | LDL† cholesterol | HDL† cholesterol | Triglycerides | ||||||||||||||||
|---|---|---|---|---|---|---|---|---|---|---|---|---|---|---|---|---|---|---|---|---|
| 3-year interval‡ | 9-year interval | 3-year interval | 9-year interval | 3-year interval | 9-year interval | 3-year interval | 9-year interval | 3-year interval | 9-year interval | |||||||||||
| History of weight loss vs. maintaining normal weight | ||||||||||||||||||||
| General exclusions | ||||||||||||||||||||
| Missing weight at baseline or follow-up | 9,178 | 4,148 | 9,178 | 4,148 | 9,178 | 4,148 | 9,178 | 4,148 | 9,178 | 4,148 | ||||||||||
| Other weight-change patterns§ | 31,699 | 10,165 | 31,699 | 10,165 | 31,699 | 10,165 | 31,699 | 10,165 | 31,699 | 10,165 | ||||||||||
| Outcome specific | ||||||||||||||||||||
| Fasting time <8 hours | 264 | 68 | 264 | 68 | 264 | 68 | ||||||||||||||
| Diabetes at baseline¶ | 219 | 45 | ||||||||||||||||||
| Cholesterol-lowering medications# | 325 | 24 | 316 | 22 | 325 | 24 | 316 | 22 | ||||||||||||
| Missing outcome | 28 | 15 | 52 | 22 | 130 | 45 | 71 | 22 | 147 | 35 | ||||||||||
| Final no. of observations | 5,679 | 1,248 | 5,813 | 1,330 | 5,480 | 1,241 | 5,794 | 1,330 | 5,463 | 1,251 | ||||||||||
| History of weight gain vs. maintaining preobese weight | ||||||||||||||||||||
| General exclusions | ||||||||||||||||||||
| Missing weight at baseline or follow-up | 9,178 | 4,148 | 9,178 | 4,148 | 9,178 | 4,148 | 9,178 | 4,148 | 9,178 | 4,148 | ||||||||||
| Other weight-change patterns** | 29,467 | 9,182 | 29,467 | 9,182 | 29,467 | 9,182 | 29,467 | 9,182 | 29,467 | 9,182 | ||||||||||
| Outcome specific | ||||||||||||||||||||
| Fasting time <8 hours | 399 | 119 | 399 | 119 | 399 | 119 | ||||||||||||||
| Diabetes at baseline¶ | 480 | 76 | ||||||||||||||||||
| Cholesterol-lowering medications# | 511 | 57 | 497 | 53 | 511 | 57 | 497 | 53 | ||||||||||||
| Missing outcome | 47 | 20 | 83 | 38 | 242 | 79 | 94 | 38 | 202 | 67 | ||||||||||
| Final no. of observations | 7,496 | 2,144 | 7,828 | 2,264 | 7,284 | 2,108 | 7,817 | 2,264 | 7,324 | 2,120 | ||||||||||
Exclusions were applied sequentially in the order listed.
LDL, low density lipoprotein; HDL, high density lipoprotein.
For 3-year analyses, each participant could contribute as many as three observations.
Participants who did not meet one of the following criteria: 1) were normal weight (body mass index: 18.5–24.9 kg/m2) at baseline and follow-up and maintained (±3.0%) their body weight; or 2) lost ≥3.0% of their body weight over the interval and weight status changed from preobese (body mass index: 25.0–29.9 kg/m2) or obese (body mass index: ≥30.0 kg/m2) to normal weight.
Diabetes was defined as 1) self-report of physician-diagnosed diabetes; 2) self-reported use of diabetes medication; 3) fasting glucose level ≥7.0 mmol/liter; 4) nonfasting glucose level ≥11.1 mmol/liter.
Cholesterol-lowering medications had Medi-Span Therapeutic Classification codes for vitamin B3, antihyperlipidemic, and bile sequestrants or American Hospital Formulary Service Classification Compilation codes for antilipemic agents.
Participants who did not meet one of the following criteria: 1) were preobese at baseline and follow-up and maintained their body weight; or 2) gained ≥3.0% of their body weight over the interval and weight status changed from normal weight to preobese.
Statistical analysis
All four ethnic-gender groups were combined for the analyses since we did not find any significant interactions between gender or ethnicity and weight history groups. Repeated-measures regression (PROC MIXED procedure with compound symmetry in SAS software, version 9.1; SAS Institute, Inc., Cary, North Carolina) was used to construct longitudinal models of 3-year weight history (losing, maintaining, or gaining) (20). Fully adjusted models included covariates for ethnicity, gender, field center, education, age, smoking status, alcohol beverage consumption, follow-up BMI, and follow-up time. Models used to study glucose were adjusted for diabetes medications at follow-up, and models used to examine lipids were adjusted for lipid-lowering medications at follow-up.
The LSMEANS option was used with the PROC MIXED procedure (SAS Institute, Inc.) to estimate the adjusted mean 3-year or 9-year change in outcomes for each weight history group and to determine whether there were significant differences in the magnitude and direction of the changes between groups. In addition, mixed models were also used to estimate the mean risk factor levels at follow-up. The mean changes were determined based on the population prevalence or mean for each covariate except follow-up BMI, which was set at 24.0 kg/m2 when we analyzed history of weight loss versus maintaining normal weight and at 26.0 kg/m2 when we analyzed history of weight gain versus maintaining preobese weight. To increase the distinction between the weight maintenance group and other weight change groups, we have chosen not to show results for participants in the 3.1–4.9 percent weight gain or loss groups.
RESULTS
Demographics
The frequency distributions and the mean values of the demographic characteristics are shown in table 2 for adults in the analysis data sets created to study history of weight loss versus maintaining normal weight. For the 3-year analysis, each participant contributed up to three observations; therefore, the total number of observations was larger than the number of participants. Normal-weight maintainers were more likely to be White and female than were weight losers. Mean ages were similar across groups, but weight losers tended to have less education, be more likely to smoke cigarettes, and be less likely to consume alcoholic beverages.
3-year interval | 9-year interval | |||||
|---|---|---|---|---|---|---|
| Normal-weight maintainers (±3.0%) (n = 5,164) | Weight losers (≥5.0%) (n = 775) | Normal-weight maintainers (±3.0%) (n = 1,029) | Weight losers (≥5.0%) (n = 286) | |||
| Ethnicity (% White) | 87.6 | 78.2 | 87.8 | 74.1 | ||
| Gender (% female) | 58.9 | 56.3 | 57.1 | 46.2 | ||
| Age in years (mean (SD‡))§ | 59.9 (6.3) | 60.5 (6.4) | 63.6 (5.5) | 65.2 (5.7) | ||
| Education (% less than high school) | 14.2 | 21.5 | 13.4 | 26.8 | ||
| Cigarette smoking status (% current)§ | 23.0 | 29.7 | 19.9 | 31.1 | ||
| Alcoholic beverage consumers (% current)§ | 61.6 | 48.2 | 55.6 | 44.0 | ||
Preobese (body mass index: 25.0–29.9 kg/m2) or obese (body mass index: ≥30.0 kg/m2) at baseline and lost ≥5.0% of their body weight to become normal weight (body mass index: 18.5–24.9 kg/m2) at follow-up.
Normal weight at baseline and follow-up and weight change was ±3.0%.
SD, standard deviation.
Measured at follow-up.
3-year interval | 9-year interval | |||||
|---|---|---|---|---|---|---|
| Normal-weight maintainers (±3.0%) (n = 5,164) | Weight losers (≥5.0%) (n = 775) | Normal-weight maintainers (±3.0%) (n = 1,029) | Weight losers (≥5.0%) (n = 286) | |||
| Ethnicity (% White) | 87.6 | 78.2 | 87.8 | 74.1 | ||
| Gender (% female) | 58.9 | 56.3 | 57.1 | 46.2 | ||
| Age in years (mean (SD‡))§ | 59.9 (6.3) | 60.5 (6.4) | 63.6 (5.5) | 65.2 (5.7) | ||
| Education (% less than high school) | 14.2 | 21.5 | 13.4 | 26.8 | ||
| Cigarette smoking status (% current)§ | 23.0 | 29.7 | 19.9 | 31.1 | ||
| Alcoholic beverage consumers (% current)§ | 61.6 | 48.2 | 55.6 | 44.0 | ||
Preobese (body mass index: 25.0–29.9 kg/m2) or obese (body mass index: ≥30.0 kg/m2) at baseline and lost ≥5.0% of their body weight to become normal weight (body mass index: 18.5–24.9 kg/m2) at follow-up.
Normal weight at baseline and follow-up and weight change was ±3.0%.
SD, standard deviation.
Measured at follow-up.
The frequency distribution and means for adults in the history of weight gain versus maintaining preobese weight analysis data sets are shown in table 3. The ethnic distribution and mean age at follow-up were relatively consistent across the weight history categories for both intervals examined. A larger percentage of weight gainers compared with preobese weight maintainers were women. There were some variations in the distribution of low educational level, current smoking status, and current alcohol beverage consumption between the weight maintainers and gainers, but no consistent patterns were detected.
3-year interval | 9-year interval | |||||
|---|---|---|---|---|---|---|
| Preobese weight maintainers (±3.0%) (n = 6,721) | Weight gainers (≥5.0%) (n = 1,296) | Preobese weight maintainers (±3.0%) (n = 1,316) | Weight gainers (≥5.0%) (n = 946) | |||
| Ethnicity (% White) | 79.7 | 83.1 | 79.5 | 83.0 | ||
| Gender (% female) | 39.8 | 67.3 | 37.4 | 69.0 | ||
| Age in years (mean (SD‡))§ | 60.3 (6.2) | 58.6 (6.0) | 63.7 (5.6) | 61.7 (5.6) | ||
| Education (% less than high school) | 19.3 | 17.0 | 19.4 | 13.4 | ||
| Cigarette smoking status (% current)§ | 17.6 | 18.8 | 13.7 | 13.4 | ||
| Alcoholic beverage consumers (% current)§ | 56.9 | 56.7 | 53.6 | 55.9 | ||
Normal weight (body mass index: 18.5–24.9 kg/m2) at baseline and gained ≥5.0% of their body weight to become preobese (body mass index: 25.0–29.9 kg/m2) at follow-up.
Preobese at baseline and follow-up and 3-year weight change was ±3.0%.
SD, standard deviation.
Measured at follow-up.
3-year interval | 9-year interval | |||||
|---|---|---|---|---|---|---|
| Preobese weight maintainers (±3.0%) (n = 6,721) | Weight gainers (≥5.0%) (n = 1,296) | Preobese weight maintainers (±3.0%) (n = 1,316) | Weight gainers (≥5.0%) (n = 946) | |||
| Ethnicity (% White) | 79.7 | 83.1 | 79.5 | 83.0 | ||
| Gender (% female) | 39.8 | 67.3 | 37.4 | 69.0 | ||
| Age in years (mean (SD‡))§ | 60.3 (6.2) | 58.6 (6.0) | 63.7 (5.6) | 61.7 (5.6) | ||
| Education (% less than high school) | 19.3 | 17.0 | 19.4 | 13.4 | ||
| Cigarette smoking status (% current)§ | 17.6 | 18.8 | 13.7 | 13.4 | ||
| Alcoholic beverage consumers (% current)§ | 56.9 | 56.7 | 53.6 | 55.9 | ||
Normal weight (body mass index: 18.5–24.9 kg/m2) at baseline and gained ≥5.0% of their body weight to become preobese (body mass index: 25.0–29.9 kg/m2) at follow-up.
Preobese at baseline and follow-up and 3-year weight change was ±3.0%.
SD, standard deviation.
Measured at follow-up.
History of weight loss versus maintaining normal weight over 3-year and 9-year intervals
Table 4 shows mean BMI, glucose, and lipid levels at baseline and change in the levels in adults with a history of weight maintenance or weight loss. By design, weight losers had higher mean BMI levels at baseline and a larger 3-year and 9-year change in BMI than normal-weight maintainers. Given the patterns in BMI at baseline, it is not surprising that weight losers had significantly less favorable baseline glucose and lipid levels when compared with weight maintainers. In general, weight loss was associated with improvements in the lipid levels; however, 9-year-only changes in glucose were not statistically different from those for normal-weight maintainers.
Risk factor | 3-year interval | 9-year interval | ||||||||||||
|---|---|---|---|---|---|---|---|---|---|---|---|---|---|---|
| Normal-weight maintainers (±3.0%) | Weight losers (≥5.0%) | Normal-weight maintainers (±3.0%) | Weight losers (≥5.0%) | |||||||||||
| Mean | 95% CI§ | Mean | 95% CI | Mean | 95% CI | Mean | 95% CI | |||||||
| Body mass index (kg/m2) | ||||||||||||||
| Baseline¶ | 22.99 | 22.90, 23.09 | 25.92 | 25.80, 26.03* | 22.85 | 22.67, 23.00 | 26.62 | 26.42, 26.82* | ||||||
| Change¶ | 0.02 | −0.01, 0.05 | −2.82 | −2.88, −2.77* | 0.02 | −0.06, 0.10 | −2.97 | −3.07, −2.86* | ||||||
| Glucose (mmol/liter) | ||||||||||||||
| Baseline¶ | 5.42 | 5.38, 5.45 | 5.60 | 5.56, 5.66* | 5.34 | 5.28, 5.40 | 5.62 | 5.54, 5.70* | ||||||
| Change# | 0.01 | −0.02, 0.05 | −0.05 | −0.11, 0.01* | 0.04 | −0.03, 0.11 | 0.09 | −0.03, 0.20 | ||||||
| Total cholesterol (mmol/liter) | ||||||||||||||
| Baseline¶ | 5.36 | 5.30, 5.42 | 5.64 | 5.56, 5.72* | 5.54 | 5.43, 5.65 | 5.78 | 5.64, 5.93* | ||||||
| Change# | −0.12 | −0.16, −0.08 | −0.51 | −0.57, −0.44* | −0.37 | −0.44, −0.31 | −0.73 | −0.83, −0.64* | ||||||
| LDL§ cholesterol (mmol/liter) | ||||||||||||||
| Baseline¶ | 3.36 | 3.30, 3.43 | 3.64 | 3.55, 3.72* | 3.56 | 3.46, 3.67 | 3.81 | 3.67, 3.95* | ||||||
| Change# | −0.13 | −0.17, −0.09 | −0.45 | −0.51, −0.38* | −0.39 | −0.45, −0.33 | −0.70 | −0.79, −0.61* | ||||||
| HDL§ cholesterol (mmol/liter) | ||||||||||||||
| Baseline¶ | 1.48 | 1.46, 1.51 | 1.35 | 1.31, 1.39* | 1.48 | 1.43, 1.52 | 1.35 | 1.29, 1.41* | ||||||
| Change# | −0.02 | −0.03, 0.00 | 0.07 | 0.05, 0.10* | −0.03 | −0.05, −0.01 | 0.06 | 0.02, 0.10* | ||||||
| Triglycerides (mmol/liter) | ||||||||||||||
| Baseline¶ | 1.17 | 1.12, 1.23 | 1.51 | 1.44, 1.58* | 1.18 | 1.09, 1.26 | 1.49 | 1.27, 1.48* | ||||||
| Change# | 0.06 | 0.02, 0.09 | −0.30 | −0.36, −0.25* | 0.10 | 0.06, 0.15 | −0.20 | −0.09, 0.08* | ||||||
Significantly different (p < 0.05) from that for the weight maintainers.
Preobese (body mass index: 25.0–29.9 kg/m2) or obese (body mass index: ≥30.0 kg/m2) at baseline and lost ≥5.0% of their body weight to become normal weight (body mass index: 18.5–24.9 kg/m2) at follow-up.
Normal weight at baseline and follow-up and weight change was ±3.0%.
CI, confidence interval; LDL, low density lipoprotein; HDL, high density lipoprotein.
Adjusted for ethnicity, gender, age, and field center.
Adjusted for ethnicity, gender, education, and field center; age, body mass index (24.0 kg/m2), smoking status, and alcohol beverage consumption status at follow-up; and follow-up time. Glucose models were also adjusted for use of diabetes medications at follow-up. Lipid models were also adjusted for use of lipid-lowering medications at follow-up.
Risk factor | 3-year interval | 9-year interval | ||||||||||||
|---|---|---|---|---|---|---|---|---|---|---|---|---|---|---|
| Normal-weight maintainers (±3.0%) | Weight losers (≥5.0%) | Normal-weight maintainers (±3.0%) | Weight losers (≥5.0%) | |||||||||||
| Mean | 95% CI§ | Mean | 95% CI | Mean | 95% CI | Mean | 95% CI | |||||||
| Body mass index (kg/m2) | ||||||||||||||
| Baseline¶ | 22.99 | 22.90, 23.09 | 25.92 | 25.80, 26.03* | 22.85 | 22.67, 23.00 | 26.62 | 26.42, 26.82* | ||||||
| Change¶ | 0.02 | −0.01, 0.05 | −2.82 | −2.88, −2.77* | 0.02 | −0.06, 0.10 | −2.97 | −3.07, −2.86* | ||||||
| Glucose (mmol/liter) | ||||||||||||||
| Baseline¶ | 5.42 | 5.38, 5.45 | 5.60 | 5.56, 5.66* | 5.34 | 5.28, 5.40 | 5.62 | 5.54, 5.70* | ||||||
| Change# | 0.01 | −0.02, 0.05 | −0.05 | −0.11, 0.01* | 0.04 | −0.03, 0.11 | 0.09 | −0.03, 0.20 | ||||||
| Total cholesterol (mmol/liter) | ||||||||||||||
| Baseline¶ | 5.36 | 5.30, 5.42 | 5.64 | 5.56, 5.72* | 5.54 | 5.43, 5.65 | 5.78 | 5.64, 5.93* | ||||||
| Change# | −0.12 | −0.16, −0.08 | −0.51 | −0.57, −0.44* | −0.37 | −0.44, −0.31 | −0.73 | −0.83, −0.64* | ||||||
| LDL§ cholesterol (mmol/liter) | ||||||||||||||
| Baseline¶ | 3.36 | 3.30, 3.43 | 3.64 | 3.55, 3.72* | 3.56 | 3.46, 3.67 | 3.81 | 3.67, 3.95* | ||||||
| Change# | −0.13 | −0.17, −0.09 | −0.45 | −0.51, −0.38* | −0.39 | −0.45, −0.33 | −0.70 | −0.79, −0.61* | ||||||
| HDL§ cholesterol (mmol/liter) | ||||||||||||||
| Baseline¶ | 1.48 | 1.46, 1.51 | 1.35 | 1.31, 1.39* | 1.48 | 1.43, 1.52 | 1.35 | 1.29, 1.41* | ||||||
| Change# | −0.02 | −0.03, 0.00 | 0.07 | 0.05, 0.10* | −0.03 | −0.05, −0.01 | 0.06 | 0.02, 0.10* | ||||||
| Triglycerides (mmol/liter) | ||||||||||||||
| Baseline¶ | 1.17 | 1.12, 1.23 | 1.51 | 1.44, 1.58* | 1.18 | 1.09, 1.26 | 1.49 | 1.27, 1.48* | ||||||
| Change# | 0.06 | 0.02, 0.09 | −0.30 | −0.36, −0.25* | 0.10 | 0.06, 0.15 | −0.20 | −0.09, 0.08* | ||||||
Significantly different (p < 0.05) from that for the weight maintainers.
Preobese (body mass index: 25.0–29.9 kg/m2) or obese (body mass index: ≥30.0 kg/m2) at baseline and lost ≥5.0% of their body weight to become normal weight (body mass index: 18.5–24.9 kg/m2) at follow-up.
Normal weight at baseline and follow-up and weight change was ±3.0%.
CI, confidence interval; LDL, low density lipoprotein; HDL, high density lipoprotein.
Adjusted for ethnicity, gender, age, and field center.
Adjusted for ethnicity, gender, education, and field center; age, body mass index (24.0 kg/m2), smoking status, and alcohol beverage consumption status at follow-up; and follow-up time. Glucose models were also adjusted for use of diabetes medications at follow-up. Lipid models were also adjusted for use of lipid-lowering medications at follow-up.
Figure 1 contrasts the difference (weight loser minus normal-weight maintainer) in risk factor levels at follow-up. Differences greater than zero indicate that the risk factor level was higher in weight losers than normal-weight maintainers. We found that results varied depending on the outcome. Over the 3-year interval (part A), weight losers had significantly more favorable (lower) levels of total cholesterol (0.14 mmol/liter) and LDL cholesterol (0.14 mmol/liter) but similar levels of glucose, HDL cholesterol, and triglycerides at follow-up compared with weight maintainers. Over the 9-year interval (part B), total cholesterol (0.20 mmol/liter) and LDL cholesterol (0.20 mmol/liter) levels at follow-up remained significantly more favorable among weight losers compared with normal-weight maintainers. In contrast, glucose levels (0.28 mmol/liter) were significantly more favorable among normal-weight maintainers.
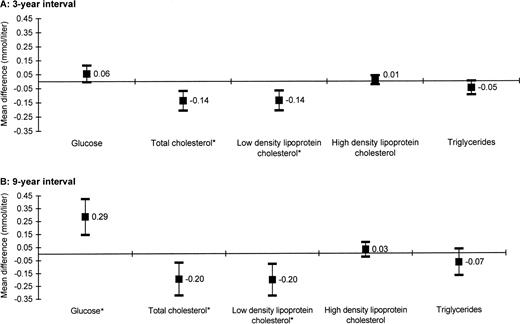
Mean differences (and 95% confidence intervals) in glucose and lipids at follow-up for adults with a history of weight loss compared with those maintaining normal weight over 3-year (part A) and 9-year (part B) intervals, Atherosclerosis Risk in Communities Study, 1987–1998. All models were adjusted for ethnicity, gender, education, and field center; age, body mass index (24.0 kg/m2), smoking status, and alcohol beverage consumption status at follow-up; and follow-up time. Glucose models were also adjusted for use of diabetes medications at follow-up. Lipid models were also adjusted for use of lipid-lowering medications at follow-up. *p < 0.05.
History of weight gain versus maintaining preobese weight over 3-year and 9-year intervals
The baseline and mean changes in BMI, glucose, and lipid levels in adults with a history of weight maintenance or weight gain are shown in table 5. By design, mean BMI at baseline was significantly lower in adults who gained weight compared with weight maintainers, and the weight gainers had a significantly larger change in BMI over the 3-year and 9-year intervals. Weight gainers had significantly less favorable glucose, total cholesterol, LDL cholesterol, HDL cholesterol, and triglyceride levels at baseline when compared with weight maintainers after we adjusted for ethnicity, gender, age, and field center. When examining change in the risk factors, we found significant differences in the magnitude and direction of the change in glucose (3-year interval only) and lipid levels between weight maintainers and weight gainers, with increasing risk associated with weight gain over both the 3-year and 9-year intervals.
Risk factor | 3-year interval | 9-year interval | ||||||||||||
|---|---|---|---|---|---|---|---|---|---|---|---|---|---|---|
| Preobese weight maintainers (±3.0%) | Weight gainers (≥5.0%) | Preobese weight maintainers (±3.0%) | Weight gainers (≥5.0%) | |||||||||||
| Mean | 95% CI§ | Mean | 95% CI | Mean | 95% CI | Mean | 95% CI | |||||||
| Body mass index (kg/m2) | ||||||||||||||
| Baseline¶ | 27.25 | 27.18, 27.31 | 24.38 | 24.30, 24.45* | 27.36 | 27.25, 27.47 | 23.74 | 23.62, 23.86* | ||||||
| Change¶ | 0.07 | 0.04, 0.09 | 2.42 | 2.38, 2.46* | 0.06 | −0.03, 0.14 | 2.96 | 2.87, 3.05* | ||||||
| Glucose (mmol/liter) | ||||||||||||||
| Baseline¶ | 5.61 | 5.58, 5.64 | 5.46 | 5.42, 5.51* | 5.56 | 5.51, 5.60 | 5.37 | 5.32, 5.43* | ||||||
| Change# | 0.05 | 0.01, 0.08 | 0.18 | 0.14, 0.23* | 0.14 | 0.07, 0.20 | 0.22 | 0.16, 0.29 | ||||||
| Total cholesterol (mmol/liter) | ||||||||||||||
| Baseline¶ | 5.54 | 5.48, 5.59 | 5.30 | 5.23, 5.37* | 5.65 | 5.56, 5.75 | 5.41 | 5.30, 5.51* | ||||||
| Change# | −0.17 | −0.20, −0.14 | 0.11 | 0.06, 0.16* | −0.49 | −0.55, −0.43 | −0.16 | −0.22, −0.10* | ||||||
| LDL§ cholesterol (mmol/liter) | ||||||||||||||
| Baseline¶ | 3.56 | 3.50, 3.61 | 3.35 | 3.28, 3.41* | 3.70 | 3.61, 3.79 | 3.48 | 3.38, 3.58* | ||||||
| Change# | −0.16 | −0.19, −0.13 | 0.06 | 0.02, 0.11* | −0.47 | −0.52, −0.41 | −0.20 | −0.25, −0.14* | ||||||
| HDL§ cholesterol (mmol/liter) | ||||||||||||||
| Baseline¶ | 1.33 | 1.31, 1.35 | 1.44 | 1.41, 1.46* | 1.31 | 1.27, 1.34 | 1.42 | 1.38, 1.46* | ||||||
| Change# | −0.02 | −0.03, −0.01 | −0.09 | −0.10, −0.07* | −0.02 | −0.04, 0.00 | −0.14 | −0.16, −0.12* | ||||||
| Triglycerides (mmol/liter) | ||||||||||||||
| Baseline¶ | 1.46 | 1.42, 1.50 | 1.17 | 1.12, 1.23* | 1.39 | 1.32, 1.46 | 1.09 | 1.02, 1.17* | ||||||
| Change# | 0.00 | −0.03, 0.02 | 0.26 | 0.22, 0.30* | 0.01 | −0.04, 0.06 | 0.40 | 0.35, 0.44* | ||||||
Significantly different (p < 0.05) from that for the weight maintainers.
Normal weight (body mass index: 18.5–24.9 kg/m2) at baseline and gained ≥5.0% of their body weight to become preobese (body mass index: 25.0–29.9 kg/m2) at follow-up.
Preobese at baseline and follow-up and 3-year weight change was ±3.0%.
CI, confidence interval; LDL, low density lipoprotein; HDL, high density lipoprotein.
Adjusted for ethnicity, gender, age, and field center.
Adjusted for ethnicity, gender, education, and field center; age, body mass index (26.0 kg/m2), smoking status, and alcohol beverage consumption status at follow-up; and follow-up time. Glucose models were also adjusted for use of diabetes medications at follow-up. Lipid models were also adjusted for use of lipid-lowering medications at follow-up.
Risk factor | 3-year interval | 9-year interval | ||||||||||||
|---|---|---|---|---|---|---|---|---|---|---|---|---|---|---|
| Preobese weight maintainers (±3.0%) | Weight gainers (≥5.0%) | Preobese weight maintainers (±3.0%) | Weight gainers (≥5.0%) | |||||||||||
| Mean | 95% CI§ | Mean | 95% CI | Mean | 95% CI | Mean | 95% CI | |||||||
| Body mass index (kg/m2) | ||||||||||||||
| Baseline¶ | 27.25 | 27.18, 27.31 | 24.38 | 24.30, 24.45* | 27.36 | 27.25, 27.47 | 23.74 | 23.62, 23.86* | ||||||
| Change¶ | 0.07 | 0.04, 0.09 | 2.42 | 2.38, 2.46* | 0.06 | −0.03, 0.14 | 2.96 | 2.87, 3.05* | ||||||
| Glucose (mmol/liter) | ||||||||||||||
| Baseline¶ | 5.61 | 5.58, 5.64 | 5.46 | 5.42, 5.51* | 5.56 | 5.51, 5.60 | 5.37 | 5.32, 5.43* | ||||||
| Change# | 0.05 | 0.01, 0.08 | 0.18 | 0.14, 0.23* | 0.14 | 0.07, 0.20 | 0.22 | 0.16, 0.29 | ||||||
| Total cholesterol (mmol/liter) | ||||||||||||||
| Baseline¶ | 5.54 | 5.48, 5.59 | 5.30 | 5.23, 5.37* | 5.65 | 5.56, 5.75 | 5.41 | 5.30, 5.51* | ||||||
| Change# | −0.17 | −0.20, −0.14 | 0.11 | 0.06, 0.16* | −0.49 | −0.55, −0.43 | −0.16 | −0.22, −0.10* | ||||||
| LDL§ cholesterol (mmol/liter) | ||||||||||||||
| Baseline¶ | 3.56 | 3.50, 3.61 | 3.35 | 3.28, 3.41* | 3.70 | 3.61, 3.79 | 3.48 | 3.38, 3.58* | ||||||
| Change# | −0.16 | −0.19, −0.13 | 0.06 | 0.02, 0.11* | −0.47 | −0.52, −0.41 | −0.20 | −0.25, −0.14* | ||||||
| HDL§ cholesterol (mmol/liter) | ||||||||||||||
| Baseline¶ | 1.33 | 1.31, 1.35 | 1.44 | 1.41, 1.46* | 1.31 | 1.27, 1.34 | 1.42 | 1.38, 1.46* | ||||||
| Change# | −0.02 | −0.03, −0.01 | −0.09 | −0.10, −0.07* | −0.02 | −0.04, 0.00 | −0.14 | −0.16, −0.12* | ||||||
| Triglycerides (mmol/liter) | ||||||||||||||
| Baseline¶ | 1.46 | 1.42, 1.50 | 1.17 | 1.12, 1.23* | 1.39 | 1.32, 1.46 | 1.09 | 1.02, 1.17* | ||||||
| Change# | 0.00 | −0.03, 0.02 | 0.26 | 0.22, 0.30* | 0.01 | −0.04, 0.06 | 0.40 | 0.35, 0.44* | ||||||
Significantly different (p < 0.05) from that for the weight maintainers.
Normal weight (body mass index: 18.5–24.9 kg/m2) at baseline and gained ≥5.0% of their body weight to become preobese (body mass index: 25.0–29.9 kg/m2) at follow-up.
Preobese at baseline and follow-up and 3-year weight change was ±3.0%.
CI, confidence interval; LDL, low density lipoprotein; HDL, high density lipoprotein.
Adjusted for ethnicity, gender, age, and field center.
Adjusted for ethnicity, gender, education, and field center; age, body mass index (26.0 kg/m2), smoking status, and alcohol beverage consumption status at follow-up; and follow-up time. Glucose models were also adjusted for use of diabetes medications at follow-up. Lipid models were also adjusted for use of lipid-lowering medications at follow-up.
The mean differences (weight gainers minus preobese weight maintainers) after adjusting for covariates and setting BMI at 26.0 kg/m2 are shown in figure 2. Differences greater than zero indicate that the risk factor level was higher in weight gainers than preobese weight maintainers. In general, over both intervals, normal-weight adults who gained weight to become preobese had similar glucose and lipid levels at follow-up compared with preobese weight maintainers, with significantly more adverse levels for HDL cholesterol (0.04 mmol/liter) and triglycerides (0.11 mmol/liter) over the 9-year interval.
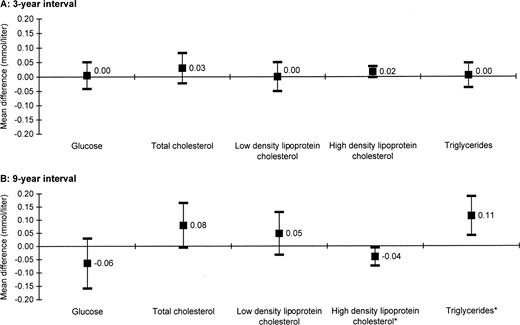
Mean differences (and 95% confidence intervals) in glucose and lipids at follow-up for adults with a history of weight gain compared with those maintaining preobese weight over 3-year (part A) and 9-year (part B) intervals, Atherosclerosis Risk in Communities Study, 1987–1998. All models were adjusted for ethnicity, gender, education, and field center; age, body mass index (24.0 kg/m2), smoking status, and alcohol beverage consumption status at follow-up; and follow-up time. Glucose models were also adjusted for use of diabetes medications at follow-up. Lipid models were also adjusted for use of lipid-lowering medications at follow-up. *p < 0.05.
DISCUSSION
The results from this study showed that overweight adults who lost weight over a 3-year or 9-year interval to become normal weight had more favorable (lower) total cholesterol and LDL cholesterol levels and similar HDL cholesterol and triglyceride levels compared with normal-weight adults who had a history of weight maintenance. Overweight adults who lost weight to become normal weight had similar glucose levels over the 3-year interval but had less favorable glucose levels over the 9-year interval compared with normal-weight maintainers.
There is strong evidence that weight loss in preobese and obese adults reduces metabolic risk factors for diabetes and cardiovascular disease. The Diabetes Prevention Program found that a lifestyle intervention that achieved a 5–7 percent weight loss reduced diabetes incidence by 58 percent over 3 years of follow-up (21). Other intervention studies have also shown that weight loss reduced the incidence of diabetes (22–24); however, associations between weight change and glucose levels in population-based studies have been mixed, with studies showing weight loss to be associated with reduced (11, 25), increased (26, 27), or no (23) effect on the risk of elevated glucose levels. In the current study, we did not find that beneficial changes in glucose levels were associated with weight loss among subjects who were not diabetic at baseline.
Several studies have shown that weight loss by lifestyle modification is associated with reductions in total cholesterol (0–18 percent), LDL cholesterol (3–22 percent), and triglycerides (2–44 percent) (4). Consistent with other research, we observed reductions in total cholesterol, LDL cholesterol, and triglycerides with weight loss. The literature on the effect of weight loss (via lifestyle modification) on HDL cholesterol is inconclusive, with one review estimating changes of −7 to 27 percent (4). Here, we found weight loss to be associated with a significant increase in HDL cholesterol levels over the 3-year and 9-year intervals.
The emphasis of the current work was not on the effects of weight loss but on the effects of weight history independent of current weight. It was interesting that adults with a history of weight loss over the 3-year and 9-year intervals, compared with “BMI-matched” weight maintainers, had lower levels of total cholesterol and LDL cholesterol. One hypothesis to explain this finding is that the lower levels were due to negative calorie balance at the time of the clinic visit. All participants were fasting when blood was drawn, but weight losers could have been more likely than weight maintainers to be in negative calorie balance for a period of days or weeks before the measures were obtained, which may have improved their lipid levels. Several studies have shown that total cholesterol, LDL cholesterol, and triglycerides decreased significantly during energy restriction (28–32). Weinsier et al. (33) attempted to separate the effects of energy restriction from those of weight loss. In their study of postmenopausal obese women, they found that energy restriction tended to have a greater effect on triglycerides than weight loss did; however, weight loss tended to have a greater effect on LDL cholesterol than energy restriction did. Furthermore, their findings suggested that weight loss and energy restriction had independent effects on total and LDL cholesterol. In contrast, HDL cholesterol improved with energy restriction only. Thus, energy deficit could be hypothesized as a mechanism for the reductions that we observed in lipids. It is important to note that although they were not statistically significant, patterns were similar (more favorable levels among weight losers) for HDL cholesterol and triglycerides over the 3-year and 9-year intervals.
Just as we do not know the immediate history of energy balance for the adults studied here, we also do not know the pattern of weight change between clinic visits. Prior to the follow-up visit, participants could have been in a phase of weight loss, weight maintenance, or weight regain. The majority of published weight loss studies are interventions of relatively short duration (often less than 1 year). Longer studies (more than 2 years) have noted that the improvements in total and LDL cholesterol after short-term weight loss were not sustained during a weight loss maintenance phase (33, 34). However, improvements in triglyceride levels were sustained during the weight maintenance phase. Changes in the lipid levels in adults in the current study did not follow this pattern, and, indeed, we do not know how many of the weight losers in our study experienced weight loss followed by weight maintenance.
As with weight loss, the health consequences of excessive weight gain are well documented. We observed the expected unfavorable changes in risk factors with weight gain. These changes effectively cancelled out the majority of the difference between the groups that had existed 3 or 9 years before (likely associated with the differences in baseline weights). Preobese weight maintainers, compared with weight gainers, had significantly less favorable HDL cholesterol and triglyceride levels over the 9-year interval. Although not statistically significant, similar patterns were seen for total cholesterol and LDL cholesterol. This finding suggests that, at least in the context of our 3-year and 9-year studies, it was not duration of time that an adult was preobese that was important, but his or her weight when the measurement was taken. However, Wannamethee and Shaper (25) found that the risk of developing diabetes was greater among men who were preobese for more than 5 years than among men with less than a 5-year history of being overweight. These differing results may be explained by the use of different reference groups (normal-weight maintainers (25) vs. preobese maintainers).
Several investigators have examined the effects of repeatedly losing and gaining weight (weight cycling) on the risk of developing chronic disease and mortality. The results of these studies have been mixed, and a consensus report found no evidence to support the hypothesis that weight cycling had an adverse effect on risk factors, morbidity, or mortality (35). Although we measured weight change by using only two time points, this study bears some resemblance to studies of weight cycling in that we were attempting to examine the effects of weight change independent of the effects of current weight. It is possible that some of the inconsistency in the literature on weight cycling (35) may have been caused by lack of attention to the direction of the last weight change before the outcomes were evaluated. In the Iowa Women's Health Study, French et al. (36) found that women whose weight fluctuation patterns included weight gain (weight loss regain or continuous weight gain) were at increased odds of developing diabetes and hypertension regardless of their weight status at age 18 years when compared with weight-stable women whose weight was normal at age 18 years. Weight-stable women with a BMI of ≥27.3 kg/m2 at age 18 years were also at increased risk; however, these results were not standardized to a common follow-up weight, as was done in our analysis. In a weight-cycling study (30 months), Wing et al. (14) found that participants with large weight cycles had improvements in lipid levels during the weight-loss phase. However, during the regain phase, their lipid levels did not exceed the levels for the weight-stable adults. On the basis of these findings, the authors hypothesized that “weight loss followed by regaining could actually be more beneficial to overweight persons than remaining obese” (14, p. 1421).
We were interested in assessing the difference between participants with the same follow-up weight status but different weight histories. Without this restriction, the mean follow-up BMI could vary significantly between the two weight history groups. For example, if the weight maintainers tended to be normal weight at follow-up but the weight losers were predominately overweight at follow-up, then the differences between the two groups could potentially be the result of residual confounding that was not adequately controlled by the use of follow-up BMI as a covariate in the model. However, by creating predefined weight history categories with the same follow-up weight status category, we reduced the possibility that the differences found between the two groups were due to their follow-up BMI instead of their previous weight history. In addition, we believe that the two groups as analyzed convey useful messages with regard to losing weight to become normal weight (a public health goal) and gaining weight such that one is no longer normal weight (a circumstance to be avoided).
Often, studies of weight change are conducted among volunteers actively seeking a weight loss program. In such studies, it is possible to assign adults randomly to exposure groups and thereby greatly enhance the ability to control for confounding. While it is a simple matter to randomly assign adults to receive some type of weight loss intervention, it is very difficult for adults to actually lose weight and maintain it over a period of time as long as 3 years. A weakness of observational studies, such as that reported here, is no random assignment to weight loss or gain groups. Nevertheless, this design did provide a feasible mechanism for observing relatively long-term effects of weight change history. In addition, in contrast to most randomized weight loss trials, the sample studied here was community based and thus more representative of free-living populations than samples studied in most clinical trials.
A potential limitation of this study is the lack of information on intentionality of weight changes. Analysis of the 1989 National Health Interview Survey determined that, among adults who lost weight, 60 percent reported that the weight loss was intentional (37). Unintentional weight loss has been associated with poorer health status and smoking (37, 38). In an effort to eliminate weight changes that could be the result of illness, we repeated the analysis (data not shown) after excluding all weight change greater than 20 percent. We found similar results; however, it is still possible that some of the weight change could be due to illness, which could impact the study findings depending on the underlying cause of the weight loss.
Other potential factors that could alter or explain the study findings are changes in diet, physical activity, and smoking status. Because of the design of the Atherosclerosis Risk in Communities Study, we were unable to examine changes in diet or physical activity over all 3-year intervals or the 9-year interval because those variables were not assessed at every examination of the cohort. However, subsequent 3-year analysis controlling for diet and/or physical activity at follow-up produced similar results (data not shown). Very few of the participants changed their smoking status over the interval. Therefore, we think it unlikely that changes in diet, physical activity, or smoking status modified the results found in this study.
Many experts in the treatment of obesity advocate a relatively modest weight loss (5–10 percent) in obese patients (4–7, 39, 40). The recommendation appears to stem from the recognition that more weight loss will be difficult to attain (41) and the evidence that health benefits can be obtained from rather modest weight loss (4–7, 39, 40, 42, 43). The benefits claimed to accompany modest weight loss could lead one to hypothesize that there are no residual effects of having a history of higher weight. The current study suggests that preobese and obese adults who lose weight to become normal weight are not predisposed to less favorable total cholesterol, LDL cholesterol, HDL cholesterol, and triglyceride levels than normal-weight maintainers but are predisposed to less favorable glucose levels. Furthermore, preobese adults with a history of being normal weight may have less favorable HDL cholesterol and triglyceride levels, but their weight history appears not to impact glucose, total cholesterol, or LDL cholesterol levels. These findings suggest that, in addition to current weight, weight history may impact glucose and lipid levels.
This work was supported by grants from the National Institute of Diabetes and Digestive and Kidney Diseases (F32-DK61831-02) and the National Heart, Lung, and Blood Institute (R21-HL075314-01).
The authors thank the staff of the Atherosclerosis Risk in Communities Study for their important contributions.
References
Centers for Disease Control and Prevention. The burden of chronic diseases and their risk factors: national and state perspectives
US Department of Health and Human Services. The Surgeon General's call to action to prevent and decrease overweight and obesity. Rockville, MD: US Department of Health and Human Services,
US Department of Health and Human Services. The health benefits of smoking cessation: a report of the US Surgeon General. Washington, DC: US Department of Health and Human Services, Public Health Service, Centers for Disease Control, Center for Chronic Disease Prevention and Health Promotion, Office on Smoking and Health,
Clinical Guidelines on the Identification, Evaluation, and Treatment of Overweight and Obesity in Adults—The Evidence Report. National Institutes of Health.
Blackburn G. Effect of degree of weight loss on health benefits.
Pi-Sunyer FX. Short-term medical benefits and adverse effects of weight loss.
Chan JM, Rimm EB, Colditz GA, et al. Obesity, fat distribution, and weight gain as risk factors for clinical diabetes in men.
Field AE, Manson JE, Laird N, et al. Weight cycling and the risk of developing type 2 diabetes among adult women in the United States.
Ford ES, Williamson DF, Liu S. Weight change and diabetes incidence: findings from a national cohort of US adults.
Colditz GA, Willett WC, Rotnitzky A, et al. Weight gain as a risk factor for clinical diabetes mellitus in women.
Ishikawa-Takata K, Ohta T, Moritaki K, et al. Obesity, weight change and risks for hypertension, diabetes and hypercholesterolemia in Japanese men.
Berns MA, de Vries JH, Katan MB. Increase in body fatness as a major determinant of changes in serum total cholesterol and high density lipoprotein cholesterol in young men over a 10-year period.
Wing RR, Jeffery RW, Hellerstedt WL. A prospective study of effects of weight cycling on cardiovascular risk factors.
The ARIC Investigators. The Atherosclerosis Risk in Communities (ARIC) Study: design and objectives.
Siedel J, Hagele EO, Ziegenhorn J, et al. Reagent for the enzymatic determination of serum total cholesterol with improved lipolytic efficiency.
Nagele U, Hagele E, Sauer G, et al. Reagent for the improved lipolytic efficiency.
Warnick GR, Benderson J, Albers JJ. Dextran sulfate-Mg2+ precipitation procedure for quantification of high-density-lipoprotein cholesterol.
Friedewald WT, Levy RI, Fredrickson DS. Estimation of the concentration of low density lipoprotein cholesterol in plasma, without use of the preparative ultracentrifuge.
Little RC, Milliken GA, Stroup WW, et al. SAS system for mixed models. Cary, NC: SAS Institute, Inc,
Knowler WC, Barrett-Connor E, Fowler SE, et al. Reduction in the incidence of type 2 diabetes with lifestyle intervention or metformin.
Long SD, O'Brien K, MacDonald KG Jr, et al. Weight loss in severely obese subjects prevents the progression of impaired glucose tolerance to type II diabetes. A longitudinal interventional study.
Eriksson KF, Lindgarde F. Prevention of type 2 (non-insulin-dependent) diabetes mellitus by diet and physical exercise. The 6-year Malmo feasibility study.
Wing RR, Venditti E, Jakicic JM, et al. Lifestyle intervention in overweight individuals with a family history of diabetes.
Wannamethee SG, Shaper AG. Weight change and duration of overweight and obesity in the incidence of type 2 diabetes.
Noppa H. Body weight change in relation to incidence of ischemic heart disease and change in risk factors for ischemic heart disease.
Higgins M, D'Agostino R, Kannel W, et al. Benefits and adverse effects of weight loss: observations from the Framingham Study.
Brownell KD, Stunkard AJ. Differential changes in plasma high-density-lipoprotein-cholesterol levels in obese men and women during weight reduction.
Weisweiler P. Plasma lipoproteins and lipase and lecithin:cholesterol acyltransferase activities in obese subjects before and after weight reduction.
Nieman DC, Haig JL, Fairchild KS, et al. Reducing-diet and exercise-training effects on serum lipids and lipoproteins in mildly obese women.
Weinsier RL, Johnston MH, Doleys DM, et al. Dietary management of obesity: evaluation of the time-energy displacement diet in terms of its efficacy and nutritional adequacy for long-term weight control.
Zimmerman J, Kaufmann NA, Fainaru M, et al. Effects of weight loss in moderate obesity on plasma lipoprotein and apolipoprotein levels and on high density lipoprotein composition.
Weinsier RL, James LD, Darnell BE, et al. Lipid and insulin concentrations in obese postmenopausal women: separate effects of energy restriction and weight loss.
Wadden TA, Anderson DA, Foster GD. Two-year changes in lipids and lipoproteins associated with the maintenance of a 5% to 10% reduction in initial weight: some findings and some questions.
Weight cycling. National Task Force on the Prevention and Treatment of Obesity.
French SA, Jeffery RW, Folsom AR, et al. Weight loss maintenance in young adulthood: prevalence and correlations with health behavior and disease in a population-based sample of women aged 55–69 years.
Meltzer AA, Everhart JE. Unintentional weight loss in the United States.
French SA, Jeffery RW, Folsom AR, et al. Relation of weight variability and intentionality of weight loss to disease history and health-related variables in a population-based sample of women aged 55–69 years.
de Leiva A. What are the benefits of moderate weight loss?
Mertens IL, Van Gaal LF. Overweight, obesity, and blood pressure: the effects of modest weight reduction.

