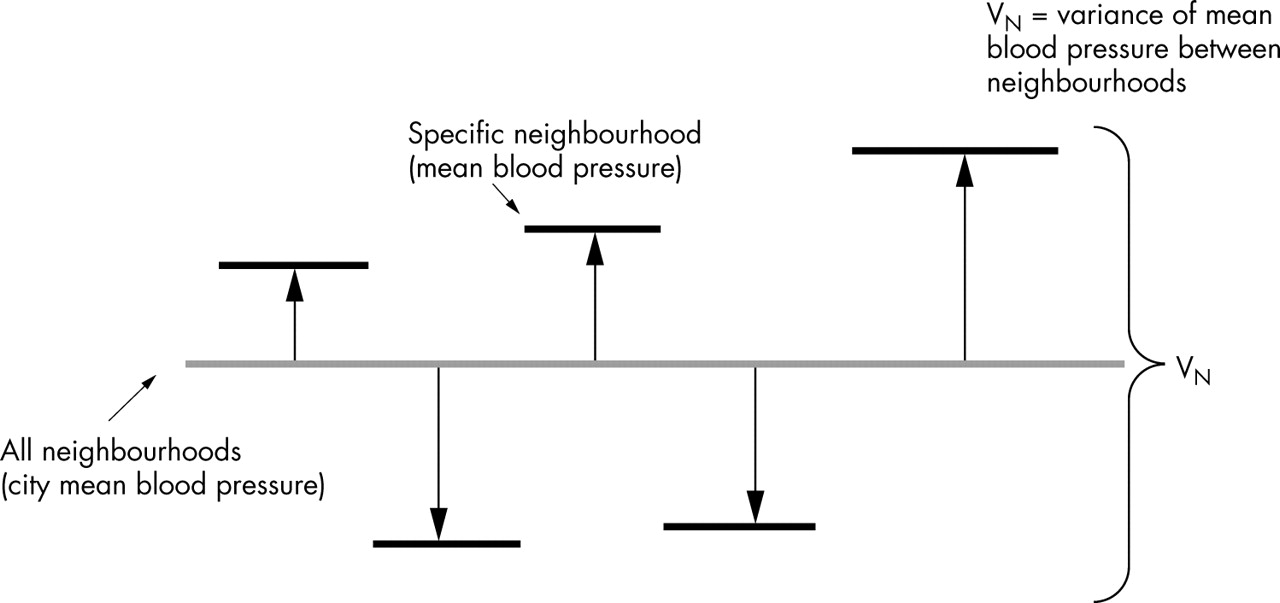
Figure 4
Single level ecological information. In this figure all individual SBP values are aggregated at the neighbourhood level to obtain the neighbourhood mean. We can distinguish differences between the mean blood pressure of each neighbourhood and the mean blood pressure of the whole city (the neighbourhood residuals). These residuals are represented by thick black horizontal lines at the top of a pillow. The neighbourhood variance is a summary of the differences between neighbourhoods. We are unable to observe differences between people (variation in blood pressure within neighbourhoods). In single level ecological analysis we consider all information as if it were at the neighbourhood level neglecting individual components.