Article Text

Abstract
Background Across Europe, socioeconomic inequalities in mortality are large and persistent. To better understand the drivers of past trends in socioeconomic mortality inequalities, we identified phases and potential reversals in long-term trends in educational inequalities in remaining life expectancy at age 30 (e30), and assessed the contributions of mortality changes among the low-educated and the high-educated at different ages.
Methods We used individually linked annual mortality data by educational level (low, middle and high), sex and single age (30+) from 1971/1972 onwards for England and Wales, Finland and Italy (Turin). We applied segmented regression to trends in educational inequalities in e30 (e30 high-educated minus e30 low-educated) and employed a novel demographic decomposition technique.
Results We identified several phases and breakpoints in the trends in educational inequalities in e30. The long-term increases (Finnish men, 1982–2008; Finnish women, 1985–2017; and Italian men, 1976–1999) were driven by faster mortality declines among the high-educated aged 65–84, and by mortality increases among the low-educated aged 30–59. The long-term decreases (British men, 1976–2008, and Italian women, 1972–2003) were driven by faster mortality improvements among the low-educated than among the high-educated at age 65+. The recent stagnation of increasing inequality (Italian men, 1999) and reversals from increasing to decreasing inequality (Finnish men, 2008) and from decreasing to increasing inequality (British men, 2008) were driven by mortality trend changes among the low-educated aged 30–54.
Conclusion Educational inequalities are plastic. Mortality improvements among the low-educated at young ages are imperative for achieving long-term decreases in educational inequalities in e30.
- MORTALITY
- Health inequalities
- DEMOGRAPHY
Data availability statement
Data may be obtained from a third party and are not publicly available. The secondary data that we used as input for our analyses cannot be made publicly available, because the institutes that own the data apply a restricted access policy. The specific output that was used to create the main tables and the figures can be obtained through Open Science Framework (https://osf.io/tk4nw/). The R code(s) can be requested from the first author.
This is an open access article distributed in accordance with the Creative Commons Attribution Non Commercial (CC BY-NC 4.0) license, which permits others to distribute, remix, adapt, build upon this work non-commercially, and license their derivative works on different terms, provided the original work is properly cited, appropriate credit is given, any changes made indicated, and the use is non-commercial. See: http://creativecommons.org/licenses/by-nc/4.0/.
Statistics from Altmetric.com
WHAT IS ALREADY KNOWN ON THIS TOPIC
Socioeconomic inequalities in life expectancy are persistent and have been increasing over time.
WHAT THIS STUDY ADDS
The identification of different phases and important breakpoint in past trends in educational inequalities in life expectancy at age 30 in England and Wales, Finland and Italy (Turin).
Finding out which age and educational attainment groups have mainly driven the phases identified in life expectancy inequality trends.
HOW THIS STUDY MIGHT AFFECT RESEARCH, PRACTICE OR POLICY
Trends in educational life expectancy inequalities are plastic and have not unequivocally increased in all countries from 1972 to 2017.
Trends in educational life expectancy inequalities seem susceptible to socioeconomic and health-related policies.
Improving survival among young people (30–49) with low educational attainment may have the potential to reduce socioeconomic inequalities in life expectancy in all three countries studied.
Introduction
In modern welfare states, people with higher socioeconomic status (SES) live longer than people with lower SES.1 Across Europe, these socioeconomic differences in life expectancy and mortality are large and have even increased in some countries in recent periods1–3 despite efforts to reduce them. Our understanding of the determinants of past trends is currently insufficient to fully grasp the trends in socioeconomic inequalities in life expectancy and mortality.
Most of the previous studies on trends in socioeconomic inequalities in mortality in Europe have analysed short periods of time.4–9 Moreover, in line with the studies on short-term trends, the studies on long-term trends in socioeconomic inequalities in mortality primarily have examined the overall trends from the first to the last observations, without paying particular attention to trend breaks or changes in between.1 2 10–13 Furthermore, most of these studies, including those that analysed trends over a longer period,1 3 10 11 14–18 have used data aggregated over periods of 5 or 10 years, instead of data by a single calendar year. Overall, these studies have shown increases in relative educational inequalities in all-cause mortality,3 declines in absolute educational inequalities in all-cause mortality3 12 and increases in educational inequalities in life expectancy2 4 7 for the European countries they have studied.
Thus, regardless of whether they were examining shorter or longer time periods, most of these studies were unable to accurately identify different phases or reversals of past trends in socioeconomic mortality inequalities. However, identifying such shifts can improve our understanding of the underlying determinants by allowing us to isolate sudden changes and particular events from long-term changes. This could, in turn, provide clues as to whether determinants that have a sudden effect (eg, sudden policy changes), a time-varying effect (eg, the emergence of lifestyle ‘epidemics’) or a more gradual effect (eg, changes in general inequalities in society or opportunities for social advancement) are more important.
Our objective was to identify different phases and potential reversals in past long-term trends in socioeconomic inequalities in remaining life expectancy at age 30 (e30). We were able to identify these patterns because, in contrast to previous studies, we obtained yearly mortality data by educational attainment over a long period of time (from 1971/1972 onwards) for three European populations representing liberal, social democratic and conservative welfare regimes: England and Wales, Finland and Italy (Turin).19 In addition, we used a novel decomposition technique to assess the contributions of mortality changes among the low-educated and the high-educated at different ages to trends in educational inequalities in e30.
Data and Methods
We used all-cause mortality data by highest educational attainment, sex, single age (30+) and single calendar year for England and Wales (1972–2017), Finland (1971–2017) and Italy (Turin) (1972–2019).
These data stem from longitudinal follow-up designs in which the date of an individual’s death is linked to his or her educational information up to 10 years earlier. For England and Wales, we employed a 10-year follow-up of people in the ONS Longitudinal Study (ONS-LS) who were aged 20 and older at the time of the censuses (1971, 1981, 1991, 2001 and 2011).20 The ONS-LS data pertain to a 1% representative sample of the census populations.20 We adjusted the data for England and Wales21 to deal with the inconsistent allocation of individuals to educational groups in the different censuses.22 For Finland, we employed a 5-year follow-up of the census populations (1970, 1975, …, 2015) aged 25 and older using data from Statistics Finland. For Italy, we employed a 10-year follow-up of Turin people aged 20 and older covered in the population censuses (1971, 1981, 1991, 2001 and 2011) that were included in the Turin Longitudinal Study (1972–2019).23 See online supplemental information 1 for more information regarding the data used.
Supplemental material
SES was operationalised as the highest level of completed education. Education is a more stable measure of SES than occupation and income, and it is not subject to reverse causation at higher ages.24 25 In addition, education data are available for both men and women and for more countries and longer time periods than data for occupation and income.25 In line with previous research, we distinguished three educational attainment groups using the International Standard Classification of Education (ISCED) 1997, low (preprimary, primary and lower secondary education; ISCED 0–2), middle (upper secondary and postsecondary non-tertiary education, ISCED 3–4) and high (tertiary education, ISCED 5–6).
To estimate e30 by educational group, we applied standard period life table techniques26 to age-specific mortality rates by country, calendar year, educational attainment group, sex and single age (30–100+, for Italy: 30–95+). We measured educational inequalities in e30 by subtracting e30 for the low-educated from e30 for the high-educated. We decided to focus on e30 as our mortality outcome because it is a health metric that is widely used to monitor population health and longevity. Since it is age-standardised, it allows for comparisons over time, across countries and across population subgroups of different sizes and age structures.27
We used segmented regression to estimate—by sex and country—breakpoints in the trend in educational inequalities in e30 using the package Segmented in R.28 To identify the breakpoints, we employed Davies’ test to assess the existence of a non-constant regression parameter in the linear regression model. To assess whether those trend breaks were statistically significant (p value of <0.05), we performed a likelihood ratio test.
To assess which socioeconomic groups at which ages the mortality trends contributed the most to the reversals in (trends in) educational inequalities in e30, we employed a novel decomposition technique. Our decomposition method extends the linear integral decomposition method29 by decomposing the change over time in a more complicated outcome measure: an outcome measure that represents a difference between subgroups; that is, we decomposed the changes over time in the difference in e30 between the high-educated and the low-educated ( ). Our method assumes that
  is an aggregate index that changes continuously over time and that this change over time is the net result of all underlying changes in the age-specific mortality rates for the two educational groups. We used numerical integration algorithms to estimate the contributions of each age×socioeconomic strata to the change in
  over time. We used the R package Demodecomp,30 with 3-year moving average age-specific mortality rates (30–34, 35–39, …, 95+) for the low-educated and the high-educated as inputs, to enable the change over time in educational inequalities to closely resemble the fitted change over time from our segmented regression.
For our analyses, we used software RStudio V.1.4.1717.
Results
Compared to those in 1971/1972, educational inequalities in e30 in 2017/2019 were larger among British and Italian (Turin) men and among Finnish men and women, but were smaller among British women and were roughly similar among Italian women (figure 1).

Observed and fitted time trends in educational inequalities in remaining e30 (high minus low educational attainment) (in years) by sex and country (England and Wales 1972–2017, Finland 1971–2017 and Italy (Turin) 1972–2019). Fitted time trend based on segmented regression. Solid vertical lines represent the start of ‘faster’ increases in educational inequalities in e30, whereas dashed vertical lines represent the start of stagnating increases or declines in educational inequalities in e30. Source data: ONS Longitudinal Study, Statistics Finland & Turin Longitudinal Study. *For Italy, for the years strongly affected by a heat wave (1983, 2003 and 2015), we used the average life expectancy values (average of the values in the year before and after) as input for the segmented regression. Compared with segmented regression based on the original time series, the main results did not change. e30, life expectancy at age 30.
However, there were different phases and trend breaks in these overall trends (figure 1 and table 1). For England and Wales, a trend break was identified in the 1970s (1976 for men and 1975 for women), indicating the start of a period marked by small declines in educational inequalities in e30 for men (annual declines of −0.03) and constant educational inequalities in e30 for women. While this trend continued among women, it reversed among men in 2008, which led to increases in educational inequalities (annual increases of 0.10). For Finland, a trend break was identified in the 1980s (1982 for men and 1985 for women), indicating the start of a period of significant increases in educational inequalities in e30 (annual increases of 0.10 for men and of 0.07 for women). This trend continued among Finnish women but reversed among Finnish men in 2008, resulting in a slow annual pace of decline of −0.05. For Italy (Turin), a trend break was identified in 1976 among men and in 2003 among women, indicating the start of a period of significant increases in educational inequalities in e30 (annual increases of 0.1 for men and 0.25 for women). Among Italian men, the increases started to stagnate in 1999 at a non-statistically significant annual pace of 0.03, while among Italian women, educational inequalities in e30 started to decline in 2010 at a statistically significant annual pace of 0.017.
Phases of educational inequalities in trends in the remaining e30, identified by breakpoints and slopes, including (in brackets) their 95% CIs by sex and country (England and Wales 1972–2017, Finland 1971–2017 and Italy (Turin) 1972–2019)
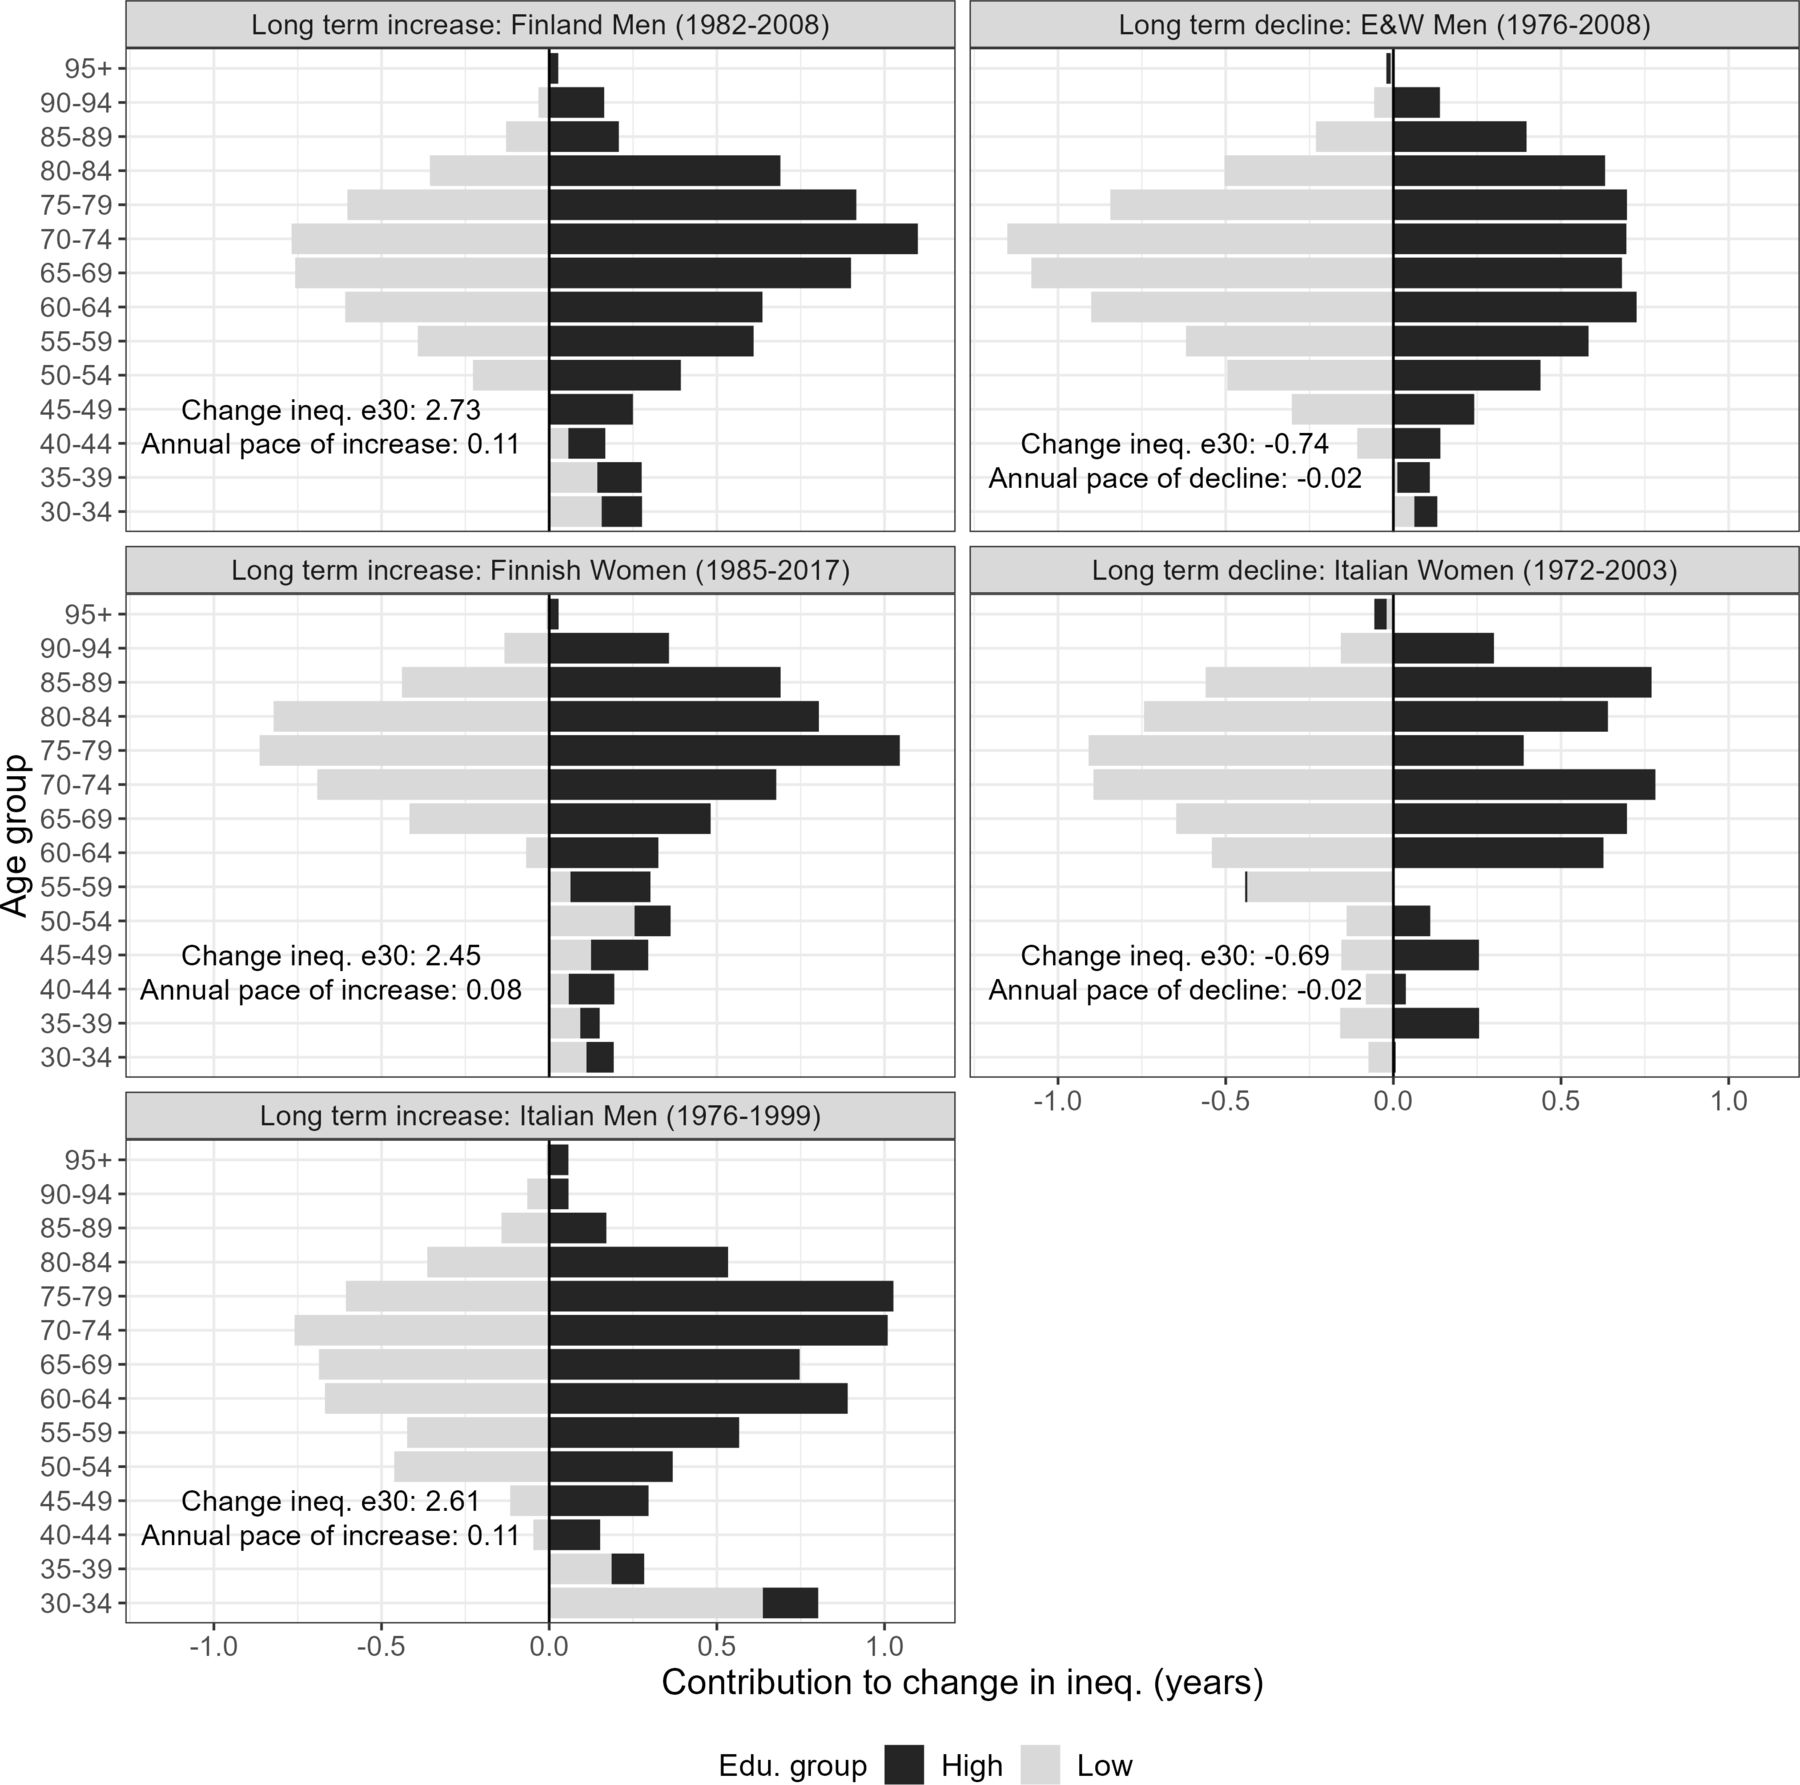
These long-term increases in educational inequalities in e30 (Finnish men, 1982–2008; Finnish women, 1985–2017; and Italian men, 1976–1999) were accompanied by faster increases in life expectancy among the high-educated than among the low-educated (figure 2). More specifically, our decomposition showed the importance of higher mortality decreases among the high-educated than among the low-educated at older ages (ages 70–84 for Finnish men, 75–84 for Finnish women and 70–84 for Italian men), but also of mortality increases among the low-educated at ages 30–59 (ages 30–44 for Finnish men, 30–59 for Finnish women and 30–39 for Italian men) (figure 3). Our observed modest long-term declines in inequalities (British men, 1976–2008, and Italian women, 1972–2003) were accompanied by slightly smaller increases in e30 among the high-educated groups than among the low-educated groups (figure 2). Our decomposition analysis revealed the importance of, in particular, large mortality improvements among low educated British women aged 65–79 and low educated Italian women aged 70–84 (figure 3).

Time trends in remaining e30 by educational group, sex and country (England and Wales 1972–2017, Finland 1971–2017 and Italy (Turin) 1972–2019). Solid vertical lines represent the start of faster increases in educational inequalities in e30, whereas dashed vertical lines represent the start of stagnating increases or declines in educational inequalities in e30. Source data: ONS Longitudinal Study, Statistics Finland & Turin Longitudinal Study. e30, life expectancy at age 30.

Joint contribution of different age groups and educational attainment groups to long-term declines and long-term increases in educational inequalities in e30, by population (England and Wales, Finland, and Italy (Turin)). Based on decomposition analysis using 3-year moving average age-specific mortality rates for the low-educated and the high-educated as inputs. Age-specific mortality declines for the low-educated make a negative contribution to the change in inequality in e30, whereas age-specific mortality declines for the high-educated make a positive contribution to the change in inequality in e30. When, for a specific age group, the ‘negative’ contribution of the low-educated (grey bars on the left of 0) is larger than the ‘positive’ contribution of the high-educated (black bars on the right of 0), this indicates that in this age group, the mortality changes among the low-educated contributed the most to the change in inequality in e30 and vice versa. Source data: ONS Longitudinal Study, Statistics Finland & Turin Longitudinal Study. e30, life expectancy at age 30.
Trend breaks in educational inequalities in e30 were accompanied by trend breaks in e30 predominantly among the low-educated (British men, 2008; Finnish men, 2008; and Finnish women, 1985) (figure 2). For Italian men, a trend break in 1999 occurred among both the low-educated and the high-educated. Our decomposition analysis confirmed the importance of changes in the mortality trend among the low-educated to the recent stabilisation of the strong increase in inequality (Italian men, 1999) and for the reversals from increasing to declining inequality (Finnish men, 2008) and from declining to increasing inequality (British men, 2008), particularly among Finnish men and Italian men aged 30–49 and British men aged 30–54 (figure 4). Especially mortality among the low educated at young ages is changing at the time of the trend breaks in line with the observed trend breaks in educational inequality in e30 (online supplemental figure 1).
Supplemental material

Joint contribution of different age groups and educational attainment groups to recent reversals in trends in educational inequalities in e30, by population (England and Wales, Finland, and Italy (Turin)). Based on decomposition analysis using 3-year moving average age-specific mortality rates for the low-educated and the high-educated as inputs. We selected the years before and after the trend break by selecting the same number of years before and after and by selecting a long enough period (a minimum of 5 years) that resembled the best fitted trends before and after the break. Source data: ONS Longitudinal Study, Statistics Finland & Turin Longitudinal Study. e30, life expectancy at age 30.
Discussion
We identified several phases and breakpoints in the trends in educational inequalities in e30. The phases of long-term increases in educational inequalities in e30 (Finnish men, 1982–2008; Finnish women, 1985–2017; Italian men, 1980–1999) were partly driven by faster mortality improvements among the high-educated aged 65–84 and by mortality increases among the low-educated aged 30–49. The phases of long-term decreases in educational inequalities (British men, 1976–2008, and Italian women, 1972–2003) were driven by mortality improvements among the low-educated population aged 65–84. The recent trend breaks—the reversal from increasing to declining inequalities (Finnish men, 2008), the stagnation of increasing inequality (Italian men, 1999) and the reversal from declining to increasing inequality (British men, 2008)—were driven by mortality trend changes among the low-educated aged 35–49.
Interpretation of results
Comparing the first (1971/1972) and last (2017/2019) years of our study period, we observed a general tendency of increase in educational inequalities in e30 in our study populations, except for British women (overall decline) and Italian women (same level). Our results—based on differences in e30 between the high and low educated—largely resemble the general increase in relative educational inequalities in all-cause mortality observed by previous studies over the period 1970–2009, rather than the simultaneous decline in absolute educational inequalities in all-cause mortality.3
By analysing data by single calendar year, we could identify several phases and breakpoints in the trends in educational inequalities in e30. Next to periods with long-term increases (Finnish men, 1982–2008; Finnish women, 1985–2017; Italian men, 1976–1999), we identified periods of modest long-term declines (British men, 1976–2008, and Italian women 1972–2003) as well as recent trend breaks.
The long-term increases in educational inequalities in e30 can most likely be related to the high educated benefitting earlier and more from the cardiovascular revolution,31 which started in non-Eastern Europe around 1970 and resulted from both changes in health behaviours and advances in medical treatment.32 This explanation is supported by larger percentage reductions in cardiovascular disease mortality among the high than the low educated,3 and more favourable trends in alcohol-related and smoking-related mortality among high socioeconomic groups compared with low socioeconomic groups in Finland,16 and among Italian men.12 For Italian men, the large increase in AIDS mortality from 1985 onwards, particularly among the young,33 which is largely related with drug use among low-educated people34 aged 25–44, potentially contributed to the mortality increases among the low-educated at young ages.
The phases of gradual, modest long-term decline in educational inequalities (British men, 1976–2008, and Italian women, 1972–2003) were predominantly driven by larger mortality improvements among the low-educated than among the high-educated aged 65 and older. This trend may be explained by population-wide improvements in treatment that also benefitted the low educated, and among whom the treatments had larger effects.15 Indeed, for England, it appears that the low-educated, and particularly low-educated men, benefitted from improvements in the early detection and treatment of cardiovascular diseases (eg, hypertension detection and treatment, thrombolytic therapy),35 36 which led to larger absolute declines in cardiovascular disease mortality among the low-educated than among the high-educated.3 For Italian women, a potential role is foreseen of the National Health Service (NHS) reform since the early 1980s, which made healthcare more universally accessible.12 In line with this is the large decrease in educational inequalities in cardiovascular disease mortality among Italian women between 1977 and 1981 and between 2002 and 2006 due to stronger decreases in cardiovascular disease mortality among the low-educated than the high-educated.12
The long-term increases and declines in educational inequalities, thus, seem influenced by determinants and developments with a differential but more gradual effect, such as the effect of the cardiovascular revolution and of population-wide improvements in treatment.1 32
The recent—rather abrupt—trend breaks we observed (the reversal from increasing to declining inequality (Finnish men, 2008), the stagnation of increasing inequality (Italian men, 1999) and the reversal from declining to increasing inequality (British men, 2008) may, however, be related to rather abrupt changes in either socioeconomic policies or health-related policies that mainly affected mortality among the low-educated population aged 35–49; that is, in Finland, alcohol-attributable mortality is an important determinant of both levels and trends in socioeconomic inequalities in mortality.16 Following a substantial reduction of alcohol tax and alcohol prices in 2004, taxes were again increased from 2008 onwards.37 Thereafter, alcohol-attributable mortality declined in Finland,37 reversing the earlier pattern of large increases in alcohol-attributable mortality among deprived men in particular.38 Among Italian men, the stagnation of the increase in educational inequalities in 1999 is accompanied by a reversal from increase to decline in relative inequalities in both cardiovascular disease mortality and smoking-related mortality.12 This might indicate that the effect of the NHS reform since the early 1980s has been counterbalanced by the increasing inequalities in smoking-attributable mortality, up to about 1999, and only demonstrated afterwards. Indeed, absolute inequalities in cardiovascular disease mortality declined between 1977 and 1981 and between 2002 and 2006.12 In England and Wales, a prolonged period of austerity has been identified as one of the likely causes of the slower life expectancy improvements observed since 2010.39 In this period, mortality declines stagnated foremost among the younger ages and in neighbourhoods with high levels of social deprivation.40
Limitations
In line with most previous research into long-term trends in socioeconomic health inequalities, we operationalised SES as the highest level of completed education while using fixed educational categories (low, middle and high). However, throughout the study period, the low-educated group decreased sharply in size, while the middle-educated and the high-educated groups increased in size (online supplemental figure 2). This so-called educational expansion resulted in the low-educated becoming more selected over time and more likely to exhibit higher mortality.41 It has been argued that this health-related social selection may, in itself, result in increases in educational inequalities over time.4 8 10 14 Such an effect of health-related social selection can be avoided by using relative measures of educational level, such as quantile distributions. However, while this selection process can indeed contribute to long-term increases in educational inequalities in mortality, it cannot explain the recent trend breaks that we observed, or the declines in educational inequalities we found among British men in 1976–2008 and Italian women in 1972–2003. Moreover, previous research has shown that although levels of educational differences in e30 can differ substantially, depending on whether a quantile educational distribution or a fixed educational threshold is used, they tend to follow the same trend over time.14
For Finland, we were able to analyse data covering the whole country. However, for Italy, we relied on long-term data for Turin city, while for England and Wales, we relied on a 1% representative sample of the census populations. This has several consequences. First, the data for Italy and for England and Wales were based on fewer people, resulting in less robust estimates. Consequently, the e30 values of the high-educated in these populations fluctuated strongly over time, as did estimates of educational inequalities in e30. To deal with these issues, we relied on segmented regression instead of visual inspection of year-to-year trends, and we decomposed a change over time as estimated using segmented regression. Nonetheless, the trends in educational inequalities we identified for England and Wales and for Italy (Turin), particularly in the early years, should be interpreted with some caution. Second, the alignment of our data with national data and the generalisability of our outcomes might be called into question. However, for England and Wales, we adapted the data so that the person-years and death counts for the three educational groups combined aligned perfectly with the national data, while maintaining the educational inequalities (online supplemental figure 3). For Italy, the e30 levels and the trends for the total Turin population we observed were largely in line with those for Italy as a whole (online supplemental figure 2). In addition, previous research has documented that the levels and the trends in socioeconomic inequalities in mortality in Turin are largely representative of those of Italy as a whole,6 42 with the exception that the mortality inequalities tend to be larger in urban regions in Southern Italy.43 Some caution is therefore warranted when generalising our findings for Italy (Turin) to Italy as a whole.
Conclusion
Through the use of yearly mortality data by educational level, we were able to identify different phases and breaks in past trends in educational inequalities in remaining e30 in England and Wales, Finland and Italy (Turin). The identified breaks indicate that educational inequalities in mortality are plastic. We thus suggest that, in addition to factors that evolve over longer periods of time, explanations of trends in mortality inequalities give due regard to societal determinants and developments with an abrupt effect. The (reversals in) past trends in educational inequalities in e30 the three countries were largely driven by mortality trends among the low-educated population aged 30–49. Thus, it appears that mortality improvements among the low-educated at young ages are imperative for achieving long-term decreases in educational inequalities in e30.
Data availability statement
Data may be obtained from a third party and are not publicly available. The secondary data that we used as input for our analyses cannot be made publicly available, because the institutes that own the data apply a restricted access policy. The specific output that was used to create the main tables and the figures can be obtained through Open Science Framework (https://osf.io/tk4nw/). The R code(s) can be requested from the first author.
Ethics statements
Patient consent for publication
Ethics approval
Not applicable.
Acknowledgments
The permission of the Office for National Statistics to use the Longitudinal Study is gratefully acknowledged, as is the help provided by the staff of the Centre for Longitudinal Study Information & User Support (CeLSIUS). CeLSIUS is funded by the ESRC under project ES/V003488/1. The authors alone are responsible for the interpretation of the data. This work contains statistical data from ONS, which is subject to Crown copyright. The use of the ONS statistical data in this work does not imply the endorsement of the ONS in relation to the interpretation or analysis of the statistical data. This work uses research datasets that may not exactly reproduce National Statistics aggregates.
References
Supplementary materials
Supplementary Data
This web only file has been produced by the BMJ Publishing Group from an electronic file supplied by the author(s) and has not been edited for content.
Supplementary Data
This web only file has been produced by the BMJ Publishing Group from an electronic file supplied by the author(s) and has not been edited for content.
Footnotes
Twitter @JessDanielZB, @jm_aburto
Correction notice This article has been corrected since it was first published. The data availability statement has been corrected.
Contributors FJ, JDZ-B, AEK and PM contributed to the conception and the design of the study. RP prepared the data for Finland; NZ prepared the data for Italy; and AS played a vital role in obtaining and preparing the data for England and Wales. JMA provided the script for performing the decomposition. JDZ-B conducted the analysis, interpreted the results and drafted the manuscript, with help from FJ, AEK and PM. All authors revised the work critically for intellectual content and approved the final submitted version of the work. JDZ-B is the guarantor.
Funding This work is funded by the Netherlands Organisation for Scientific Research as part of the research project 'Forecasting future socio-economic inequalities in longevity: the impact of lifestyle ‘epidemics' (under grant number VIC.191.019; see www.futurelongevitybyeducation.com). PM was supported by the Academy of Finland (#308247 and #345219) and received funding from the European Research Council under the European Union’s Horizon 2020 research and innovation programme (grant agreement number 101019329) and the Max Planck–University of Helsinki Center for Social Inequalities in Population Health. JMA was supported by the European Union’s Horizon 2020 Research and Innovation programme (under the Marie Sklodowska-Curie grant agreement number 896821). The funding sources had no role in the study design, collection, analysis or interpretation of the data; in the writing of the manuscript; or in the decision to submit the paper for publication. The study does not necessarily reflect the views of the funding organisations and in no way anticipates the future policy in this area of the funding organisations.
Competing interests None declared.
Provenance and peer review Not commissioned; externally peer reviewed.
Supplemental material This content has been supplied by the author(s). It has not been vetted by BMJ Publishing Group Limited (BMJ) and may not have been peer-reviewed. Any opinions or recommendations discussed are solely those of the author(s) and are not endorsed by BMJ. BMJ disclaims all liability and responsibility arising from any reliance placed on the content. Where the content includes any translated material, BMJ does not warrant the accuracy and reliability of the translations (including but not limited to local regulations, clinical guidelines, terminology, drug names and drug dosages), and is not responsible for any error and/or omissions arising from translation and adaptation or otherwise.