Article Text

Abstract
Background The early COVID-19 pandemic in Scotland—defined as the era before widespread access to vaccination and monoclonal antibody treatment—can be characterised into three distinct waves: March–July 2020, July 2020–April 2021 and May–August 2021. Each wave was met with various societal restrictions in an effort to reduce disease transmission and associated morbidity and mortality. Understanding the epidemiology of infections during these waves can provide valuable insights into future pandemic planning.
Methods Scottish RT-PCR testing data reported up until 8 August 2021, the day prior to most restrictions being lifted in Scotland, were included. Demographic characteristics including age, sex and social deprivation associated with transmission, morbidity and mortality were compared across waves. A case–control analysis for each wave was then modelled to further compare risk factors associated with death over time.
Results Of the 349 904 reported cases, there were 18 099, 197 251 and 134 554 in waves 1, 2 and 3, respectively. Hospitalisations, intensive care unit admissions and deaths appeared highest in wave 2, though risk factors associated with COVID-19 death remained similar across the waves. Higher deprivation and certain comorbidities were associated with higher deaths in all waves.
Conclusions Despite the higher number of cases reported in waves 2 and 3, case fatality rates were lower: likely a combination of improved detection of infections in younger age groups, introduction of social measures and vaccination. Higher social deprivation and comorbidities resulted in higher deaths for all waves.
- COVID-19
- DEATH
- EPIDEMIOLOGIC MEASUREMENTS
- HEALTH POLICY
- PUBLIC HEALTH
Data availability statement
No data are available.
This is an open access article distributed in accordance with the Creative Commons Attribution Non Commercial (CC BY-NC 4.0) license, which permits others to distribute, remix, adapt, build upon this work non-commercially, and license their derivative works on different terms, provided the original work is properly cited, appropriate credit is given, any changes made indicated, and the use is non-commercial. See: http://creativecommons.org/licenses/by-nc/4.0/.
Statistics from Altmetric.com
WHAT IS ALREADY KNOWN ON THIS TOPIC
Since the beginning of the COVID-19 pandemic, large surges or peaks in cases of COVID-19 have been described as waves, and several studies have attempted to compare the burden of disease from COVID-19 within such waves. However, there is little understanding around the changing epidemiology of COVID-19 across multiple waves in the context of evolving policy. Scotland’s comprehensive surveillance system allows this comparison to be made and is a vital tool for providing evidence-based decisions for future pandemic planning.
WHAT THIS STUDY ADDS
This study provides insight into the changing epidemiology of COVID-19 during the first three waves in Scotland, creating a narrative for the impact of various testing and mitigation policies on case numbers, and identifying the key risk factors for COVID-19 mortality.
HOW THIS STUDY MIGHT AFFECT RESEARCH, PRACTICE OR POLICY
These findings demonstrate how testing policy influenced the observed epidemiology of COVID-19 in Scotland and may inform preparedness for future waves. Identifying risk factors associated with greater disease burden from COVID-19 provides evidence for future pandemic policy planning.
Introduction
Scotland reported its first case of COVID-19, the disease caused by SARS-CoV-2, in March 2020.1 Over the following 20 months, the outbreak within Scotland can be characterised by a first wave of infections from March to July 2020, a second wave spanning to April 2021 and a subsequent third wave to August 2021, when the Scottish Government moved to ‘level 0’ and almost all restrictions in Scotland were lifted.1 The waves studied here predate widescale vaccination and the introduction of monoclonal antibodies, as the impact of novel therapeutic interventions is beyond the scope of this paper. The first wave of infections were characterised by a number of circulating lineages of SARS-CoV-2, while the second and third waves were associated with two dominant variants: B.1.1.7 (Alpha) and B.1.617.2 (Delta), respectively. Alpha was first detected in Scotland in November 2020 and became the dominant variant by early 2021.2 The Alpha wave was followed by Delta, the variant that came to dominance in May 20213 and accounted for >90% of newly reported cases in Scotland up to the end of wave 3.
As the virus has evolved, so too has the national response. Over time, testing access and uptake in Scotland has increased, transmission dynamics are better understood, and there has been significant investment in public health infrastructure. The national response in Scotland has included the implementation of non-pharmaceutical policies such as lockdowns, social distancing and use of masks in public places, the development of more effective treatment practices4 and the introduction of a successful vaccination programme.5 December 2020 witnessed the first approved COVID-19 vaccine, Pfizer-BioNTech, being deployed in Scotland,6 followed by the Oxford-AstraZeneca and Moderna vaccines in January 2021 and April 2021, respectively.6 Approximately 50% of eligible Scottish residents (2.58 million individuals) had their first dose of vaccine by the end of wave 2; by the end of wave 3, 4.04 million and 3.38 million individuals had their first and second doses, respectively.7
Previous pandemic viruses have also typically presented in waves of infection; notably, the 1918 influenza pandemic occurred over three distinct waves, with the second and third waves proving most deadly.8 Studies investigating the epidemiology of more recent respiratory viruses, such as pandemic H1N1 and the 2002–2003 SARS outbreak, have demonstrated similar patterns.9 10 Although still early, currently published studies comparing the first few waves of COVID-19 have found an opposing pattern, with lower associated mortality or case fatality rates (CFRs) in subsequent waves compared with the first wave.11–14 These observed decreases in mortality during later waves may be partly attributable to improved case detection, allowing for increased identification of mild or asymptomatic cases.
Aims
The aim of this paper is to compare the first three waves of the COVID-19 pandemic in Scotland with a view to describing and comparing the demographics of each wave to investigate the impact of social restrictions and testing policy on COVID-19 epidemiology. In addition, this paper aims to model deaths in each wave to identify vulnerable groups and to assess whether risk factors associated with COVID-19 mortality changed overtime in response to shifting national policies.
Methods
Data
Data were extracted from Public Health Scotland’s Corporate Data Warehouse on 9 August 2021. The Community Health Index, a unique patient identifier used to link Scottish health data, was used to identify instances of hospitalisations, intensive care unit (ICU)/high-dependency unit (HDU) admissions, comorbidities and deaths among people with a recent COVID-19 diagnosis. More detailed information on data sources and definitions used in this analysis are provided in table 1.
Data sources and definitions
Supplemental material
A wave is defined as a surge in cases followed by a subsequent decline, often driven by emergence of significant viral variants. For the purposes of this analysis, wave 1 is defined as 2 March 2020–5 July 2020, wave 2 as 6 Jul 2020–4 April 2021, and wave 3 as 5 April 2021– 8 August 2021 inclusive. Dates for waves 2 and 3 are largely consistent with the rise in the Alpha and Delta variants, though wave 2 also includes the rise in cases observed from September 2020, which preceded Alpha emergence.
Analysis
Analysis was conducted using the R stats package (V.3.6.1) and Microsoft Excel.
Demographic analysis
RT-PCR positive test data were divided into the predefined waves. Data were broken down by demographic characteristics: age, sex and Scottish Index of Multiple Deprivation (SIMD) based on geographic post code, and total numbers, percentages and CFRs were calculated for each wave. Testing rates and case counts are presented alongside dates of significant infection control measures adopted or removed within Scotland.
Deaths analysis
The analysis of deaths used a dichotomous response variable: cases (COVID-19 positive death) versus controls (COVID-19 positive survived). The explanatory variables consisted of age, sex, SIMD quintile and individual comorbidities (online supplemental table A2). Comorbidities were selected based on previous association with adverse COVID-19 outcomes.15–17
Analysis was conducted using the R stats package (V.3.6.1). Generalised linear models (GLMs) were used (binomial logistic regression) to investigate whether an association existed between a COVID-19 death and demographic characteristics. The response of the GLMs followed a binomial distribution and the logit link function was used to model the probability of a fatality occurring given the selected risk factors. Interaction between age and sex was considered.
For each wave, the full model was specified to include all variables and interaction terms. Variables were removed using backwards stepwise selection based on a significance level, p<0.05. Hierarchal nested models were compared, and the best fitting model was chosen to use log-likelihood ratio tests, resulting in one final model per wave. The linear variable, age, met the requirement that any continuous independent variable must have a linear relationship with the logit transformation of the dependent variable (online supplemental figure A1). ORs and CIs were calculated and McFadden’s pseudo R2 values were used to evaluate model fit.
Results
Demographic analysis
In total, 349 904 SARS-CoV-2 positive cases were recorded in Scotland between 2 March 2020 and 8 August 2021 (figure 1). Figure 1 shows the weekly case count over the study period (A), test count (B) and vaccinations among study participants (C) by wave, with key testing and restriction policies highlighted alongside vaccination milestones.

Epidemiology of first three COVID-19 waves in Scotland with key policy dates noted. (A) Weekly count of RT-PCR confirmed COVID-19 cases recorded in Scotland between 3 March 2020 and 8 August 2021. (B) Weekly count of RT-PCR tests conducted in Scotland between 3 March 2020 and 8 August 2021. (C) Cumulative vaccine doses delivered to individuals within study population by age and date of dose. *Lighthouse Labs are high-throughput UK government Labs set up to support testing capacity.
The majority of detected cases were recorded during wave 2 (n=197 251), followed by wave 3 (n=134 554), and wave 1 (n=18 099) (figure 1A, table 2). However, testing was not equitable across the three waves, as provision increased from wave 1 to 2 and 3, with over 200 000 weekly tests recorded at the peak of wave 3 (figure 1B), compared with a peak of 62 143 tests per week for wave 1 and 166 270 for wave 2.
Demographic characteristics of diagnosed SARS-CoV-2 cases in the first three COVID-19 waves in Scotland
Vaccination roll-out began in December 2020, during wave 2 (figure 1C). By May 2021, the majority of over 40-years had received their first vaccine dose and by July 2021, over 50% of the wider Scottish population had received two vaccine doses (figure 1A), predominantly in older age groups. Vaccinations were not offered for school age groups until after the end of wave 3.
There were three times the number of ICU patients and four times as many HDU patients in wave 2 (ICU: n=1296, HDU: n=1522) compared with wave 1 (ICU: n=507, HDU: n=357). Wave 3 saw the lowest number of ICU and HDU patients with 290 and 288, respectively. While the number of deaths within 28 days of a reported positive test were highest in wave 2 (n=5133), CFR was highest in wave 1 (14.1%).
In the first two waves, a higher proportion of cases were female; however, there were more male patients in ICU and HDU in every wave (62%–72%). Similarly, deaths were higher among males in all three waves. In wave 1, CFR for males was almost double that of females (19.5% vs 10.8%). This difference decreased in wave 2 (2.9% vs 2.3%) and further in wave 3 (0.3% vs 0.2%).
The proportion of cases represented by under 40 years increased from 23.0% in wave 1 to 50.6% in wave 2, then increased to 71.5% in wave 3. Across all waves, the highest proportion of deaths was seen among those aged ≥80 years. CFR decreased across all age categories between each wave, most notably among those aged ≥60 years.
Deaths analysis
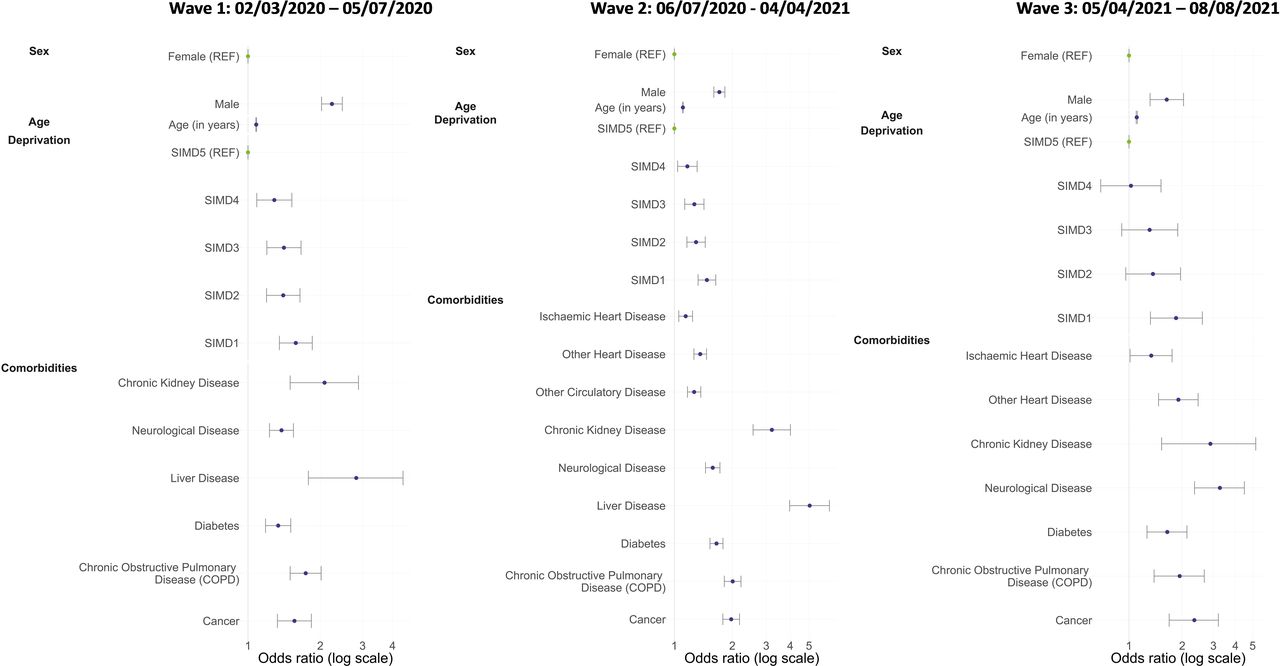
There were 2542, 5124 and 398 deaths included in models across waves 1, 2 and 3, respectively, and 15 528, 91 414, 133 280 survived cases for comparisons. Those missing information of SIMD were excluded. For all three waves, and in agreement with previous studies,18 compared with COVID-19 survived cases, male sex, older age, increased levels of deprivation and various comorbidities were all associated with significantly increased odds of a COVID-19 death (table 3; figure 2). Comorbidities including chronic kidney disease (CKD), neurological disease, diabetes, chronic obstructive pulmonary disease (COPD) and cancer were strongly associated with a COVID-19 death across all waves. Waves 1 and 2 had the addition of liver disease as a significant risk factor, while wave 2 also included ischaemic heart disease, other heart disease and circulatory disease. Wave 3 included ischaemic and other heart disease as significant risk factors for death.
Results of logistic regression (generalised linear model) of factors associated with COVID-19 deaths versus COVID-19 cases (see online supplemental table A3 for coefficients)
ORs and 95% CI of factors associated with COVID-19 deaths for wave 1, wave 2 and wave 3. SIMD, Scottish Index of Multiple Deprivation.
Older age as a risk factor for death remained constant across all three waves (table 3). Relative to a COVID-19 survived case, a COVID-19 death in wave 1 was twice as likely among males than females (OR 2.24, 95% CI 2.03 to 2.48, p<0.001), but this association was attenuated during the second and third waves (OR 1.71, 95% CI 1.60 to 1.83, p<0.001, and OR 1.63, 95% CI 1.31 to 2.02, p<0.001, respectively).
Across all waves, compared with a COVID-19 survived case, the odds of a COVID-19 death increased in relation to increasing levels of deprivation. Relative to the least deprived quintile (SIMD5), we observed a significant increase in odds associated with all other deprivation quintiles across waves 1 and 2; whereas in wave 3, only the most deprived quintile, SIMD1, showed significantly increased odds. There were no cases/deaths with ischaemic heart disease, other heart disease or other circulatory disease in wave 1, and no cases/deaths with other circulatory disease or liver disease in wave 3.
The interaction term between age and sex was not selected for any wave due to lack of significance and improvement to the model fit (see online supplemental information). For the final models, the McFadden Pseudo R2 values indicated excellent fit (see online supplemental information).
Discussion
This is the first study to evaluate three distinct waves of the COVID-19 pandemic at a national level in Scotland, assessing how changes to national policy shaped infections observed. Identification of risk factors can inform guidance for subsequent waves of COVID-19 or future respiratory pandemics and may be used to aid comparisons to countries with different testing policies, allowing an international perspective. This also presents a baseline of understanding and provides contextual information with which future waves could be compared.
Wave 1 appears to have had far fewer cases compared with waves 2 and 3 (figure 1, table 2), however, testing was established and began scaling-up during this wave, with testing only available for all those with symptoms from wave 2 onwards.19 In wave 3, asymptomatic contacts of cases could also be tested.20 Because of this, tests during wave 1 were limited, and priority given to healthcare workers (reasonably young and healthy working aged population) and those in hospitals or care homes (older and more vulnerable).21
The shift in demographics across the waves is partly attributable to increased testing availability. For example, the majority of cases in waves 1 and 2 were female (62% and 54%, respectively) (table 2). Females account for 80% of National Health Service employees22 and 73% of caregiving roles in Scotland,23 therefore, cases among women were more likely to be captured through non-symptomatic, workplace testing. In addition, these roles would have been at higher risk of exposure, especially in wave 1, as other sectors had closed down while health and social care staff continued. Atypically, wave 3 witnessed a higher proportion of male cases, which elsewhere has been shown to be due to increased community transmission and large scale events returning such as the EURO 202024 football championship.24 25
Changes in testing and vaccination policies have also shifted the age of identified cases over the pandemic. In wave 1, 77% of identified cases were aged 40 and over, whereas in waves 2 and 3 most cases were aged under 40 years (51% and 72%, respectively). This may be due to asymptomatic cases being more common in younger people,26 27 precluding them from testing during wave 1 and wave 2. In the latter case, asymptomatic close contacts were only offered testing in Scotland from the end of the second wave (figure 1B). Furthermore, as vaccinations were prioritised for older age groups (figure 1C), the demographics most at risk of infection would have shifted into younger, predominantly unvaccinated, individuals over waves 2 and 3.
In addition, a spread into care homes was seen in Scotland prior to the initial UK-wide lockdown in March 2020.28 As the average age of Scotland’s care home population in 2019 was 82 years,29 outbreaks observed here may also have contributed to the older age of detected cases in wave 1, alongside differences in disease severity and vaccination coverage as previously discussed. At the same time, national lockdown and closure of educational establishments meant younger age groups were less likely to be exposed to SARS-CoV-2. When educational establishments reopened in August 2020 and again in February 2021, this precipitated outbreaks in these settings, bringing down the average age of cases. Lack of vaccination offer or uptake in those aged under 40 compared with those over 40 (figure 1C) further compounded this risk as society reopened.
Infections in older age groups likely contributed to the higher CFR in wave 1 compared with waves 2 and 3. As mild or asymptomatic cases were identified in waves 2 and 3, this also increased the denominator and likely provided a more accurate measure of CFR in later waves. In wave 1, CFR is substantially higher for males when compared with females (19.5% vs 10.8%), and this was also demonstrated in the logistic regression analysis (table 3), in which deaths in males were twice as common as deaths in females. The CFR and logistic regression both showed an attenuation of this in waves 2 and 3. This may be related to a number of female cases identified in wave 1 likely being health and social care workers,22 as milder cases may have been identified through workplace screening.
However, this alone may not explain the difference, as higher rates of deaths and serious infection among older males demonstrated in this analysis are observed elsewhere.30 Risk for males may also be attributable to higher rates of comorbidities; for example, ischaemic and coronary heart disease are more common in males.31 Adverse COVID-19 outcomes have been linked to smoking,32 also more prevalent among older males in Scotland.33 Preliminary research has also identified potential sex-based differences in immune responses, which may further account for these differences.34
CFR drops substantially in every demographic category between waves 2 and 3, where testing between these waves was much more comparable. Measures such as vaccinations likely contributed to a reduction in the CFR.3
Besides sex, the other risk factors investigated for COVID-19 death did not differ significantly across the three waves (table 3; figure 2). Comorbidities found to be associated with death, such as CKD, COPD and cardiovascular diseases, are common diseases of old age. This is expected as old age is a strong risk factor for mortality (figure 2).35 Our analysis also highlights that deprivation (SIMD) was a significant risk factor for COVID-19 fatality across all waves, also previously demonstrated.36 However, confounding should be considered as a potential limitation due to differences in testing access by deprivation status. In addition, due to health inequalities, a larger proportion of individuals in socioeconomically deprived areas suffer from comorbidities linked to increased risk of severe outcomes following COVID-19 infection.37
Limitations
Case detection across the three waves differed significantly, due to testing policies and provisions at the time. While investigating the observed epidemiology in response to policy is an objective of this paper, it is also a limitation as comparisons in mortality are challenging in the context of changing denominators.
In addition, vaccinations were not included in modelling of deaths. Vaccination has been demonstrated elsewhere to have a profound effect in reducing COVID-19 morbidity and mortality,38 but there was significant confounding here due to those most at risk of death (older adults, care home populations) being prioritised for vaccination. This makes comparisons between wave 1 and 3 particularly difficult.
A further limitation to the logistic regression analysis is the lack of ethnicity data available. Previous studies have found an increased risk of severe SARS-CoV-2 outcomes for certain ethnicities.39 40 The inclusion of ethnicity in the analysis would provide a more comprehensive report of the potential risk factors associated with SARS-CoV-2 fatality.
Logistic regression is a robust statistical technique that suited the nature of the data. Bayesian methods were considered for the analysis, but the novelty of the SARS-CoV-2 meant priors would be difficult to estimate. Further studies could use the results presented here to estimate priors for future Bayesian modelling. Despite these limitations, this study has demonstrated the differences in the epidemiology of the pandemic over three distinct waves.
Conclusions
Testing coverage improved from wave 1 to 2 and 3. The decreases observed in CFR from wave 1 to wave 2 are likely due to better identification of cases providing a higher denominator and compounded by better identification of cases in younger age groups at lower risk of fatality. Deaths modelling indicates that demographics of those dying did not differ significantly between waves. Further, decreases in deaths from wave 2 into 3 are likely due to vaccination though we have not empirically demonstrated this here.
These findings demonstrate how testing policy influenced the observed epidemiology of COVID-19 in Scotland and may inform preparedness for future waves. Specifically, protecting clinically at-risk groups by reducing risk of outbreaks in care homes should be a priority for a future pandemic planning.
Data availability statement
No data are available.
Ethics statements
Patient consent for publication
Ethics approval
As PHS is obligated to process data for public health investigations in accordance with the Public Health (Scotland) Act 2008, individual patient consent is not required. Data were sufficiently anonymised prior to analysis and no individual/identifiable information presented in outputs.
Acknowledgments
The authors would like to thank Mirza Amir Baig, Anneke Van Belle, Paul Bett, Susan Brownlee, Ross Cameron, Nicolaos Christofidis, Laura Dobbie, Genna Drennan, Emily Griffiths, David Henderson, Melissa Llano, Maureen O’Leary, Saad Malik, Andrew MacAuley, Edward McArdle, Eisin McDonald, Isobel Mclachlan, Dan McPhail, Sema Nickbakhsh, Johanna Young, Nick Young, and Hailey Zislis of the Public Health Scotland Real Time Epidemiology team for their contribution to the data collection and reporting.
References
Supplementary materials
Supplementary Data
This web only file has been produced by the BMJ Publishing Group from an electronic file supplied by the author(s) and has not been edited for content.
Footnotes
Contributors KL and BF contributed equally to this paper. Project conception and planning by KL, BF, TR, AEW, LIG, CH, LW and VPH. LIG, VPH and KL drafted the manuscript and redrafting/additional analyses planning was by KL, BF, AM, AmW and KM. Data extracts, linkage and cleaning by JB, CH and TR. Analyses performed by BF, KL, CH, TR, ApW and AEW. All authors contributed to editing and read and agreed the final manuscript. KL is the guarantor for this work.
Funding The authors have not declared a specific grant for this research from any funding agency in the public, commercial or not-for-profit sectors.
Competing interests None declared.
Provenance and peer review Not commissioned; externally peer reviewed.
Supplemental material This content has been supplied by the author(s). It has not been vetted by BMJ Publishing Group Limited (BMJ) and may not have been peer-reviewed. Any opinions or recommendations discussed are solely those of the author(s) and are not endorsed by BMJ. BMJ disclaims all liability and responsibility arising from any reliance placed on the content. Where the content includes any translated material, BMJ does not warrant the accuracy and reliability of the translations (including but not limited to local regulations, clinical guidelines, terminology, drug names and drug dosages), and is not responsible for any error and/or omissions arising from translation and adaptation or otherwise.